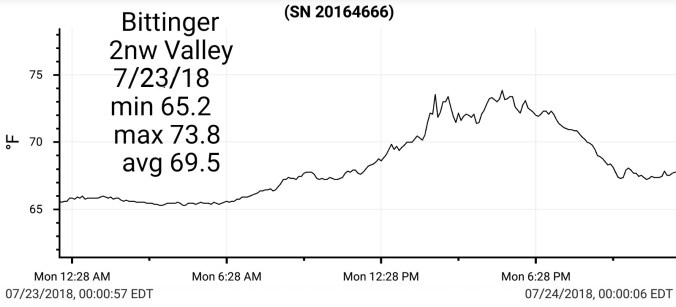
Cloudy, some high ground fog, east flow…clouds held tough in the traditional cooler east flow locations. Breaks elsewhere..Heavy period of rain after 4pm.
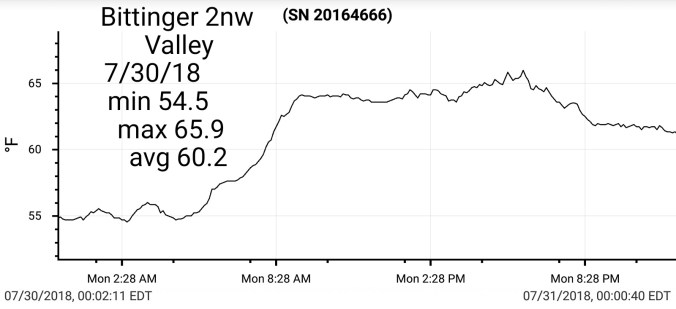
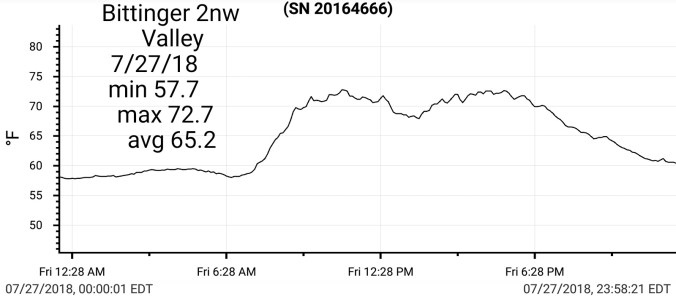
Temp profile this afternoon
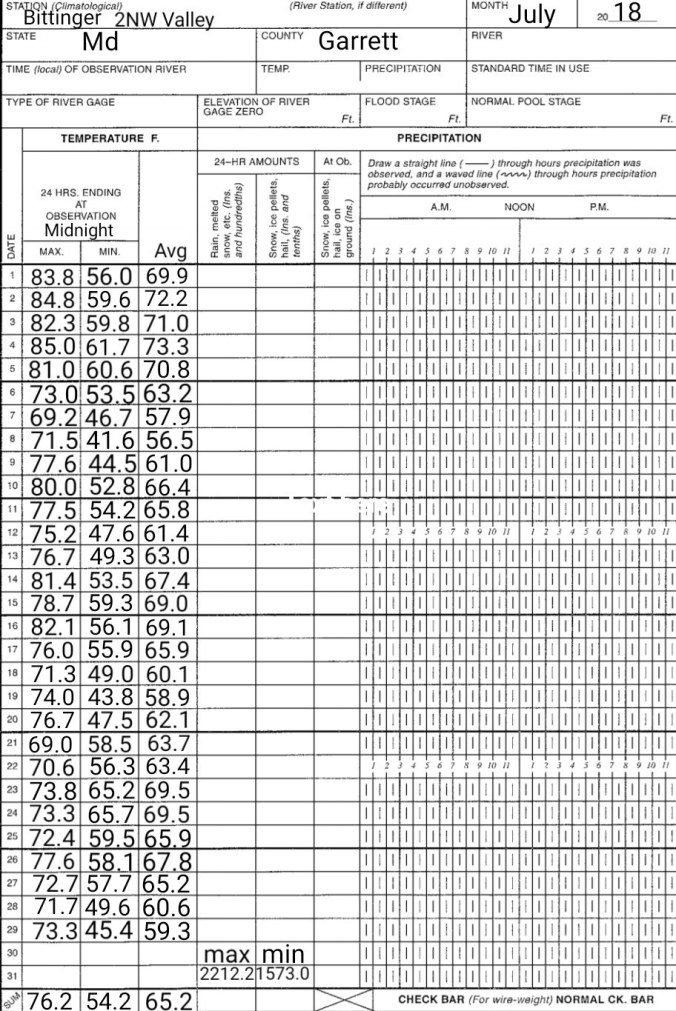
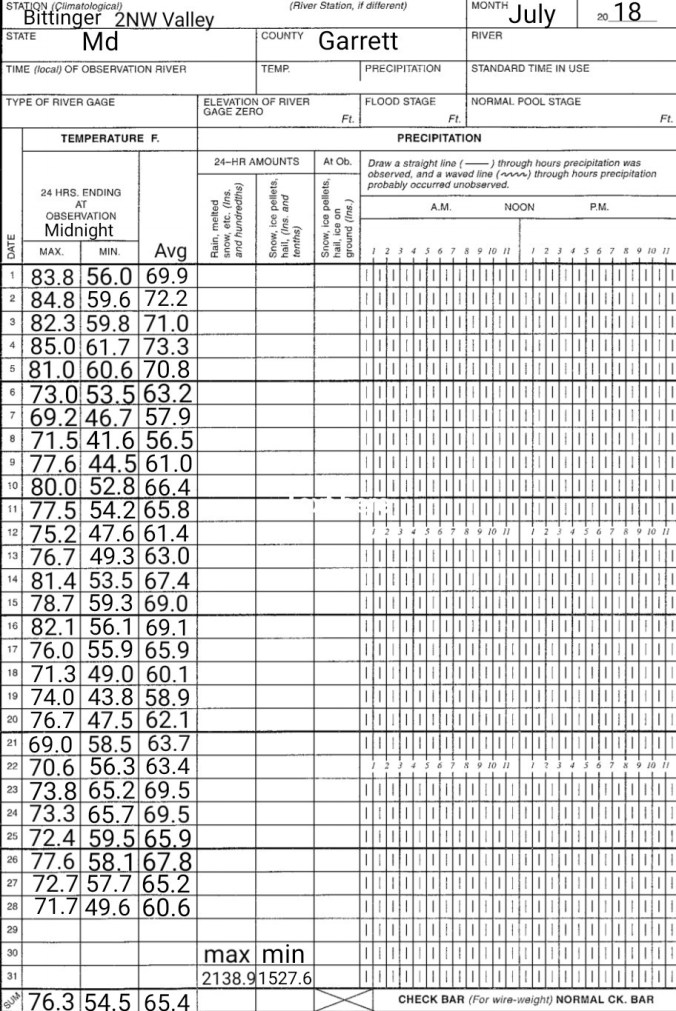
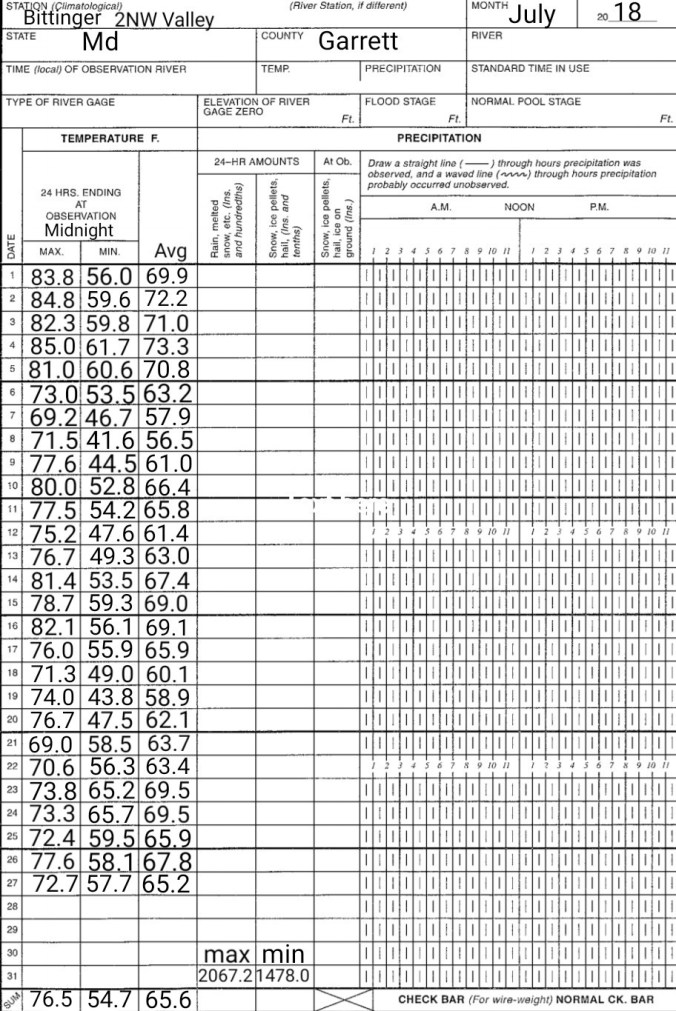
(July Summary at page bottom)
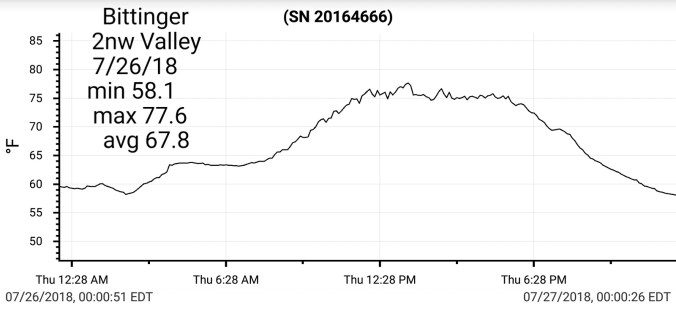
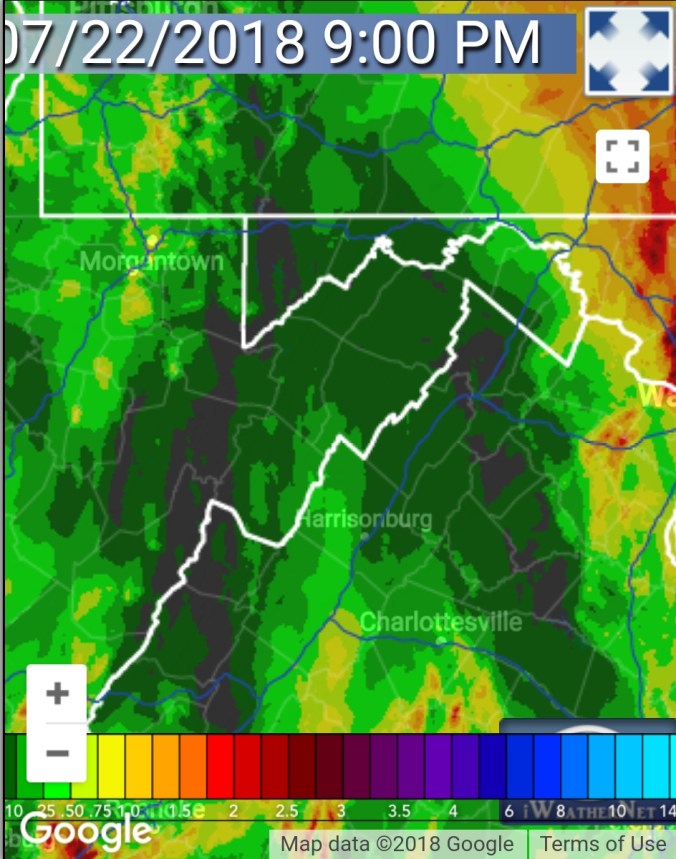
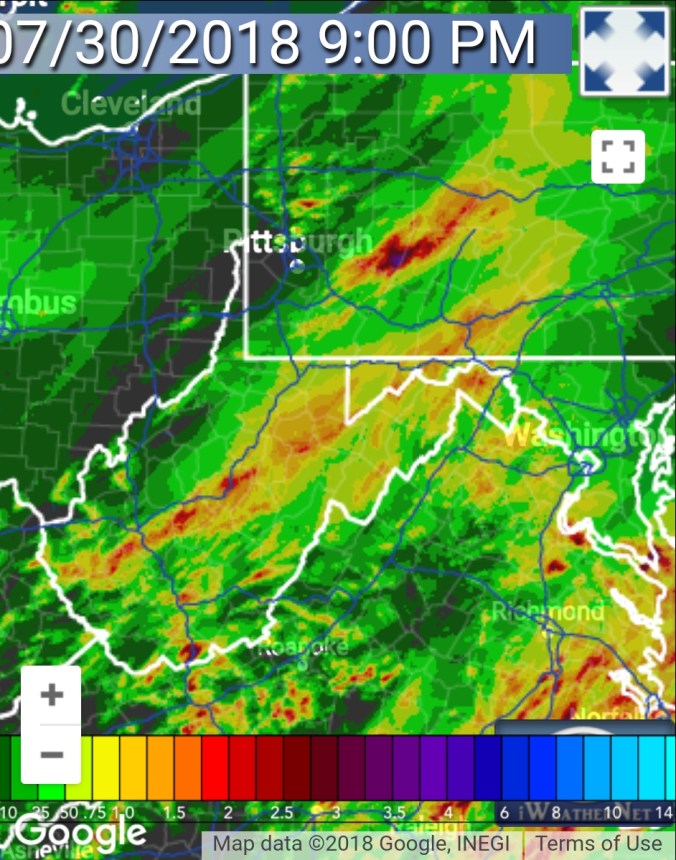
Radar with estimates I picked up .9 at Bittinger 2nw Valley, Garrett College also at .9
Satellite this afternoon
Flow
Surface features and 500mb height anomalies and flow
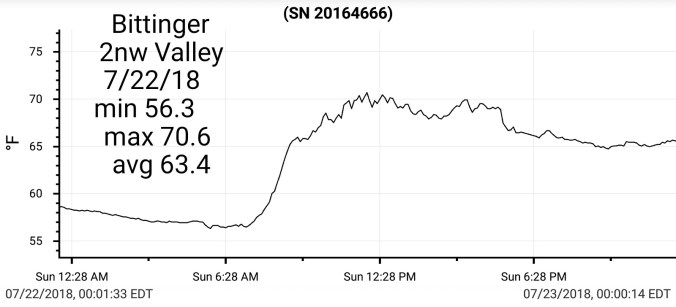
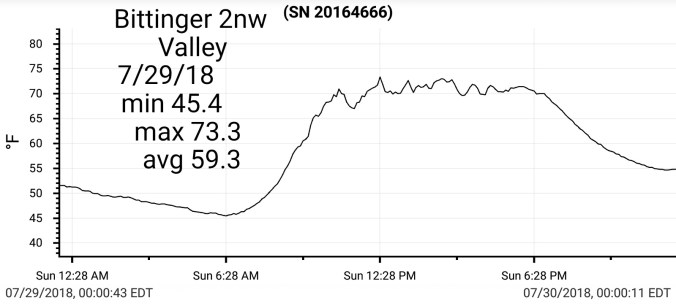
Heavy downpours before dawn in spots then a steadier rain mid morning into the afternoon. Skies broke a little towards evening. Wv high ground ran a rain cooled mid 50s for part of the afternoon.
Temp profile this afternoon
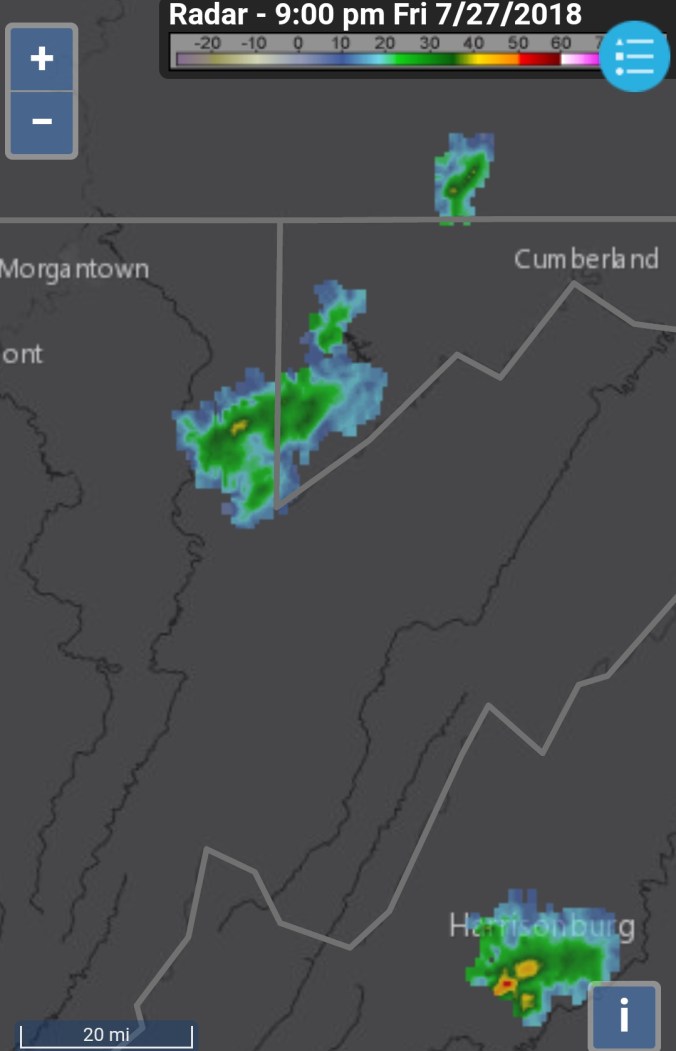
Radar and estimates..picked up .7 today at Bittinger 2nw Valley
Satellite this afternoon
Flow
Surface features and 500mb height anomalies and flow
Mostly clear to start, more cloudiness wv mts vs north, valley fog widespread. The day much like yesterday had building clouds and at times skies were mostly cloudy. A few showers along the Allegheny Front and southern Alleghenies.
Temp profile this afternoon
The Glades under mainly clear skies bottoming out at 38.2°
Radar and radar estimates through 8pm
Satellite this afternoon
Flow
Surface features and 500mb height anomalies and flow
Mix of clouds and sun to start, quickly clouding over. A period in the afternoon with a line of passing light showers. That passed and skies broke….after dusk, a few more brief passing showers pushed through parts of the area(snippet of that below radar estimates)
Temp profile this afternoon
Radar with radar estimated precip
Satellite this afternoon
Flow
Surface features and 500mb height anomalies and flow
18Z 3km Nam
2m Temperatures
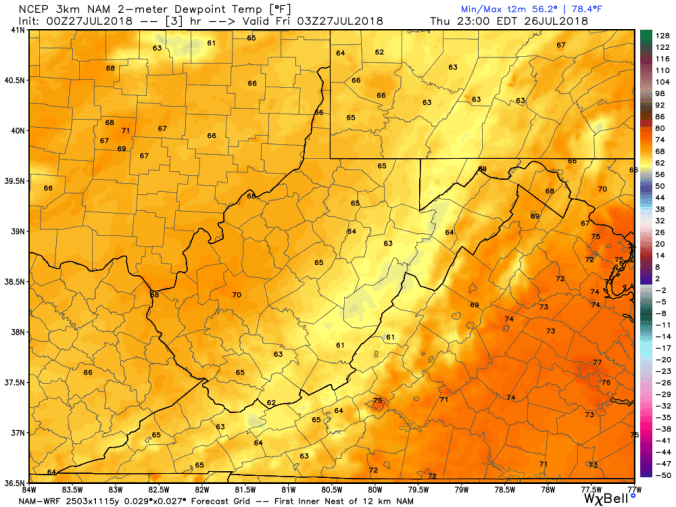
Dew Points
Simulated Radar
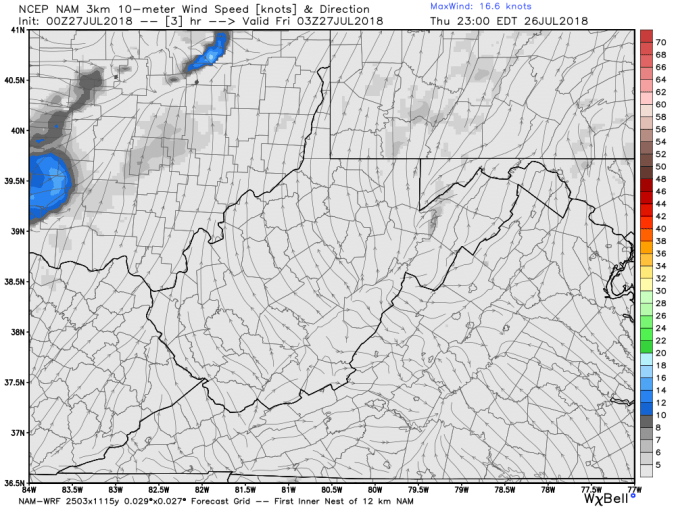
10m Winds
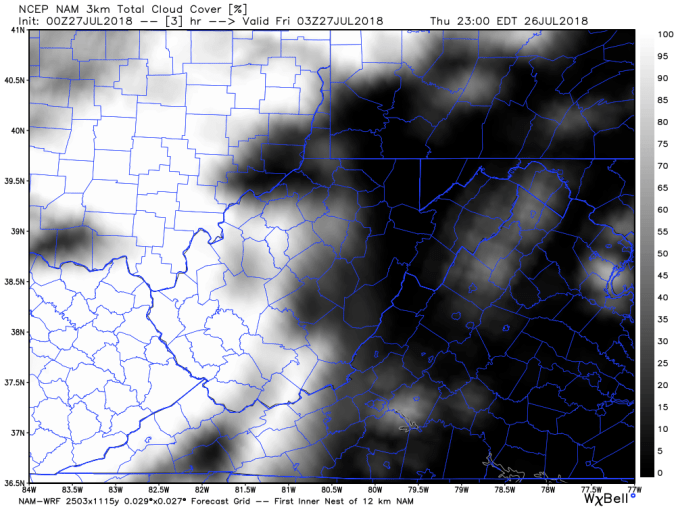
Cloud Cover Percentage
12Z ECMWF
Next week model indicating ridge backing in from the east. This “may” for a time shift the precip shield over the Alleghenies that has overall missed out on appreciable precip over the past 7 days and in some areas, the month.
12Z ECMWF 6 hourly precip
500mb heights and anomalies
2m Temperature anomalies. Likely a setup of cloudy afternoons with some periods of rain holding temps slightly below normal for maxes, and cloud cover, holding temps at or above at night
Dreary looking start, some fog, low clouds and that then burnt off for a mix of clouds and sun of varying amounts from late morning, through evening with the sunny side of things increasing as the day went by.
Temp profile this afternoon
Satellite this afternoon
Radar, mostly last evening in where it did rain, with 24 hour estimates running back to 7pm 7/25
Flow
surface features and 500mb height anomalies
500mb flow
SST(Sea Surface Temperature) anomalies and 7 day change
Off The Models
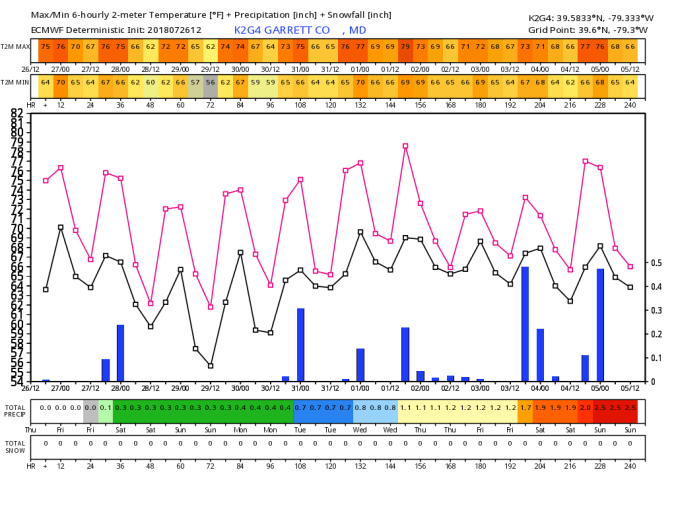
Meteogram off the 12z ECMWF for Garrett County
12Z ECMWF
3 hourly precip
Total Precipitation
18z GFS
6 hourly precipitation
Total Precipitation
18Z 3km Nam
2m Temperatures
2m Dew Points
Simulated Radar
Total Precipitation
10:30pm reality, model comparison
The new 0z 3km Nam run is in. So thats the go to choice. The formula I’v been watching, to get a good feel for what the cold frost pockets can achieve is
1- 10m wind off the 3km Nam calm. In this case, we can check that off. At least for the valley spots. While 3km is high res, its still not tight enough to pinpoint details, but gives great hints.
2- Cloud cover, are we seeing clear skies. The 3km nam does very well at this. In this case, checked this off.
3- 2m Dewpoints. Pretty big component. Again, 3km nam is detailed, but not tight enough for minute details. The observations and comparisons has led to the conclusion on many many occasions, that, with a dry air mass incoming, or in place, calm winds, clear skies, subtract 4-8° from the 3km nam modeled dewpoint and that is generally where the 2m temp comes in at in the cold pockets. Placement of the modeled 2m Dewpoints is not important. If conditions above(1&2) check off the list. Ex. If the models lowest dewpoint is in Elkins at 45 and Canaan reads 55 on the model, Canaans frost pocket actual dewpoint, air temp, if conditions(calm, clear)of 1 and 2 are equal to Elkins, (on the model) reality should run 38-42° 2m air temp. In the case below off tonights 0z 3km nam, 56.2° dewpoint is the min at the example time. All in all for this example, lowest dewpoints are in the ballpark area of the conversation, despite it doesn’t have to be.
4- While in cases of east flows, CAD events, even daytime maxes with a breeze I love the 3km nam, (best there is bar none, beats HRRR easily) it is not good at hitting cold pockets. Again, not in tight enough for small details even at 3km, but I would think as in the current case, and many other times observed, it should do better. With 0 wind, 56° dewpoint, clear skies, why is it not modeling pockets of cooler temps? 3km should be enough to do that. This aspect of the model is one of its problems on 2m temps. Its not always great at convective storms and will falsely on the model cool locations that do not occur. That’s another downfall. It is though great for frontal timing however. Currently, thumbs down for tonights example on temps. Way to warm.
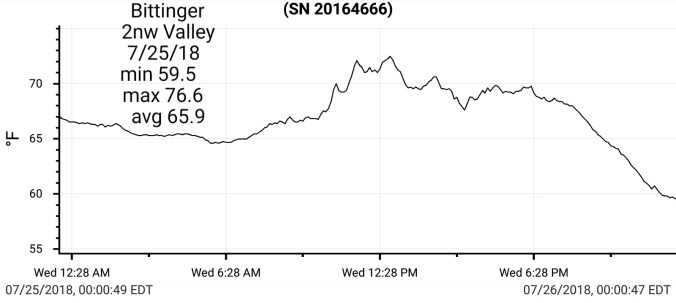
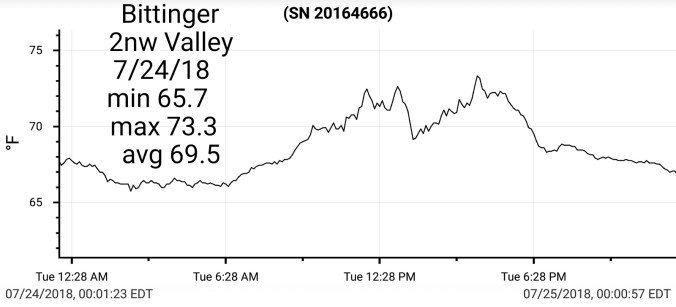
Reality views. While the valley frost pocket has no anemometer, its evident conditions are calm, while at 4000′ a 10mph exist. The model, looks decent. At 4000 its 63°, not bad on the model, 51° in the colder valley area, no clue on the model, except using the 1,2,3 formula from observations of the model to reality.
Reality at a little past 10:30pm
(To note, Hrrr last night showed clear skies through daybreak, 3km nam showed increasing cloud cover and temps creeping up, 3km Nam did well.)
Cloudy, foggy, showers today, very late peaks of sun in spots…..once again, the rain free zone thats been mainly dry all week, recieved very little today. Again a cloudy, breezy night holding temps up.
Temp profile this afternoon
Radar with estimates…picked up .2 today at Bittinger 2nw Valley. Most all week
Satellite
Flow
500mb flow
Night Owl(poor quality)
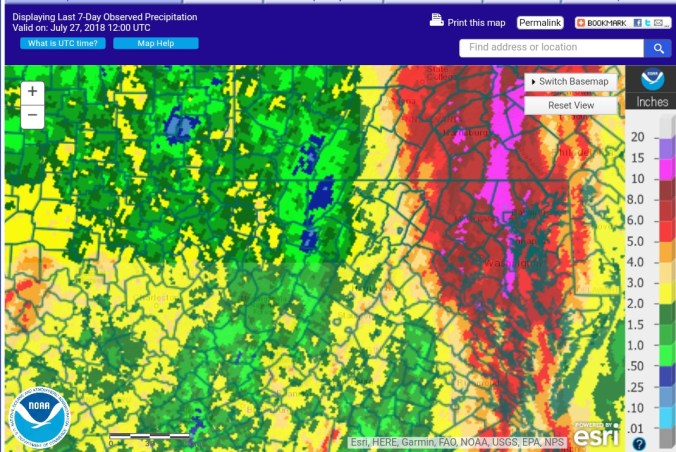
Precip past several days. This is listed as 7 day totals, but most of this since Saturday…Models from Sunday, models really from last week were VERY poor in the Alleghenies. Rainfall never materialized as it did east and west. Last weekend it looked like the mts would miss out. By all available data, it looked for certain appreciable rain amounts of 1-3″ would occur Tue-Thur. It did not occur. Below in pic one is observed, then pic 2 and 3 were model putouts at 12z in the 22nd
Cloudy, high ground fog at times, again the eastern ridges in that more than the central to western Alleghenies. Breezy all night, into the day and that once again held overnight lows up. Minimal swings between mins and maxes in a pattern like this. Scattered showers but once again on repeat, the most rain has stayed east..
Temp profile this afternoon
Radar & 24hr radar estimates through 7pm
Satellite this morning and afternoon
Flow
Surface features and 500mb height anomalies and flow
Overcast, fog on the eastern ridges. Some scattered light showers. Main rain again east. Flooding well east. Late day skies broke a little. SE flow continues. Winds held up overnight into the a.m preventing much of a temp dropoff last night.
Temp profile this afternoon
Radar with estimates and the before mentioned flooding. Pic from Hershey park Pa
Satellite this afternoon
Flow
Surface features and 500mb height anomalies
500mb flow
Fog rollling back across eastern ridges from Roaring plains on north, as North Fork cam remained fog free at 8:50pm…..GCC windchart illustrating the SE winds today.
Mostly sunny start for the first hour of the day., pockets of valley fog…clouds quickly building. Overcast, dimmed sun, southeast breeze with a few isolated pockets of showers, some fog building on the eastern Alleghenies in the mid to late afternoon
Temp profile this afternoon
Radar with 24 hour precip estimates
Satellite this afternoon
Flow
Surface features and 500mb height anomalies
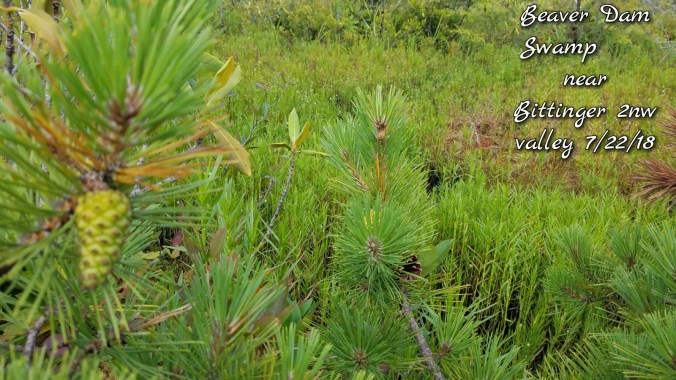
Pics today…some of those early changing leaves, mainly due to stress in area they are located.
Glade Run at Bittinger 2nw Valley water temp 58.5, tributary at swamp on the mountain at 61.5 after traversing through open sunny conditions.
Pic by Bryan Lemasters at Dolly Sods this morning
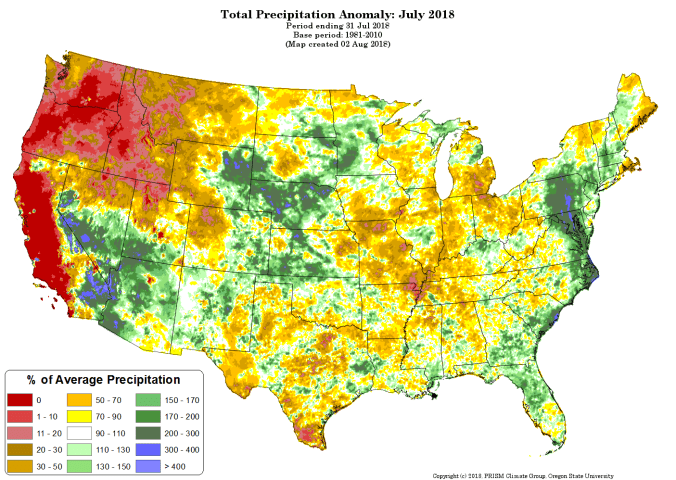
Rainfall on the month in the area of the videos, pics above has been below normal, as some nearby areas have been above. The isolated nature of the heavy rains last weekend contributing to that.. The haves and have nots. Heavy rain this weekend passing east.
July to date
Upcoming this week off the 12z ECMWF and 12z GFS. Brunt of which looks to be Tuesday into Wednesday.


 Radar and radar estimates through 8pm
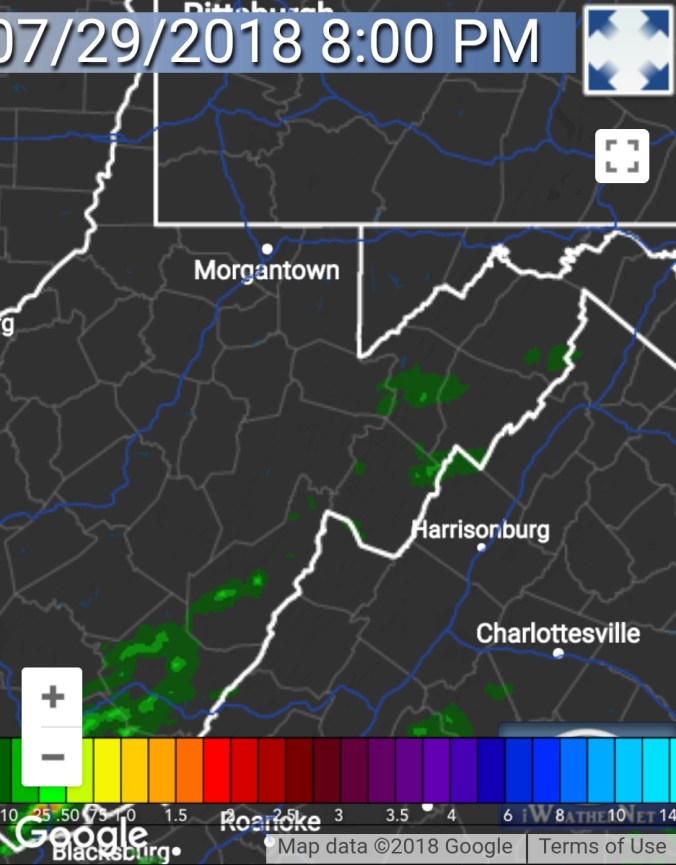


 Rainfall occured with the few remaining showers last night after dusk, including that here for the 24 hour estimated total.
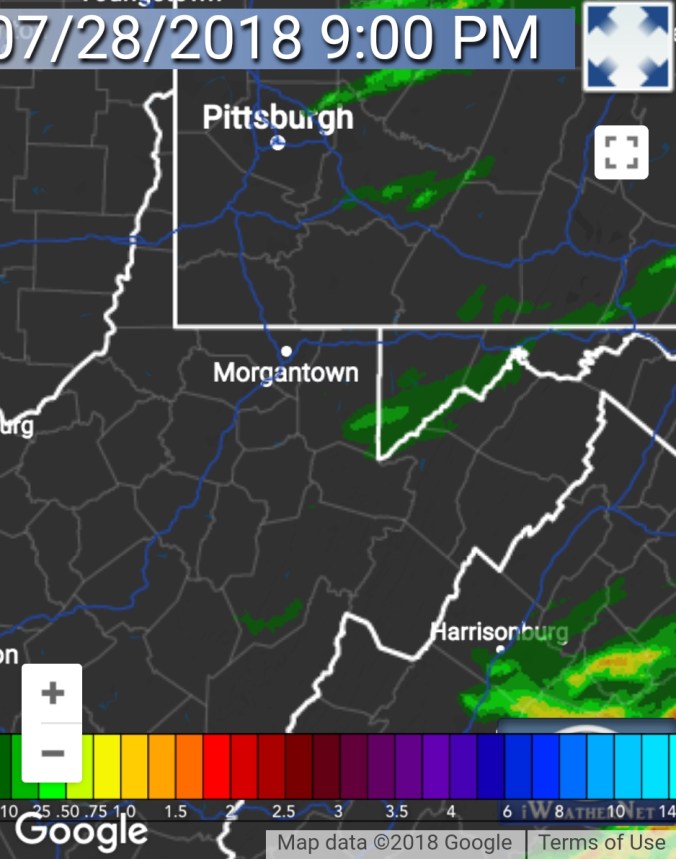


 Radar with radar estimated precip
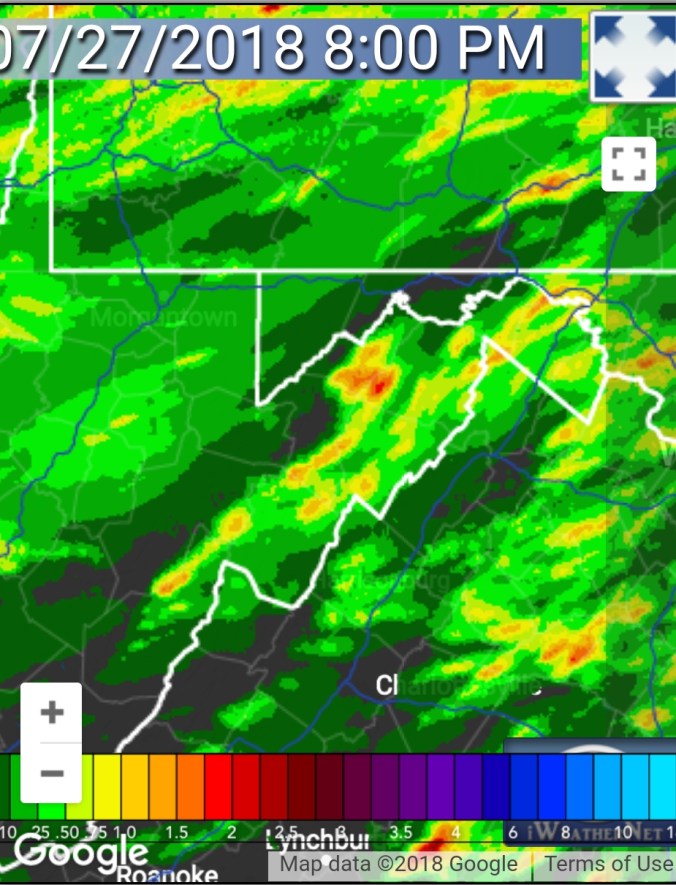
 Satellite this afternoon