Aug 13. min. max. avg
Bitt 2nw valley 54.6 68.4 61.5
Garrett College 56.7 70.7 63.7
Can-Heights 51.6 70.4 61.0
CRN-Canaan 53.7 71.5 62.6
Cabin Mt 52.0 68.7 60.3
Cabin Mt north 54.1 70.0 62.0
Spruce Knob 50.5 68.5 59.5
Snowshoe 53.8 67.5 60.7
Can-Valley Floor 46.8 73.4 60.1
7Springs 56.8 69.2 63.0
Cloudy start, turning rainy in the morning with heavy rain at times in northern areas, that began to dissipate and shift to other areas in the afternoon and evening
Temp profile this afternoon(Bittinger 2nw Valley, early afternoon temp with rain was 59, a sunny break occured and the brief max of 68 occured) 


Radar with estimates.(9pm-9pm) Picked up .87 at Bittinger 2nw Valley

2 day totals, Bittinger 2nw Valley 1.27, USGS(pictured) Grantsville 2″, USGS Davis (pictured) .2, Cabin Mt at Bald Knob .8, Spruce Knob .58


Satellite this afternoon
Flow
Surface features and 500mb height anomalies and flow


What the hail!
Pics by Rosanna Springston along Highland Scenic Highway in Pocahontas County today. Most pics are from this afternoon at 2pm. 2 are from 7:30am-8am. By looking back over radar data, best that can be told (radar also view by the Charleston office in agreement) that the cell that dropped the hail occured between 8-9pm last night (8/12/18) What is most impressive is, 16-18 hours later the amount of hail that was still laying around. Temps 50s,60s, high humidity, warm ground.


Radar at the time the hail event is believed(pretty certain) to have occured. 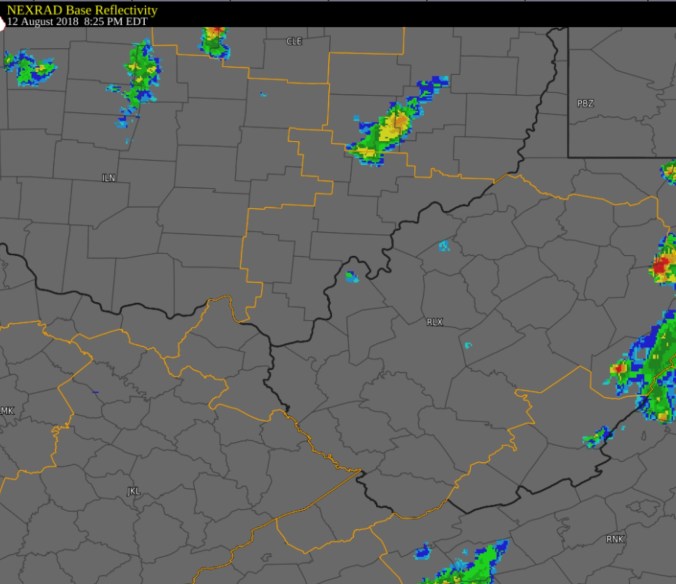
And again today some areas experienced hail. This pics sent from Grantsville Md to a social media weather page


SPC again not including the area in the hail threat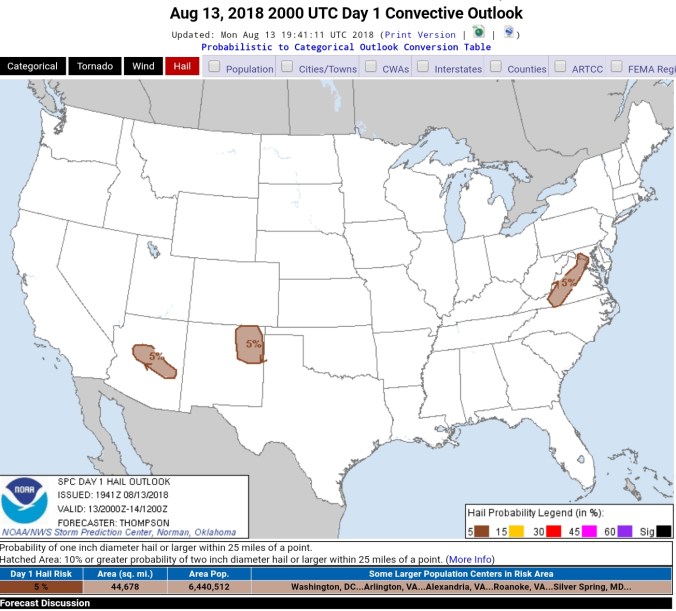
Given the low freezing level of 12-13k feet, with the relatively cold upper level low in August, surprised no threat zone back here. Precip heights looked to be 25-30k feet. Surface temps fell mid 50s with the rain, I would venture a guess, a guess only that these hail areas went into the upper 40s when these cells passed by. One area I have no report from is Aurora in Preston County that looked like it should have produced hail as well today. The 3km nam, while hail is not a parameter of the model, it showed a remarkable temp drop with cells, to me indicating hail, as well as a brief dewpoint drop. (Refer to yesterdays post of the model) 
18z 3km Nam
2m Temperatures
Simulated Radar
2m Dew Points
12z ECMWF meteogram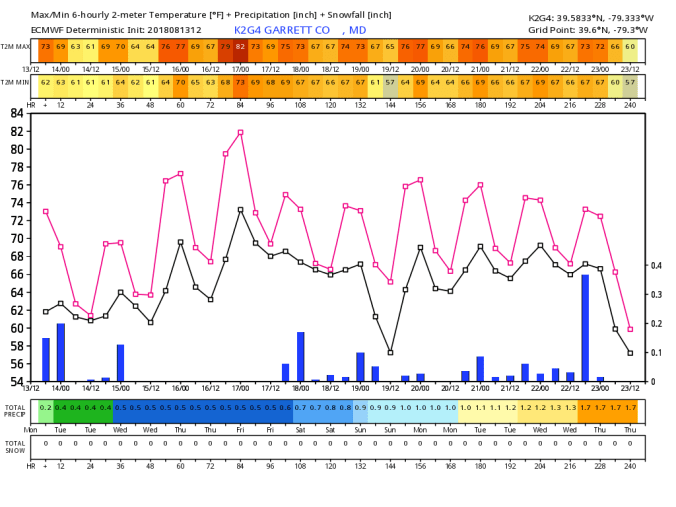
18z GFS meteogram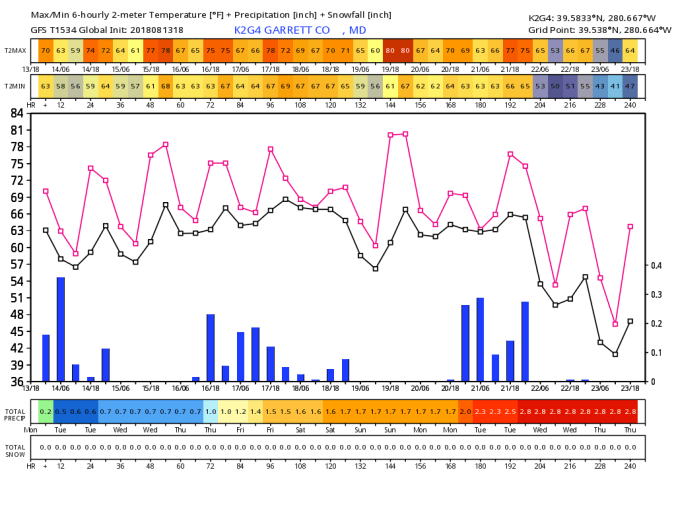
day 9, cool shot? 12z looked nothing like this. However 12z ECMWF 500mb pattern sticks a decent trough east. The surface features, the GFS will pick up on min temp potentials for valleys while ECMWF tends to model high ground. Each model has had the bias for years, the GFS has been modified though and does not pick out mins like it used to. Now I use a formula from the 3km nam for valley mins that has worked well. At any rate, 9 days is a long ways out….many changes will occur.
