Northern Garrett cam still down, once again using the Rt 40 Elementary cam
Aug 15. min. max. avg
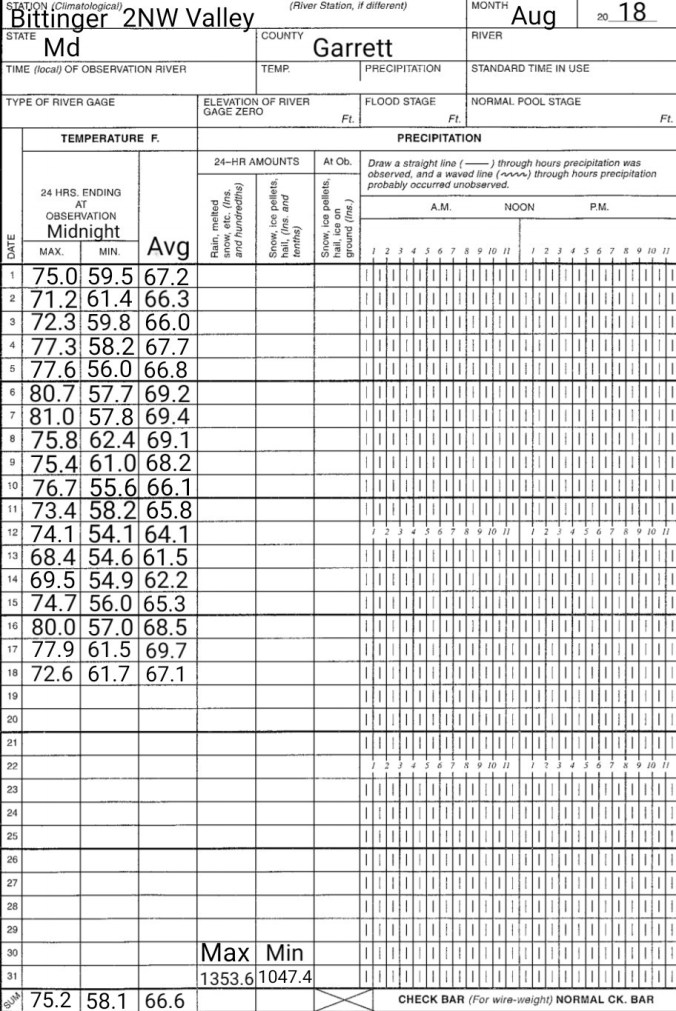
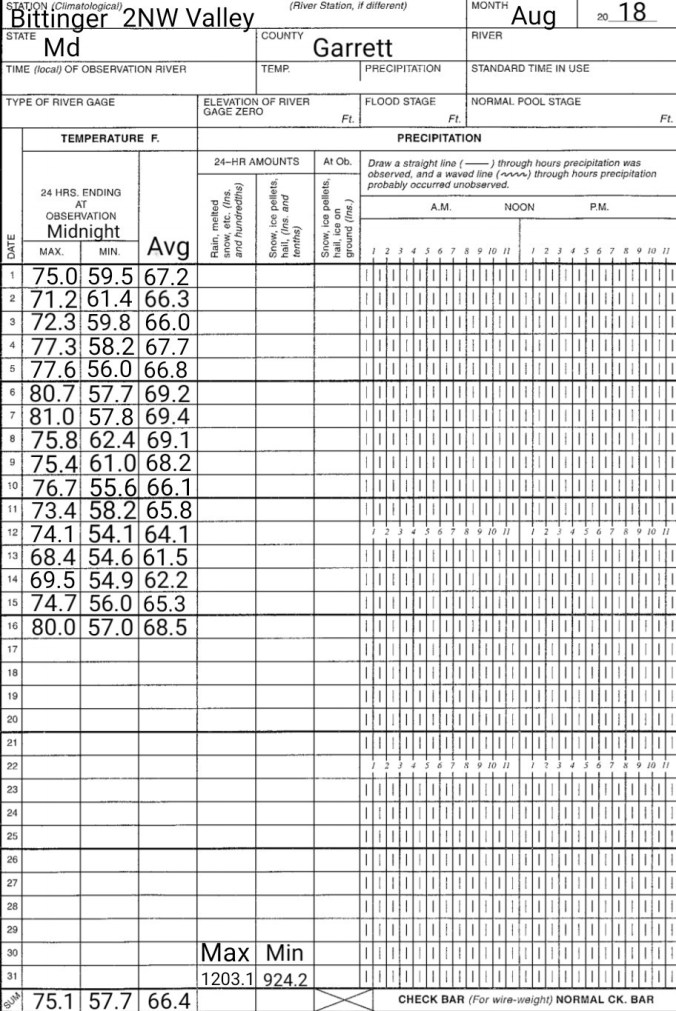
Bitt 2nw valley 56.0 74.7 65.3
Garrett College 62.3 77.2 69.7
Can-Heights 58.5 73.5 66.0
CRN-Canaan 58.6 73.8 66.2
Cabin Mt 57.2 71.8 64.5
Cabin Mt north 57.9 74.5 66.2
Spruce Knob 56.3 71.2 63.7
Snowshoe 57.9 70.0 63.9
Can-Valley Floor 49.3 75.7 62.5
7Springs 61.9 73.8 67.9
More clouds than sun to start, then a mix of clouds and sun throughout the day
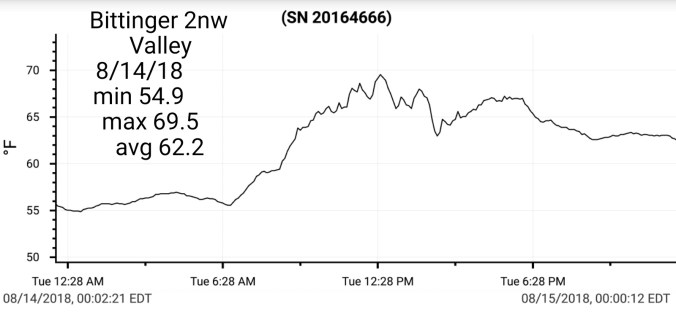
Temp profile this afternoon
24 hour precip (9pm-9pm) this was the remaining showers last night as the rain ended shortly after dark in these areas. Not going to include radar loop since today was void of precip.
Satellite this afternoon
Flow
Surface features and 500mb height anomalies and flow
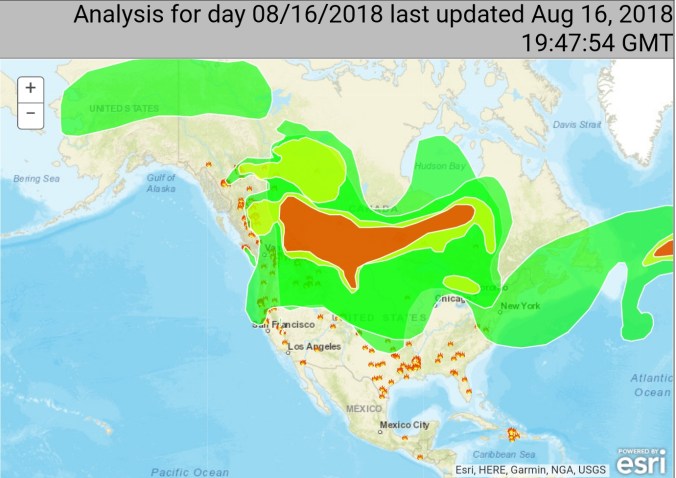
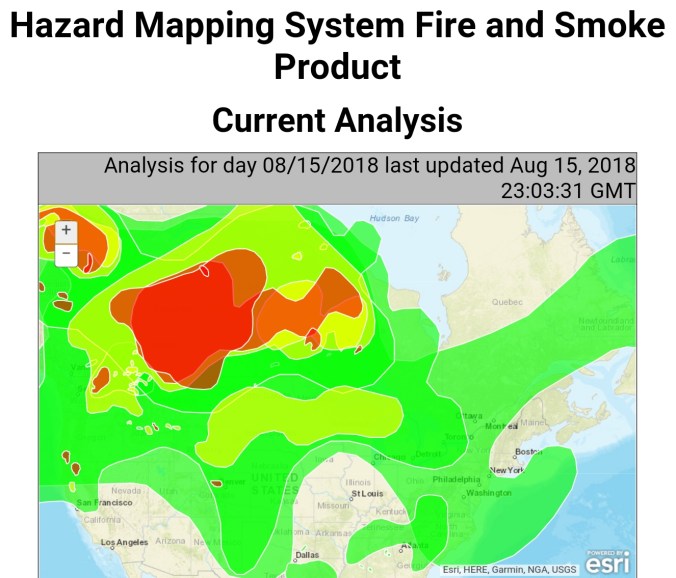
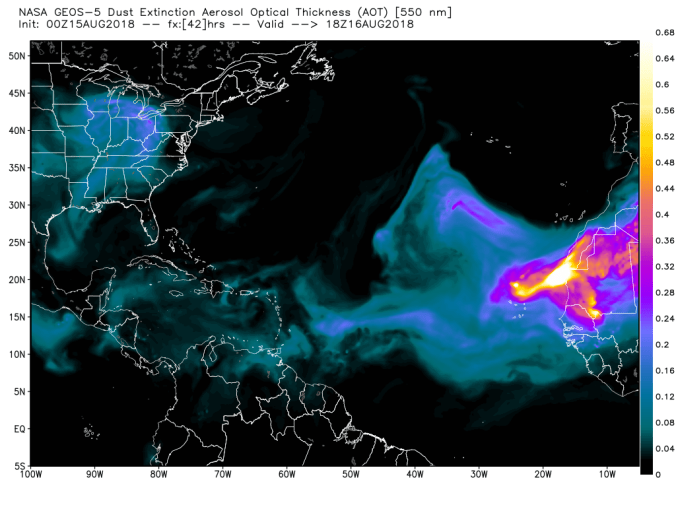
Western Smoke and African Dust
If you view the Goes-16 Satellite Loop above the smoke/haze look in the cloud free areas is visible, below shows those areas…
African Dust making the long loop
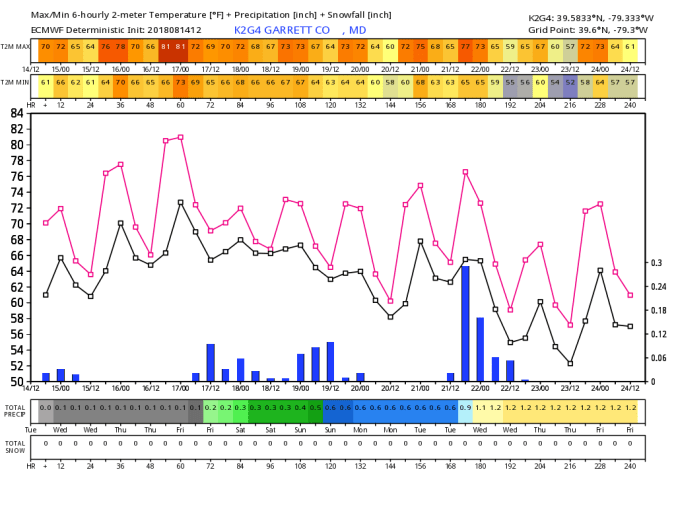
18z 3km Nam
2m Temperatures
2m Dew Points
10m Winds
Cloud Cover Percentage
Simulated Radar
Based off the formula for this model. If conditions are clear, calm, minimal clouds, subtract 4-8° off modeled dewpoint for mins in the coldest valleys. Which potentially would put out temps 40-45(monitor Canaan Valley Frost Pocket, no sensor on The Glades presently)
Further out, strong hints of a 3-4 day fall-like stretch late next week/weekend. If that materializes, it should be a good time to monitor those frost pocket sites for 30s. Will not be surprised to see model mins trend cooler. Again, frost pockets will not show up on the main model grid.
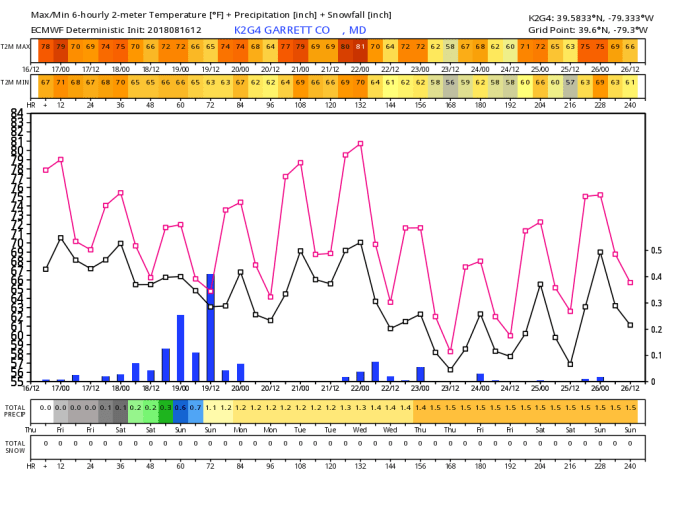
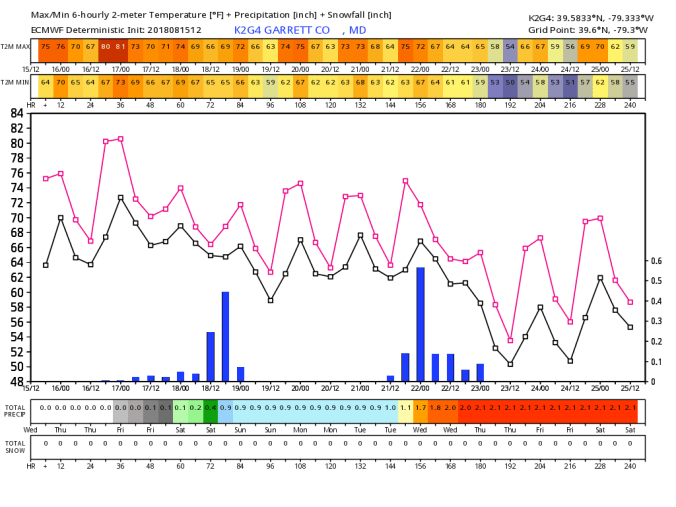
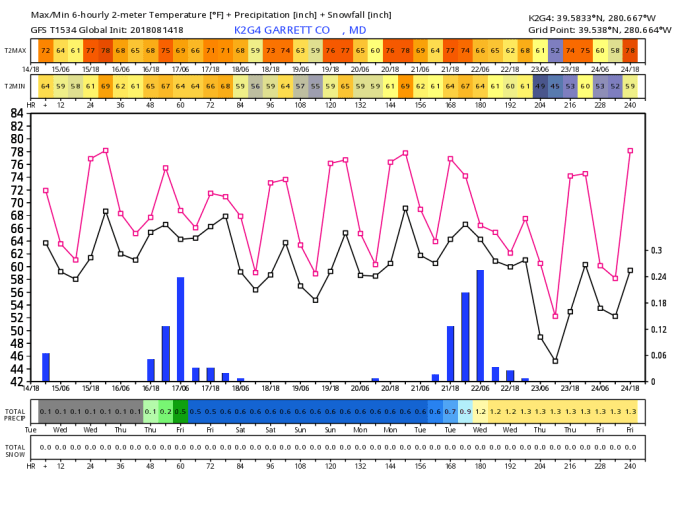
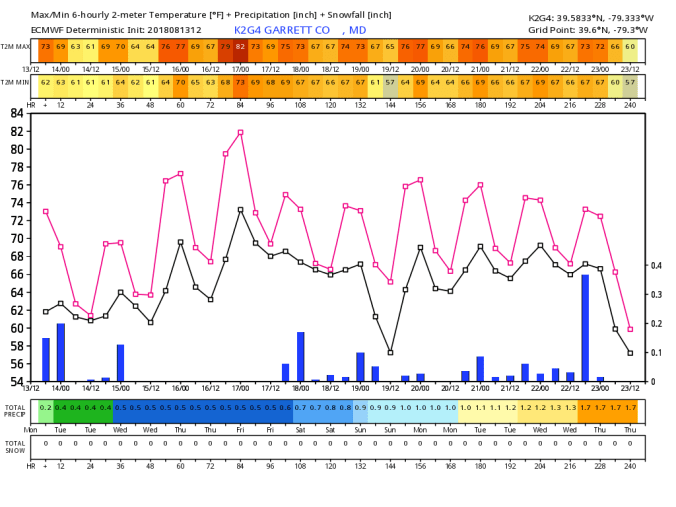
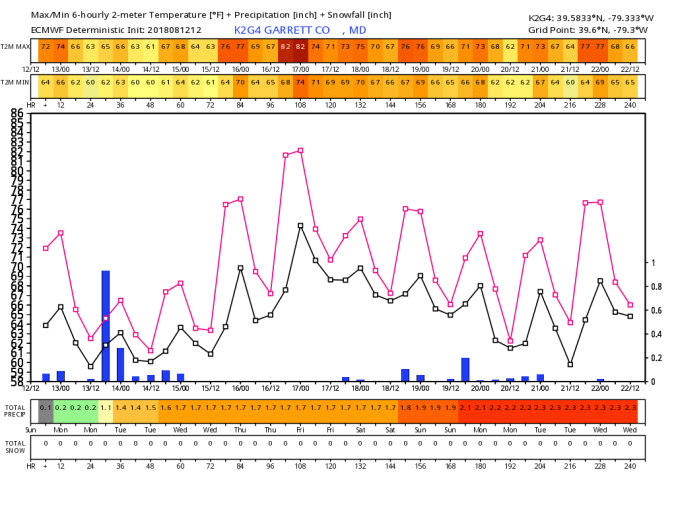
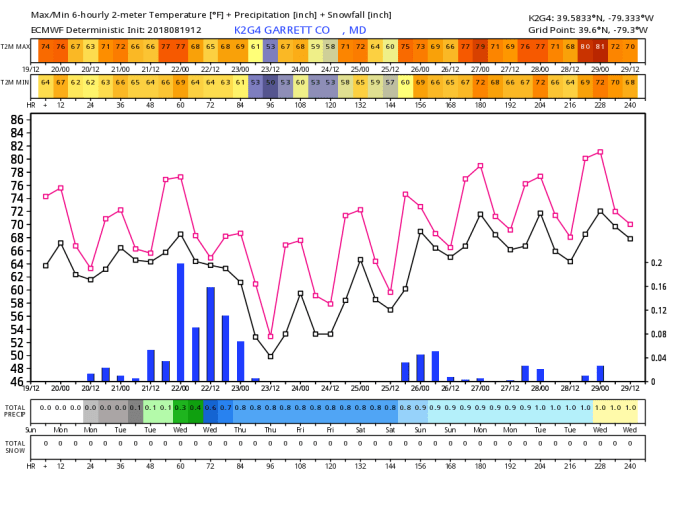
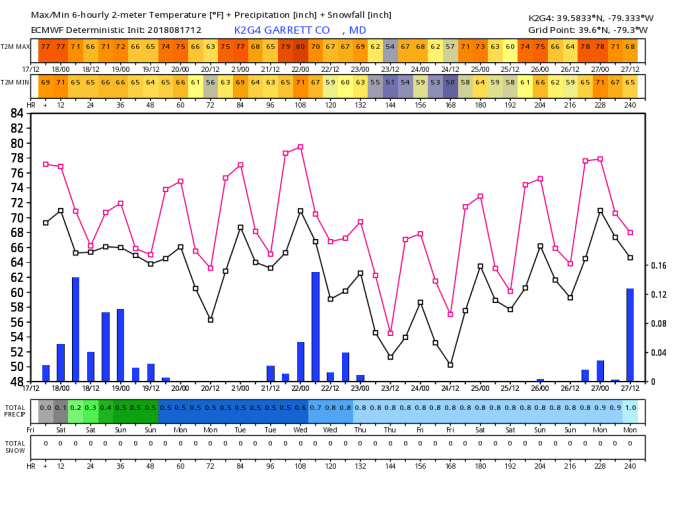
12z ECMWF meteogram
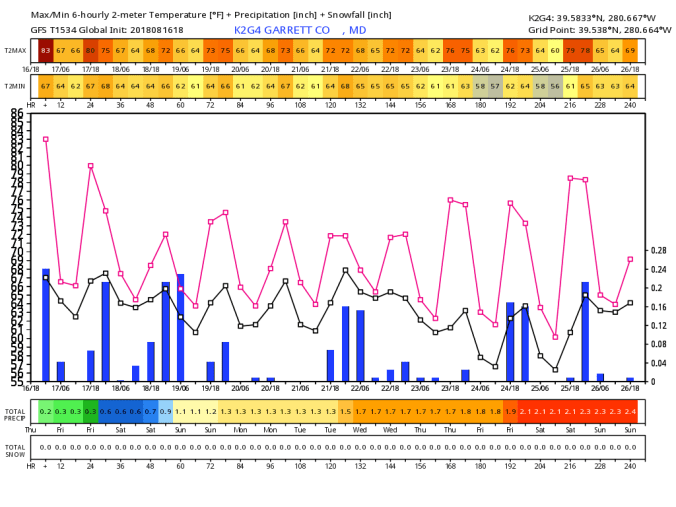
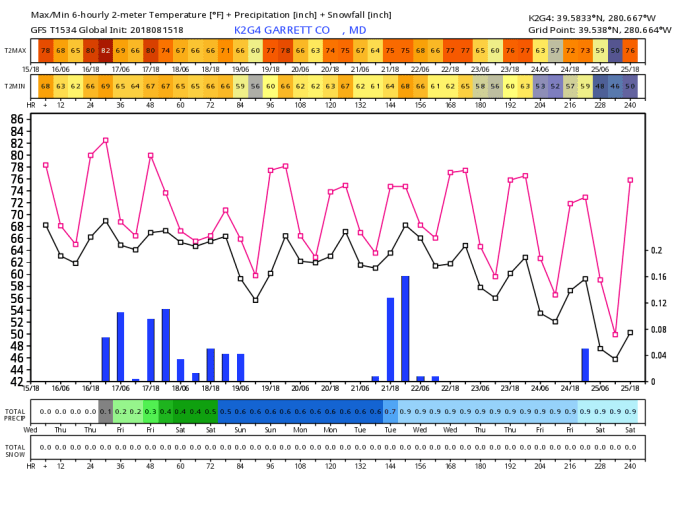
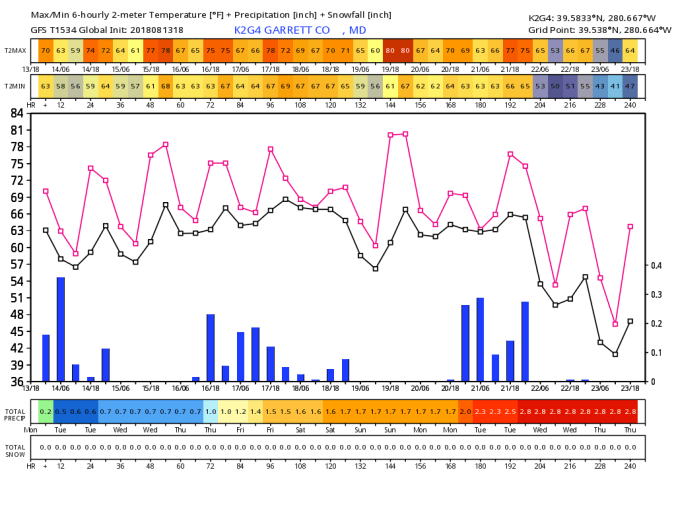
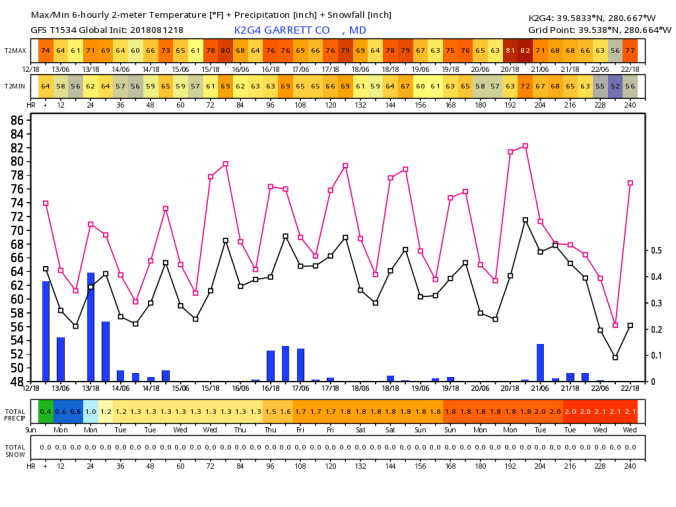
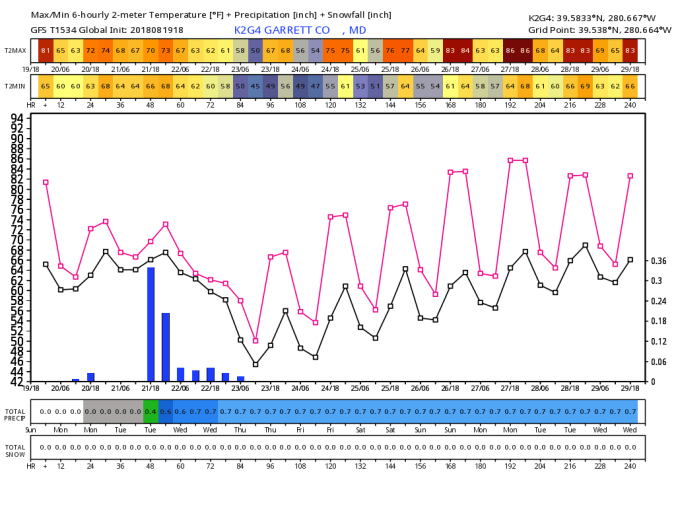
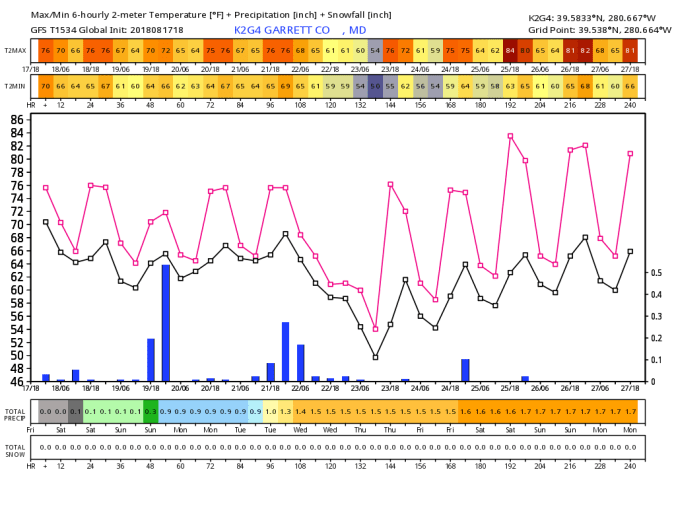
18z GFS meteogram
Month to date
Temps, no surprise. A wet month. Typically plenty of cloud cover. Holds max temps down, holds mins up with the blanket of clouds and moist air.
Precip Observed and departure from the average.
Year to date
Temps, running very close to the averages overall. Max temps under, mins up and coincides nicely with a wet year to date, with those graphics a short scroll down.
Precip, yearly obs from Jan 1, with departures from average.
Sea Surface Temperature drop, Sea Surface Temperature anomalies and potential winter implications.
Pictured above- SST(Sea Surface Temperature) anomalies last year vs this year. Last year on the left, this year on the right. The amount of cooling in the oceans has been fairly significant.
One interesting aspect, Joe Bastardi at weatherbell brought this up and I highly recommend checking that out. That aspect is the cooling in the Indian Ocean, the warmth developing in the tropical Pacific around 120W and forecast to build in to what could be a weak to moderate modoki Nino.
The significance in this, would be the effect on the MJO(Madden Julian Oscillation) during the winter months. The warmth in the tropical Pacific would tend to favor best areas of convection in the favorable phases (8,1,2,3) varies month to month, for eastern U.S cold. That’s one reason why Modiki Ninos can have an effect. Its not the sole reason, it depends on what is going on around it as well. Say the Indian Ocean was very warm, it can hamper that effect for us winter lovers.
Another key, I’v pointed out before. East of the Dateline at 30 N. Those waters cooler vs normal and the Northeast Pacific warmer than normal enhances the pumping of the western ridge, eastern trough. 2 favorable outlooks at the early stages.
A cooler vs normal Gulf of Mexico. A much colder look to the Atlantic overall, with warmth from mid Atlantic to Northeast. That may enhance Nor’Easter type storms with coastal rains, inland snows. The cooling of the North Atlantic looks ideal to set up some blocking highs with a -NAO. Again, far off, and how these features adjust will be key. The significant cooling of the oceans over the past year, and locations of warmth vs cool will be key. Stay tuned as these aspects, plus others will be fun to watch going into fall.
Wildfire Info Links
If interested in statistics, facts on wildfire data, satellite info, smoke views, drought vs wet areas, highly recommend these few links. Helps decipher media hype vs reality
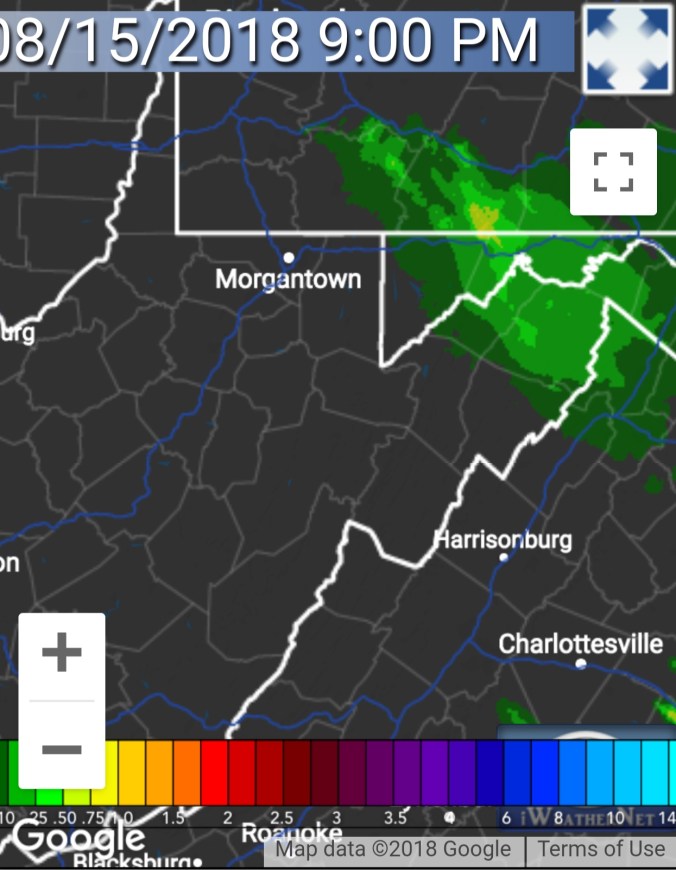
Cloudy start, turning rainy in the morning with heavy rain at times in northern areas, that began to dissipate and shift to other areas in the afternoon and evening
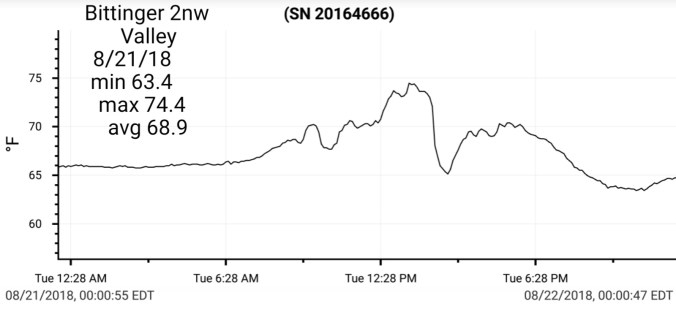
Temp profile this afternoon(Bittinger 2nw Valley, early afternoon temp with rain was 59, a sunny break occured and the brief max of 68 occured)
Radar with estimates.(9pm-9pm) Picked up .87 at Bittinger 2nw Valley
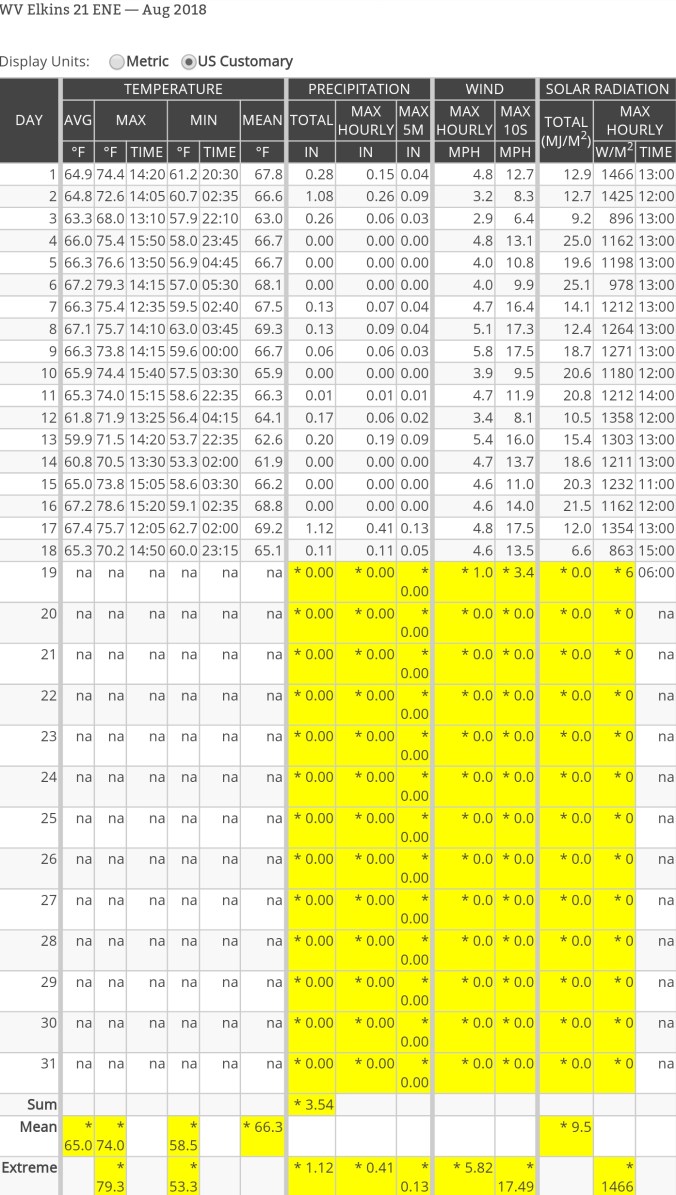
2 day totals, Bittinger 2nw Valley 1.27, USGS(pictured) Grantsville 2″, USGS Davis (pictured) .2, Cabin Mt at Bald Knob .8, Spruce Knob .58
Satellite this afternoon
Flow
Surface features and 500mb height anomalies and flow
What the hail!
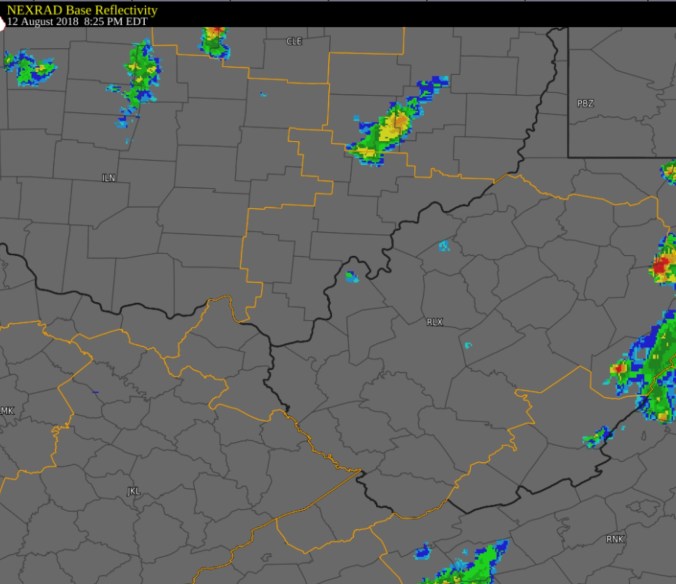
Pics by Rosanna Springston along Highland Scenic Highway in Pocahontas County today. Most pics are from this afternoon at 2pm. 2 are from 7:30am-8am. By looking back over radar data, best that can be told (radar also view by the Charleston office in agreement) that the cell that dropped the hail occured between 8-9pm last night (8/12/18) What is most impressive is, 16-18 hours later the amount of hail that was still laying around. Temps 50s,60s, high humidity, warm ground.
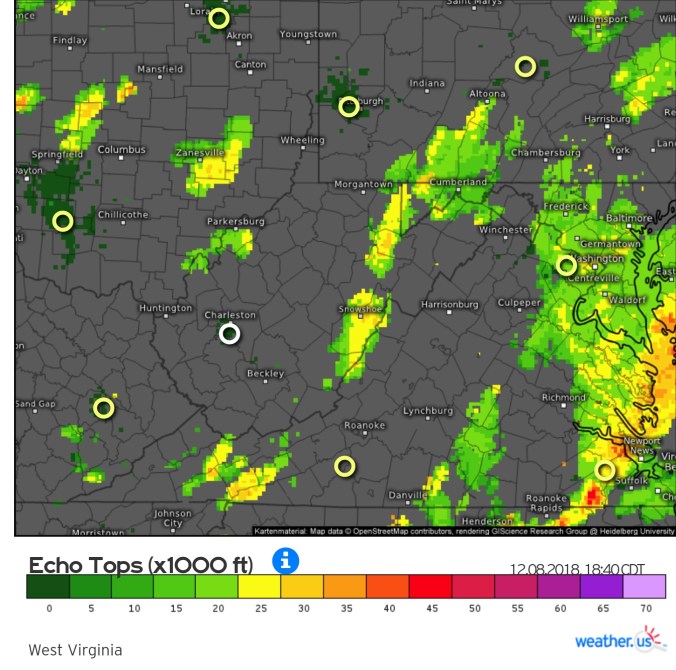
Radar at the time the hail event is believed(pretty certain) to have occured.
And again today some areas experienced hail. This pics sent from Grantsville Md to a social media weather page
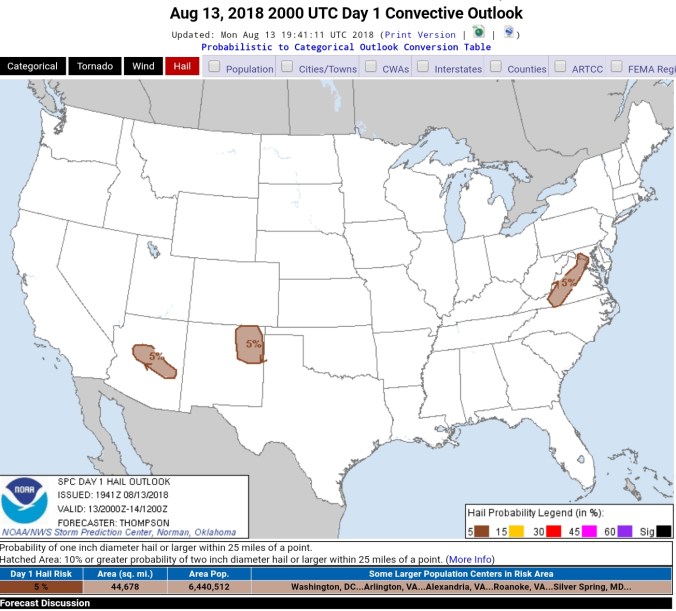
SPC again not including the area in the hail threat
Given the low freezing level of 12-13k feet, with the relatively cold upper level low in August, surprised no threat zone back here. Precip heights looked to be 25-30k feet. Surface temps fell mid 50s with the rain, I would venture a guess, a guess only that these hail areas went into the upper 40s when these cells passed by. One area I have no report from is Aurora in Preston County that looked like it should have produced hail as well today. The 3km nam, while hail is not a parameter of the model, it showed a remarkable temp drop with cells, to me indicating hail, as well as a brief dewpoint drop. (Refer to yesterdays post of the model)
18z 3km Nam
2m Temperatures
Simulated Radar
2m Dew Points
12z ECMWF meteogram
18z GFS meteogram
day 9, cool shot? 12z looked nothing like this. However 12z ECMWF 500mb pattern sticks a decent trough east. The surface features, the GFS will pick up on min temp potentials for valleys while ECMWF tends to model high ground. Each model has had the bias for years, the GFS has been modified though and does not pick out mins like it used to. Now I use a formula from the 3km nam for valley mins that has worked well. At any rate, 9 days is a long ways out….many changes will occur.
Valley fog, some areas of clear skies, some areas with clouds to start the day. Cloudiness more so in the Wv mts. Building clouds today, some periods of sunny breaks, showers in the Wv mts morning, with more widespread showers including northern areas later in the day with thunder.
Temp profile this afternoon
Radar with estimates(24 hours 9pm – 9pm) Picked up .4 at Bittinger 2nw Valley
Satellite
Flow
Surface features and 500mb height anomalies and flow
Henry Oester near Keysers Ridge had hail with the evening storm.
The runs of the 3km Nam kept showing a large 2m temp drop with some of the individual cells. Casual glance not digging to deep into it, I thought it may been modeling some hail. (not a parameter of the model) The SPC had no hail threat near.
Freezing levels looked to run 12-13k feet. Precip tops 25-30k feet with some of the storms. It appears tomorrow should run this isolated risk as well. 500mb “cool” pool overhead with upper level low.


 Radar with estimates 9pm-9pm, .7 at Bittinger 2nw Valley
 Satellite this afternoon


 Radar with estimates(9pm-9pm)
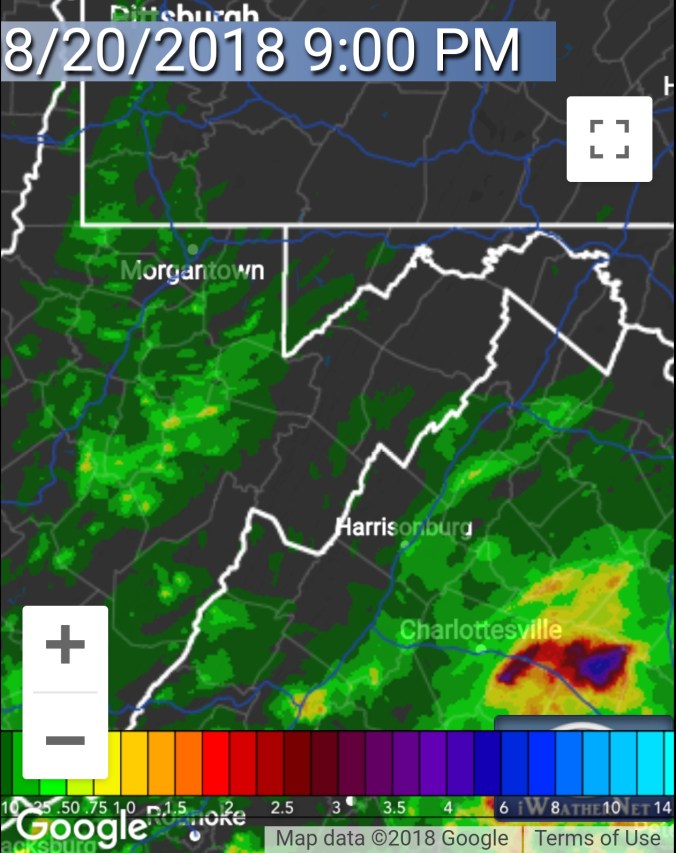 Satellite this afternoon


 Radar with estimates(9pm-9pm)


 Radar plus estimates , 1.0″ at 6pm new rainfall at Bittinger 2nw Valley


 Radar plus estimates, .2 Bittinger 2nw Valley, more after 6pm.
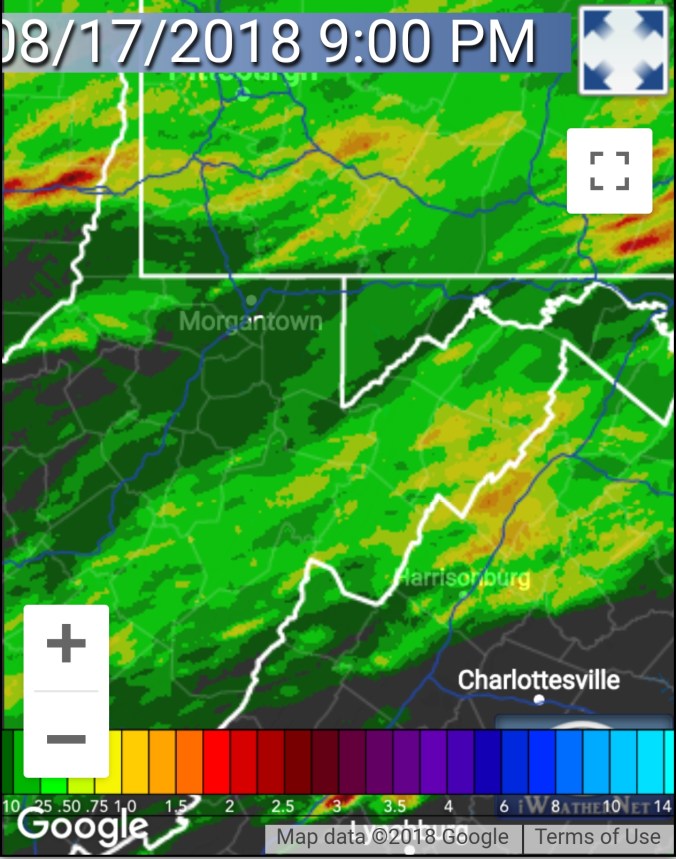


 Radar plus estimates