Oct 5. min. max. avg
Bitt 2nw valley 56.2 68.4 62.8
Garrett College 58.7 69.9 64.3
Can-Heights 59.2 69.9 64.6
CRN-Canaan 60.6 72.0 66.3
Cabin Mt 58.3 69.6 63.9
Cabin Mt north 59.2 69.6 64.4
Spruce Knob x
Snowshoe 58.8 68.4 63.6
Can-Valley Floor 51.3 73.2 62.2
7Springs 55.0 65.6 60.3
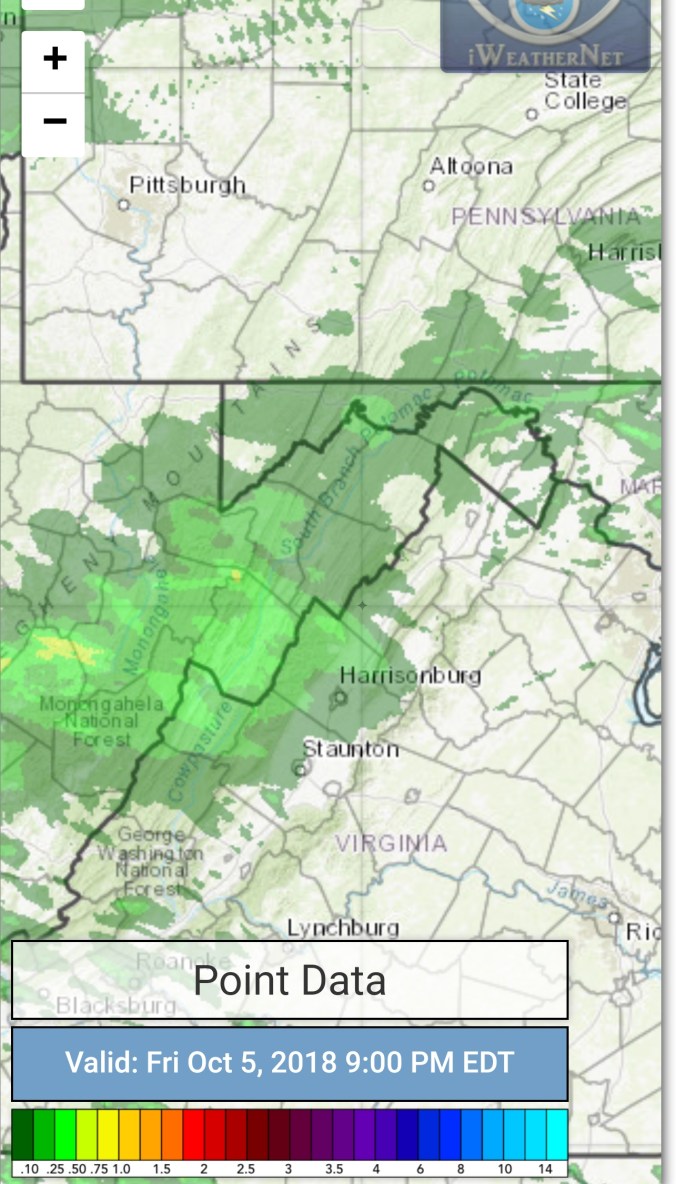
Cloudy, some fog in the morning. Then mainly cloudy afternoon. Some areas saw more breaks of sun than others. Limited at Bittinger 2nw area…
Temp profile this afternoon


Radar with estimates 9pm-9pm.. Picked up .7 at Bittinger 2nw Valley with the rain last evening after
Satellite
Flow
Surface features and 500mb height anomalies and flow


I made a Facebook post this morning about the MJO driving the pattern. The phase 8 and 1 correlations are as strong as it gets. We’ve been in a fairly high amplitude phase 8, a phase 8 for late Sept into early Oct should look like this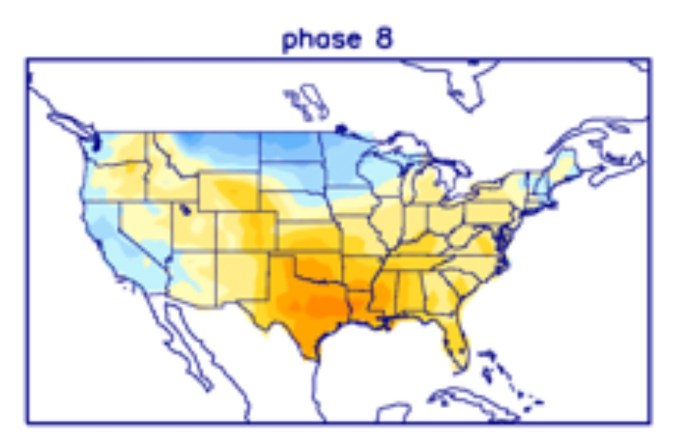
Our past 10 days looks like this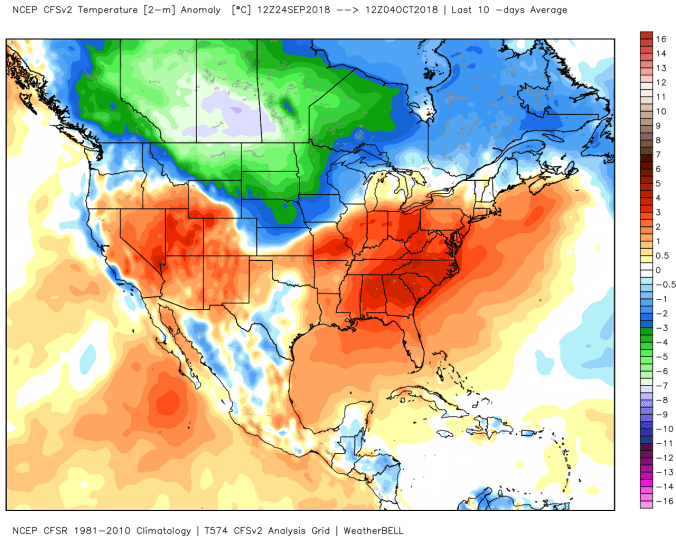
I don’t know about you, but that looks to me about as close as it gets. We are now into phase 1. A phase 1 looks like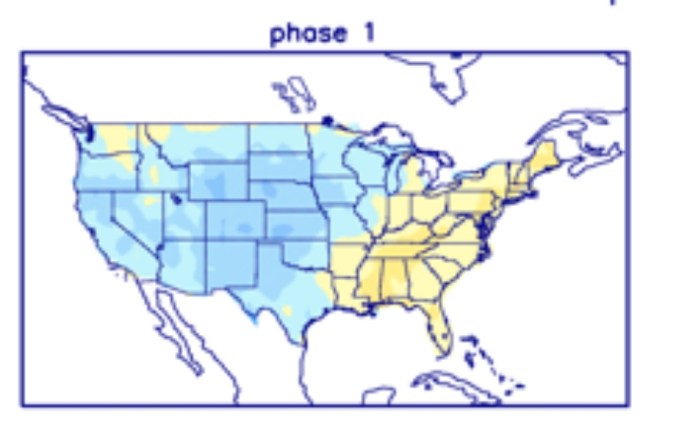
Gfs next week looks like this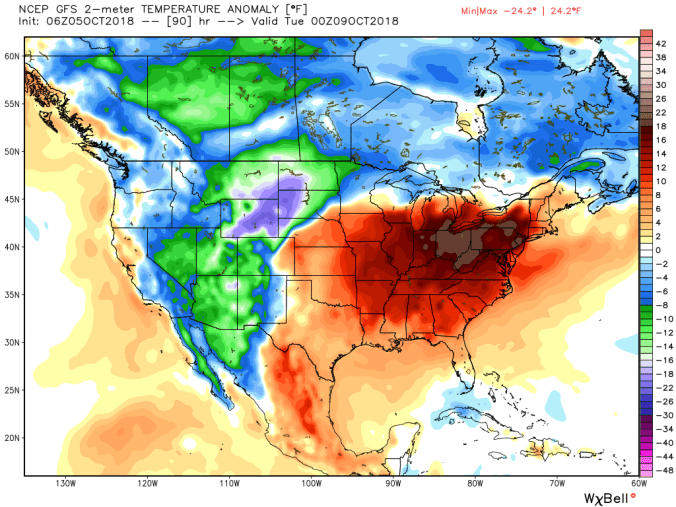
MJO is a main driver of the current pattern. Where do we go from here? Some modeling advances the MJO into phase 2. That would allow the eastern U.S to turn cold. Some have it going into the null phase, less impactful and that would allow some cold air to sweep east in 7-10 days. A few hold phase 1. This would hold the current pattern longer into the month. This is a big factor of what occurs as we go into mid month.


