Dec 31(Mon) min max avg
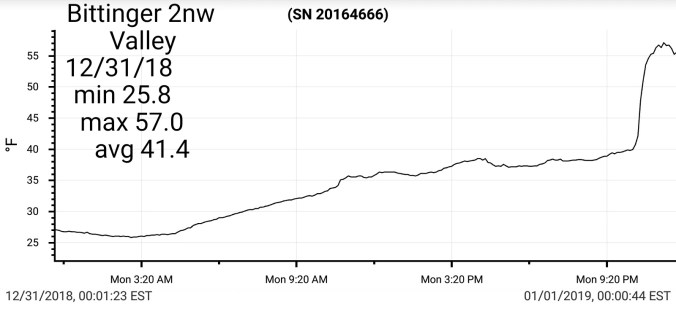
Bitt 2nw valley 25.8 57.0 41.4
Garrett College 27.6 59.5* 43.5
Can-Heights 33.9 55.1 44.5
CRN-Canaan
Cabin Mt
Cabin Mt north
Spruce Knob 34.1 49.2 41.6
Snowshoe 38.7 50.0 44.2
Can-Valley Floor 23.2 54.1 38.6
7Springs. 34.3 57.4 45.8
Cloudy, rainy… precip began in some valleys with temps below 32°. Bittinger 2nw Valley was one of the areas before temps crept just above freezing and held 30s during the entire daylight period. Showers through the day, some dense fog in the afternoon. Temps much milder south n west. At the time of this posting, the warmer air is ready to overtake the areas prior to midnight, and will give numbers unreflective of the day.
Temp profile this afternoon…


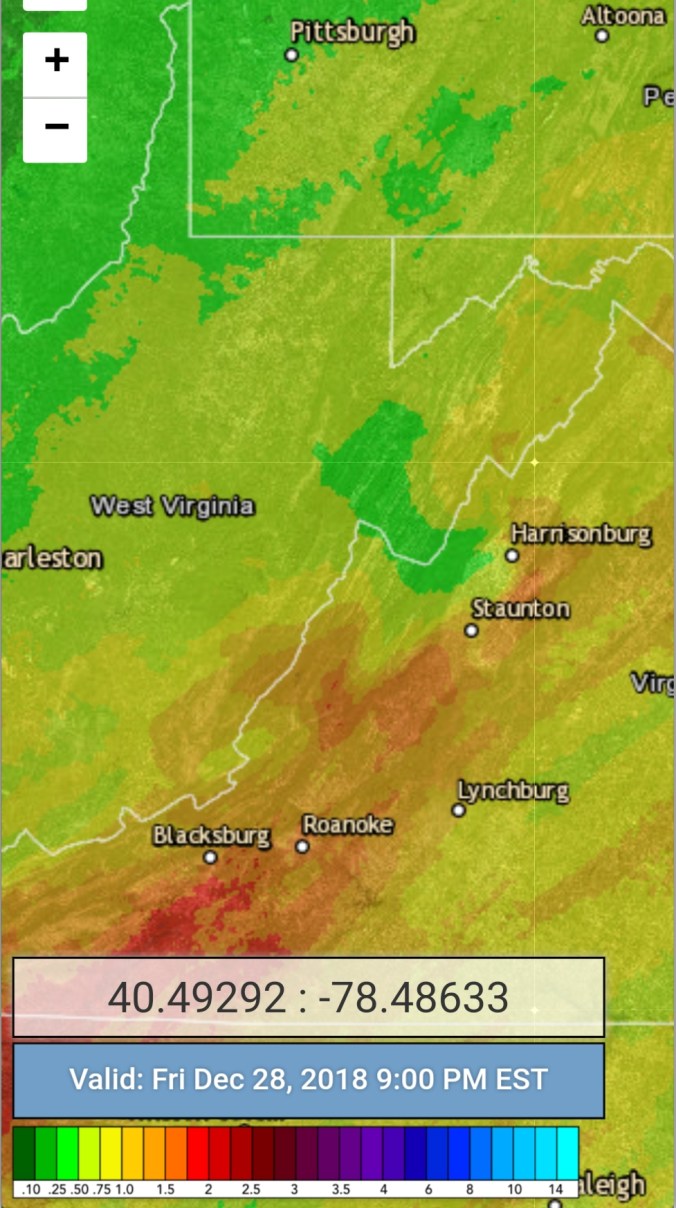
 Radar with estimates 9pm-9pm

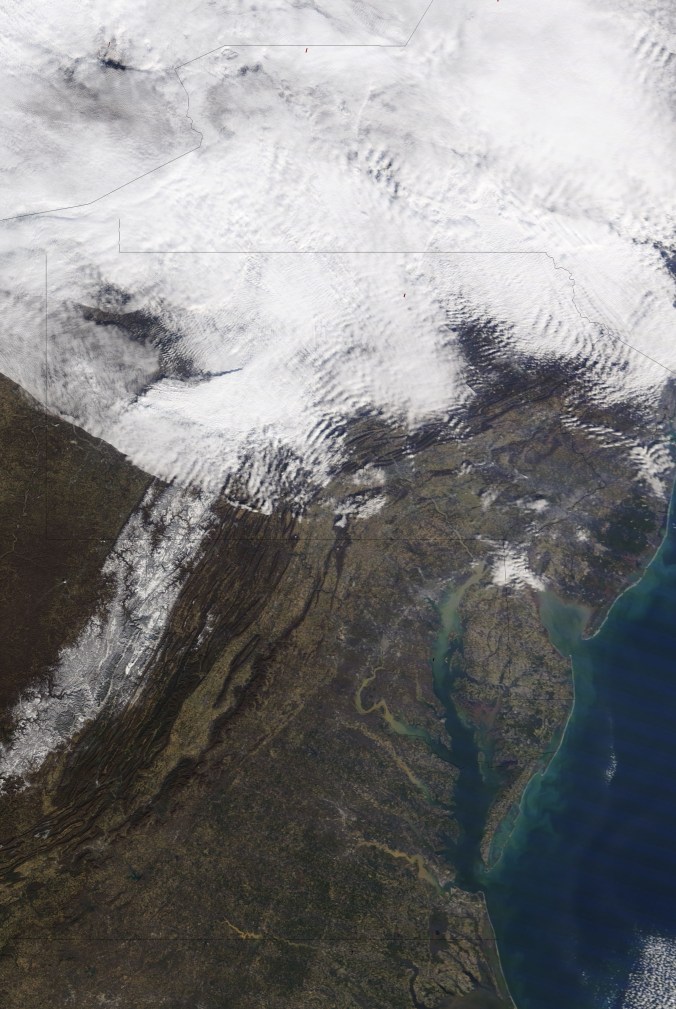
Satellite this afternoon
Flow
Surface features and 500mb height anomalies and flow..


Today’s 3km Nam, ICON models doing a great representation of temperature reality. The NWS grid, which I’ve documented time and time again fails at this setup. Upper 40s for the afternoon was +10 vs reality.


December summary
Temps:


Bittinger 2nw Valley:


Spruce Knob


Frost pocket data compiled by Dave Lesher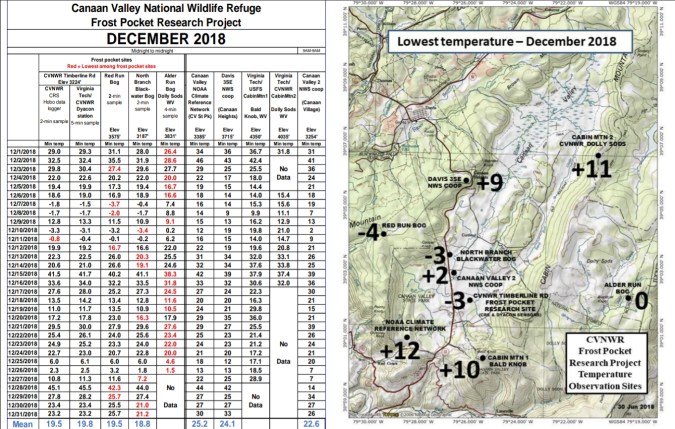
Precipitation:


… At Bittinger 2nw/ cocorahs Accident 3.9 E finished December with 5.45″ using midnight obs time. With .56 for December 31 at midnight. Stations officially use 7am times therefore 12/31 rain goes in the books for Jan 1. The station will officially end with 4.93″


Elsewhere using same guidelines except airports use midnight to midnight, therefore yesterdays rainfall included in 2018 for those particular sites:


Snowfall- At Bittinger 2nw Valley I finished with 11.1″ on the month. At Bittinger 2nw/cocorahs Accident 3.9E, also finished with 11.1″. My theory is during high wind, fluff events my tallies will be higher at the valley site due to higher ratio, and less breakdown of snowfall. Each amount is correct. Lots of factors in snowfall data. 


On the season I stand at 25.2″, Canaan Heights at 36″ and the season to date map looks pretty good for accuracy 
2018 Summary Data
Temps- With the wet year, temps did what you would expect temps to do with lots of cloud cover and precip. Daytime maxes overall slightly below normal, overnight mins above normal and the mean in the area average to slightly above.


Bittinger 2nw Valley Max temp of 2018 was 85.0 on July 4th, and the min temp was -16.0 on January 7th.
Precipitation….WET. WET. WET. That will be how 2018 gets summarized and will be a year to remember in that regard..Most stations running 20″+ over normal. Interesting to note Bayards record years in the late 20s. Questionable IMO.


Few chosen river gauges- Blackwater River at Davis, and Cassleman River at Grantsville. Only a few brief spells where they actually did fall below normal this year. Most of the year as you would expect was well above. During the rain event in September, the Cassleman gauge went above 4000cfs for only the 5th time in the gauges history….