Mainly sunny day, light SE winds for much of the day, keeping some locations cooler. Clouds light, and a sprinkle after nightfall
Temp profile this afternoon and one evening snippet
Radar void until late day sprinkles
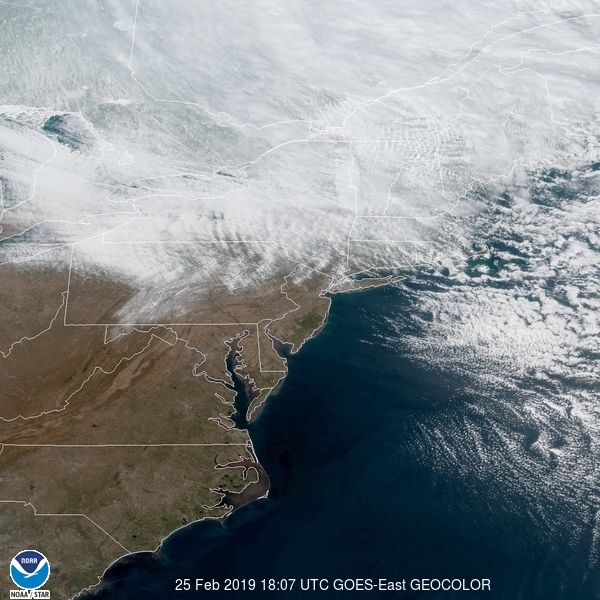
Satellite
Flow
Surface features and 500mb height anomalies and flow
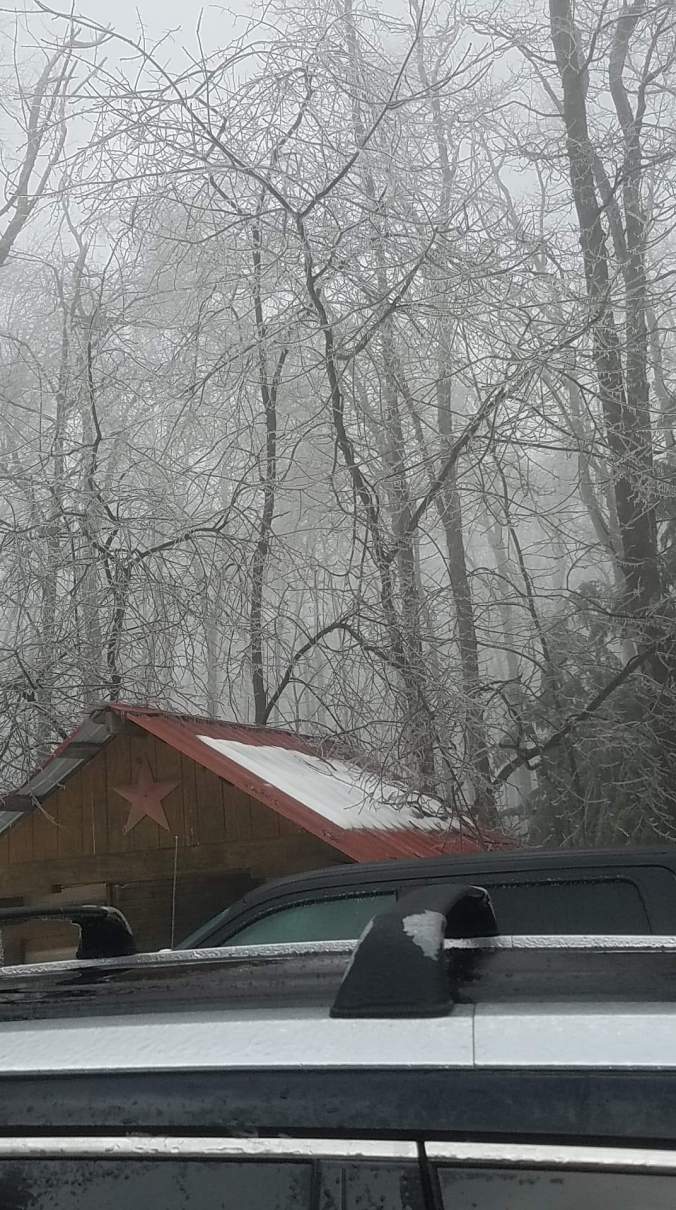
Pics today…. The time of year the higher sun angle melts off the open areas faster and the milder day somewhat in the wooded areas. The wide open areas in large are bare. Wooded areas light cover, north facing and sheltered areas, a solid cover(Bittinger 2nw Valley) a solid 2-5″ cover. Despite 40s today, low dewpoints held, and the shaded areas pretty well remained solid(as seen in video below)
Want to document the 9 sandhill cranes seen and photographed by Kathy Handyside near The Glades, Foxtown area near Bittinger today
The winter pattern…. A like year, not exact, but a like year resembles the winter of 1948-1949
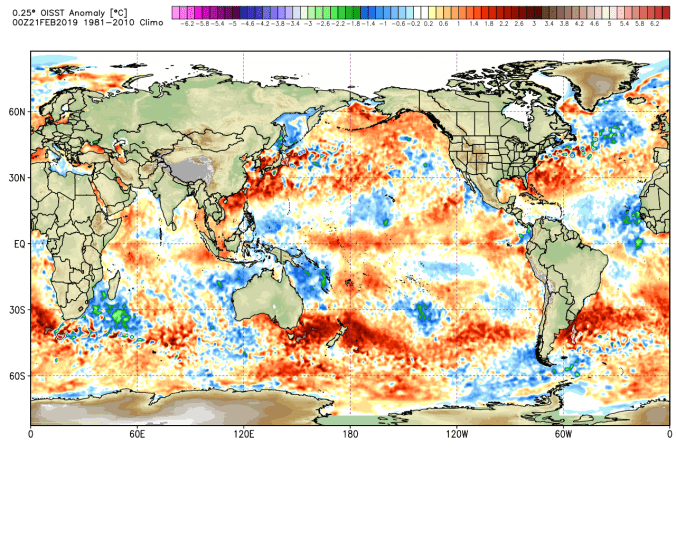
The SST anomalies- Likeness, warmth east of the dateline at 30N and extending west. Cooler anomlies east. This year very similiar except the warmth north of this area towards southern Alaska is more pronounced.
Cooler waters off the west coast. This has evolved this season. The anomaly was more extreme in 48-49. Likely making the pattern more stubborn.
This cool pool extends back to Hawaii. With the very cold air into Canada, plus this Pacific setup, favors a trough holding into the west. As seen especially the 2nd half of winter. This year, there was a lot more cold air in play vs 48-49 winter…
With more cold air in play, the next feature to talk about is the SE ridge. That feature was much like the 48-49. The difference was we had more cold air in play this year. This big ridge, like a boulder in a river, sent systems up to our west. With cold highs passing north, we seen a lot of these systems as overrunning systems which affects the eastern areas from Mt. Storm, north central Garrett and points east and northeast. Really leaves the Wv high ground with minimal winter. As non snowy as this year has been, it’s ahead of 48-49, the least snowy winter recorded at Canaan. The overall Atlantic configuration is very similiar.
The enso has like features as well, as well as to cool waters that developed east of Australia. The enso, mjo often failed to jive this year to typical correlations .
So, with all these like(not identical) features in the sea surface temps, what did the overall winter of 48-49 look like vs this year(Dec-Feb).
More cold in play this year, as evident by northern New England vs 48-49. Enough cold in the pattern for the north, northeastern areas and the lower elevations east of the mts to be in the cold zone for these over running events.(color code is different)
In general, the overall pattern is a lot alike the 48-49 season with some variances.
Some high cloudiness at times, but overall a mostly sunny day. The higher sun angle is doing its thing as sunny areas melt off, shady areas hold status quo, especially with low dew points.
Temp profile this afternoon
Radar void
Satellite
Flow
Surface features and 500mb height anomalies and flow
Freezing Rain early in the classic cold zones. (That has discussed thoroughly where those are). That gave way to showers, breaking skies, strong winds and rapidly rising temps initially, then falling temps. Showers with some pockets of hail… then late day some pockets of light scattered snow. The big story is the strong winds.
Temp profile this afternoon(first image is morning temps, gives a good idea of freezing zones) Then the warm sector midday, followed by falling temps from the point of those 2 images.
Radar
Satellite
Flow
Surface features and 500mb height anomalies and flow
Pics today
Photo by Bill Buckel at Bittinger 2nw in the morning
Photo by Scott Graham near Bittinger
From Savage Mt 5pm
Winds today are the big story. But first a quick rundown on the temp setup last night. Canaan Heights 40s, Northern Cabin Mt 40s. Like clockwork, the boundary held. Mt.Storm 28-31 overnight. Further north in Garrett. mainly Mchenry east, then that angle near Sand Flat to Backbone Mt and high ground NE.
Winds- Snowshoe reporting a 88mph gust. This off a private station, no data quality control. Located within Snowshoe Village and probably enhanced by its surroundings, in other words likely a artificially high number. However media , and the weather service has ran with it.
Northern Cabin Mt did pick up a actual 74mph gust.
NWS ice call for Garrett County was dreadful once again. The Saturday morning call was freezing rain to rain 9am, then 1pm with rain afterwards. Then no mention of freezing. Then a change to a winter weather advisory to 1am, then changed to 7am. The 1-3° warm biased grid in these setups destroys their forecast. I do not know how many documentations it will take for them to recognize this to make a change.
High clouds, dimmed sun, calm to very light winds, low dewpoints the theme of the day. Despite temps into the low 40s, the low dewpoints made snow melt very minimal.
Temp profile this afternoon
Radar
Satellite
Flow
Surface features and 500mb height anomalies and flow
Pics today
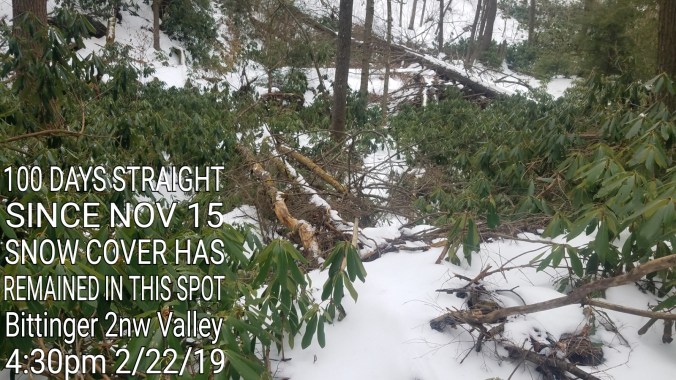
Protected/sheltered area in the valley. A bowl shaped area, lays low, last to see sun, first to see it go away, refrigerated by snowpack on the hillsides, shaded, less wind….Today marks the 100th straight day with snow on the ground at this location. Not drifts, not pile, just snow cover. That began with the Nov 15th event. That concrete like sleet, snow event has remained. This has been documented with pics through some of the warmer periods in early Jan, when it was the last standing snow spot(non drift)
Cloudy start, after very icy conditions until the 1-3am. Some ice remained on secondary roads despite 40° temps and wind. That melted off after dawn… temps slowly fell in the morning hours before rising midday, early afternoon. Drier air mass in place. Dry enough air mass, despite low 40s, shady areas at Bittinger 2nw Valley still had ice cover on the snowpack from last night in spots.
Temp profile this afternoon
Radar
Satellite
Flow
Surface features and 500mb height anomalies and flow
Pics today
Joe Bastardi mentioned a like setup a few days ago to the system yesterday. December 27/28, 1990. In digging a little further, the overall pattern was strikingly similiar.
A big, dominant SE ridge, 590Heights off SE Florida. 564-570 heights over our area. Almost identical in both occasions. Not favorable for mid atlantic snow events. Deep trough south of Greenland, and western U.S…nearly identical . Big Ridge into Alaska , trough west of Hawaii, almost identical. Color enhancements are slightly different on each maps, with the present day being more detailed here.
That system, while earlier in the season, performed in a similiar fashion. A big SE ridge does not favor the WV mts and west of them for cold or snow or much winter period besides fleeting glances. The lower elevations on the east side of the Allegheny Front will run into better winter producing systems than 4000′ + elevations will, under a SE ridge pattern. Often ice is the most common winter precip with the setup east of the mountains and north central Garrett, and points Northeast. We have seen plenty of these over running events in this setup.
My head fight was- how heavy and how long that initial heavy snow period would last. Once it’s heavy and if the precip holds, it doesn’t want to changeover to sleet. In this case it lasted an additional, in most cases 1-2 hours or so longer than I guessed and that made a +1-+4 increase with overall totals, in most cases, Garrett, and east, and east of the Front. The WV mts and west held course pretty well. The ice, while creating ” imo ” the worst travel of the year last night(Sunday night could be argued for) wasn’t the tree snapping ice that it had potential to be.
Back to 1990 system snowfall… the very like pattern to yesterdays event – Snowfall
Location 1990 2019
Canaan Valley 4.0 3.8
Canaan Heights — 5.0
Bayard. 4.0 5.5
Rowlesburg 2.5 2.0
Oakland 6.0 5.5
Bittinger 2nw Valley — 5.4 *
Frostburg 12.5 6.2
Cumberland 13.0 7.2/ unofficial non coop or cocorahs report of 10
Hyndman 13.0 7.0 nearby
Keyser/New Creek —- 7.7
Romney 10.0 6.1
Morgantown. 1.8 1.2
Fairmont 2.0 >1
Mill Gap Va 3.0 4.0
Petersburg. 8.0 6.0
Moorefield 9.0 5.5
7Springs 9.0 7.2
The 1990 event was a little greater, but the setup, warm air advection system, boundaries, amounts, strikingly similiar.
*With my 5.4″ yesterday, noted in the blog page. 5.1″ had fell at the time of changeover. No boardsweep, but I did clear a seperate area to record sleet, which does get recorded as snow, this was done just to seperate the 2, but for overall tallies its one. I picked up .9 sleet after recording 5.1 snow. It did raise my snowfall to 5.4 as sleet overall works to beat down the depth vs add. Was actually surprised to add .3.
Pics below, the 500 of yesterday vs the 1990 event. As well as the 500 and surface features off Penn State ewall site from 1990.
Modeled snow depth this afternoon showing that classic zone that can see some decent winter in the big SE ridge patterns. Mainly these are over running ice events
18z 3km Nam showing this setup well in the temps coming up this Saturday
Heavy snow predawn and post dawn. I had a change to sleet 8:30-8:45. This persisted past midday, then light precip in ice ball, freezing drizzle form. Light rain increase in the evening, creating very icy conditions. Thundersnow this am in Cumberland, Thunder freezing rain 8:45pm in parts of the area. Large temp variances as well. Canaan to Mt Storm was 10-16°.. Daytime maxes by midnight may not show the true variance.
Temp profile this afternoon and later
Radar
Snowfall- picked up a total of 5.4″ with details in the photos. 1.9″ through 6am, 5.1″ through changeover at 8:45am, then picked up .9″ Sleet that managed to add .3″ depth. 69.6″ on the season.
Satellite
Flow
Surface features and 500mb height anomalies and flow