September 22,2019
Sept 22(Sun) min. max. avg
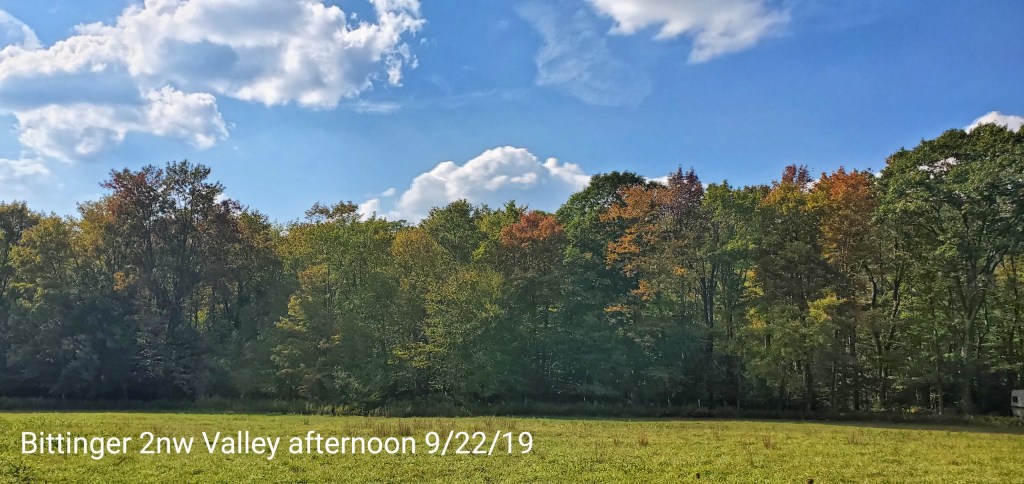
Bitt 2nw Valley
Garrett College
Can-Heights
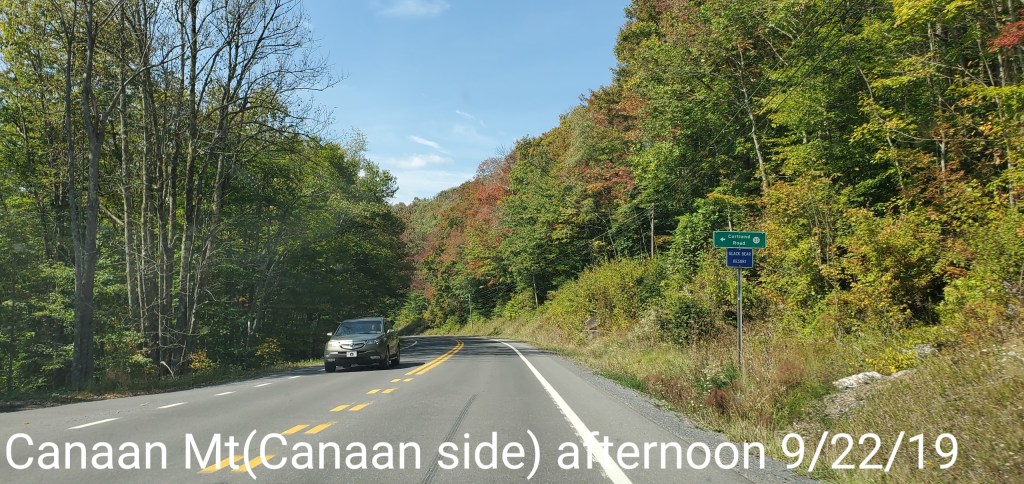
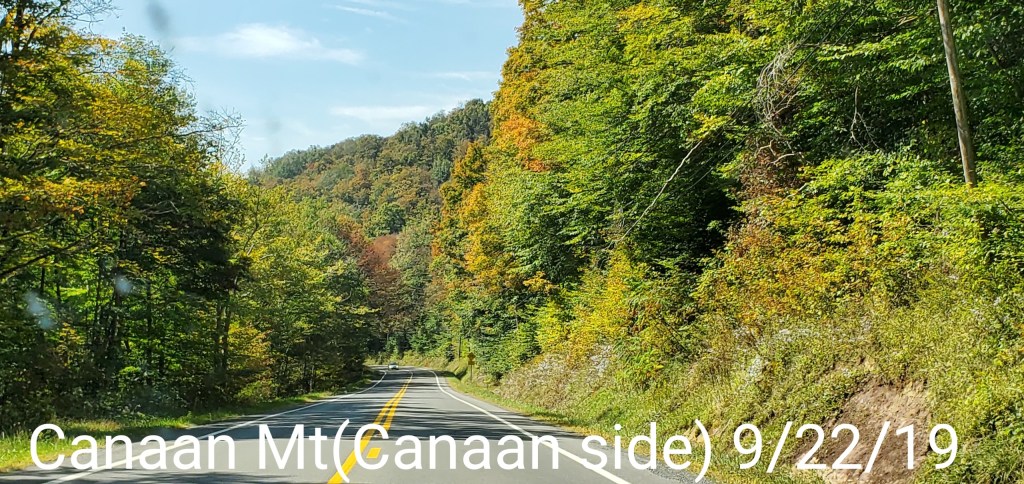
CRN-Canaan
Cabin Mt
Cabin Mt N
Spruce Knob
Snowshoe
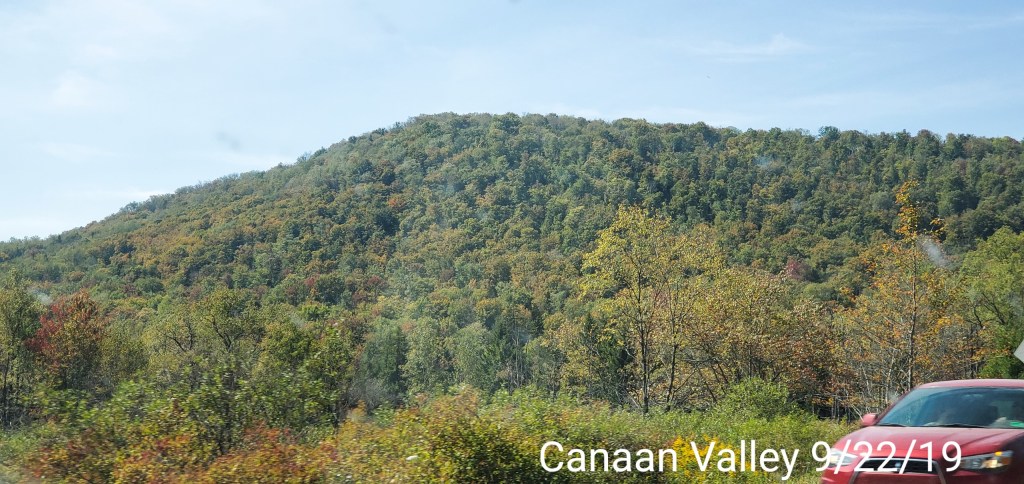
Can-Valley Floor N
7Sp7Sprin
Cumberland AP
Lots of sun, and a few clouds. Mild September day.
Temps today
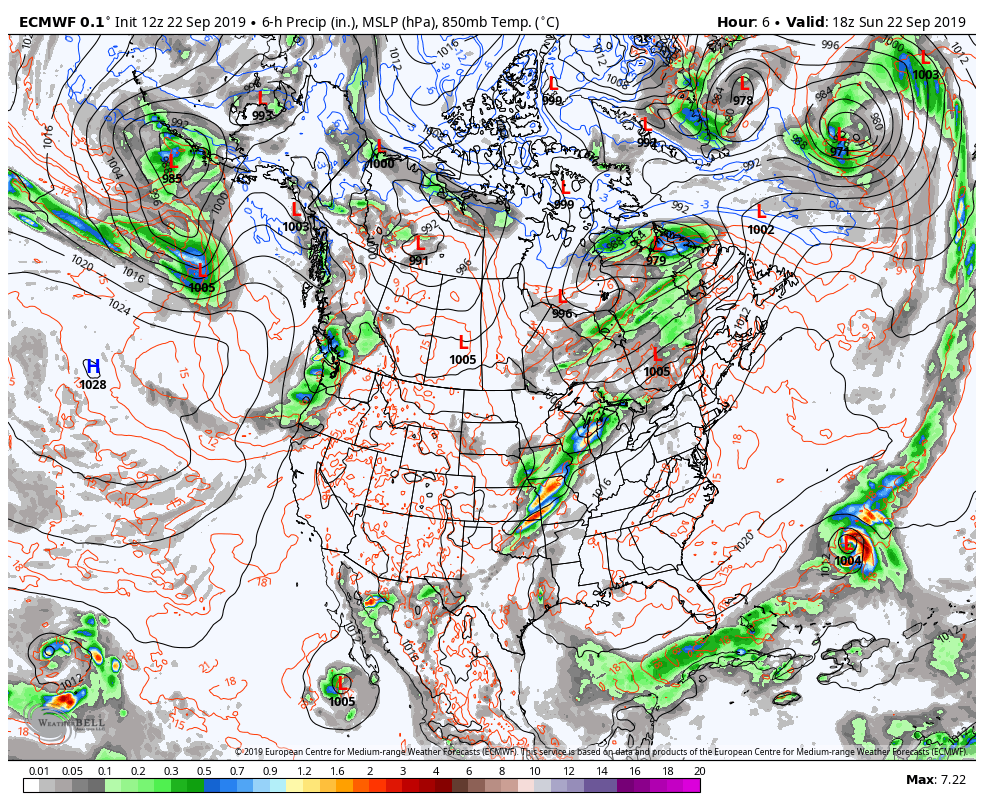
Radar
Satellite
Flow
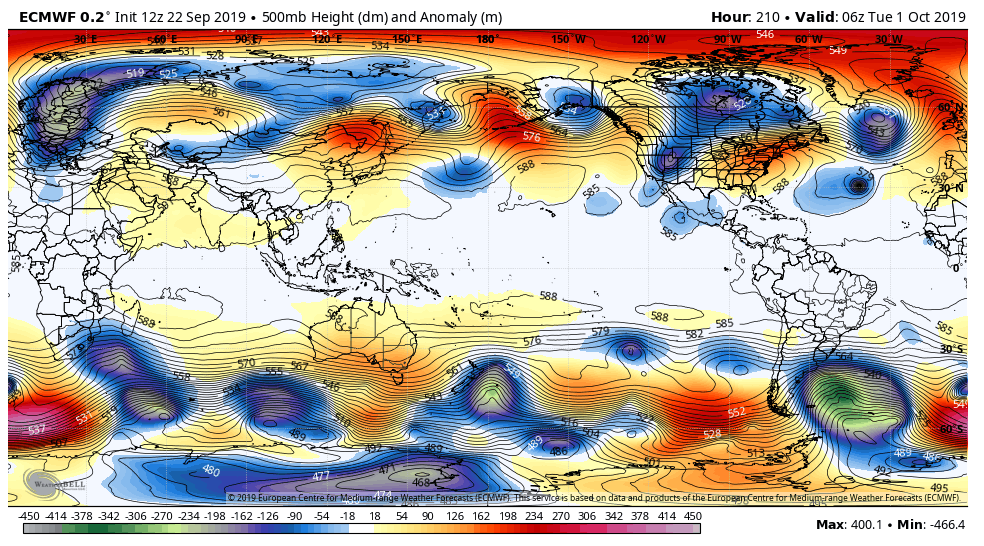
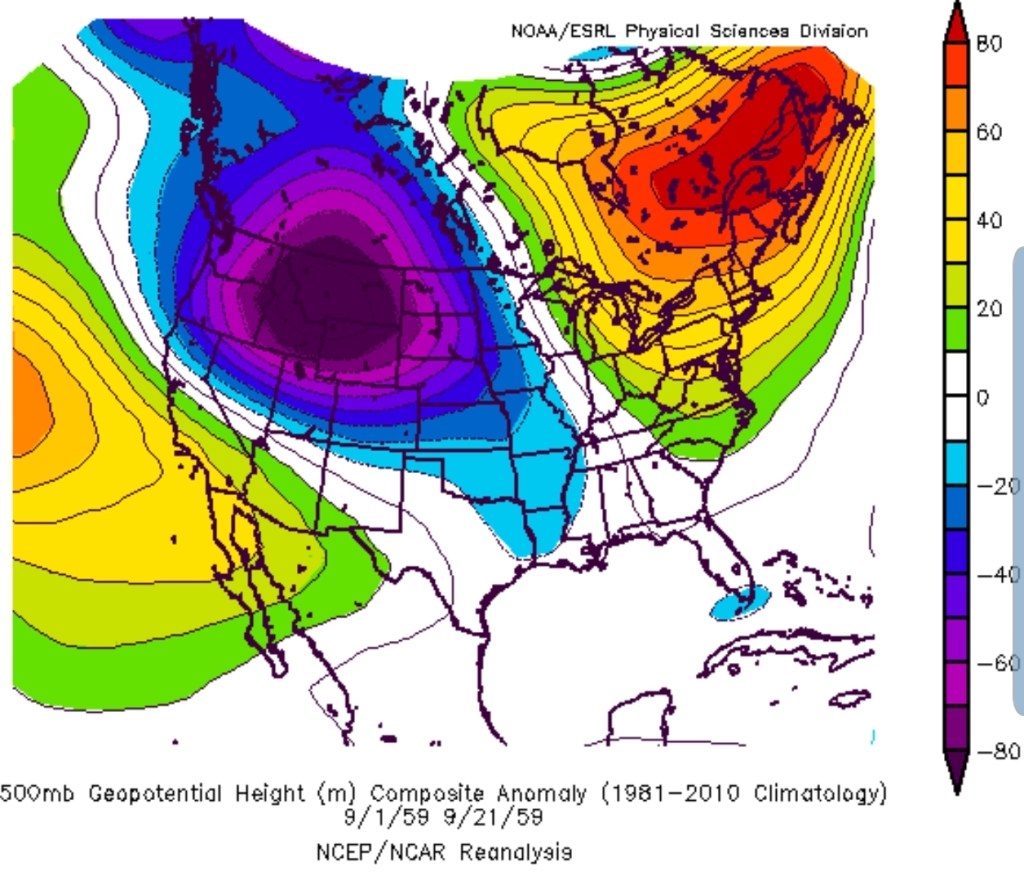
Surface features and 500mb height anomalies and flow

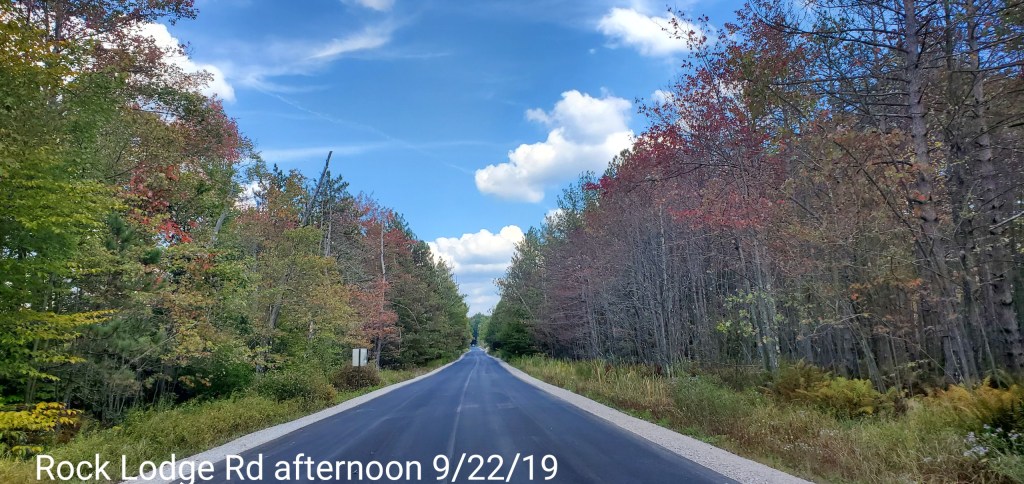
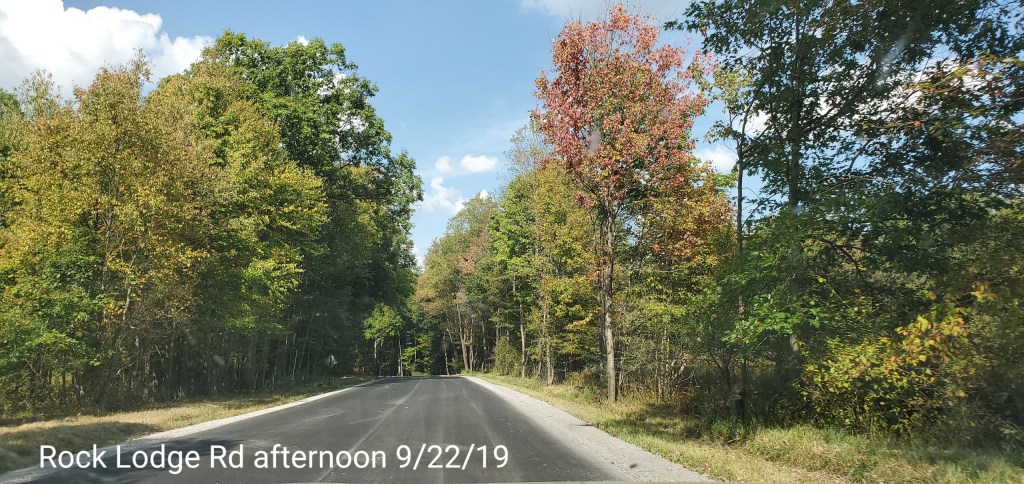
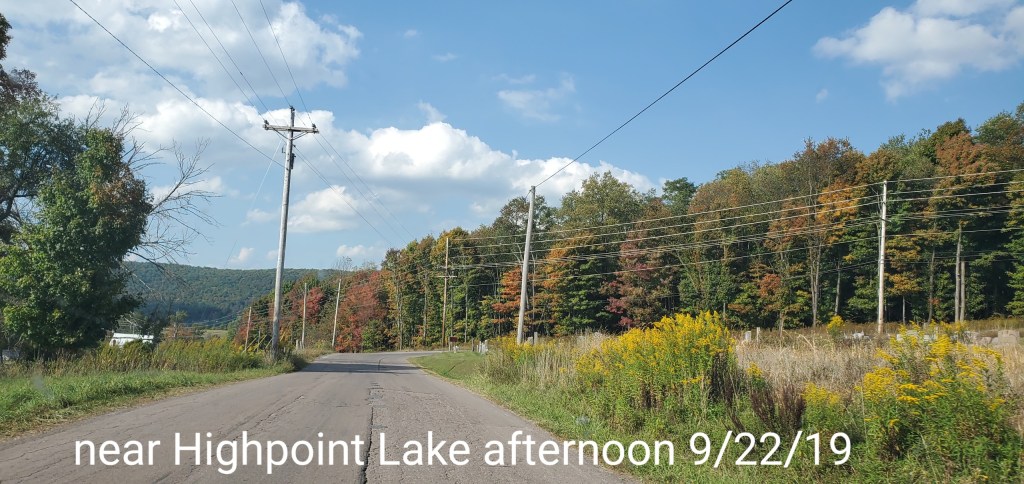
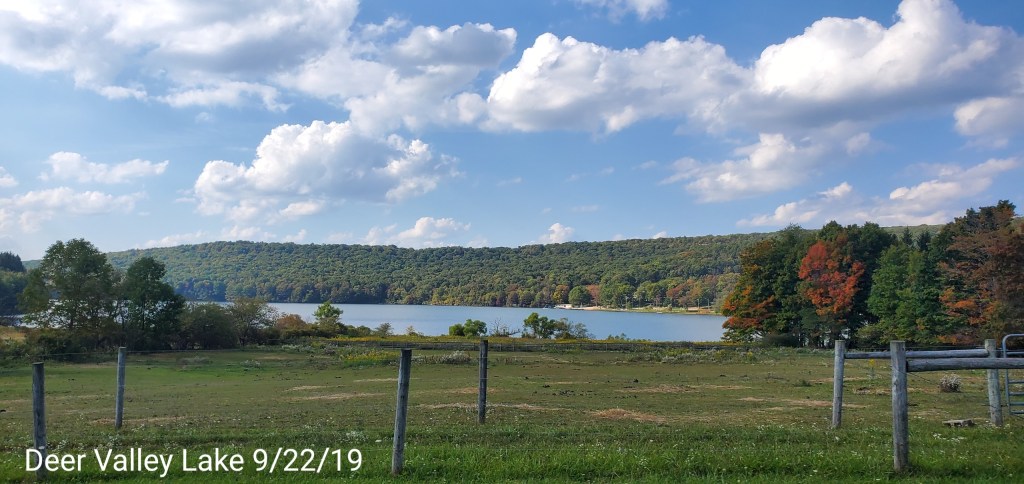
Pics today, setting up to dismiss some panic talk, and no color anywhere talk that’s going on. Lots of factors play a role area to area, tree type, min temps, moisture or lack of, soil.
On the go….
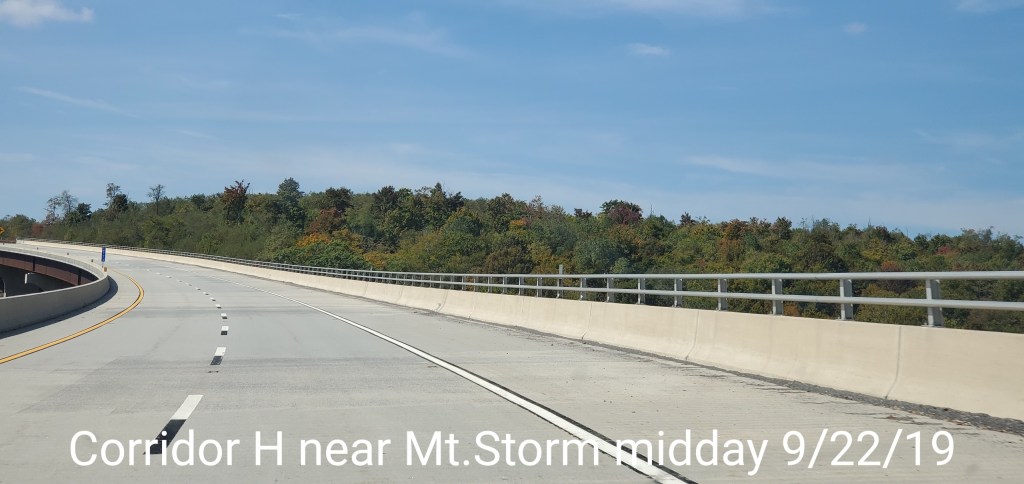
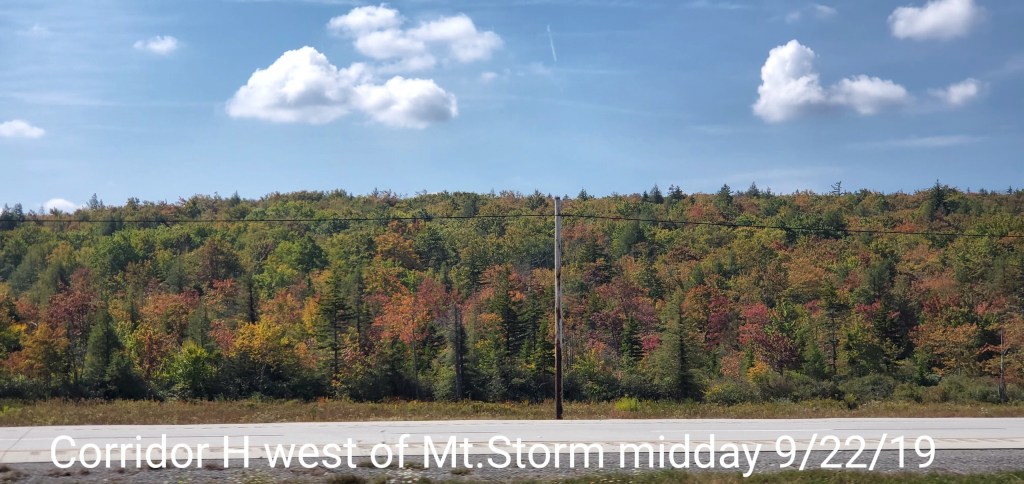
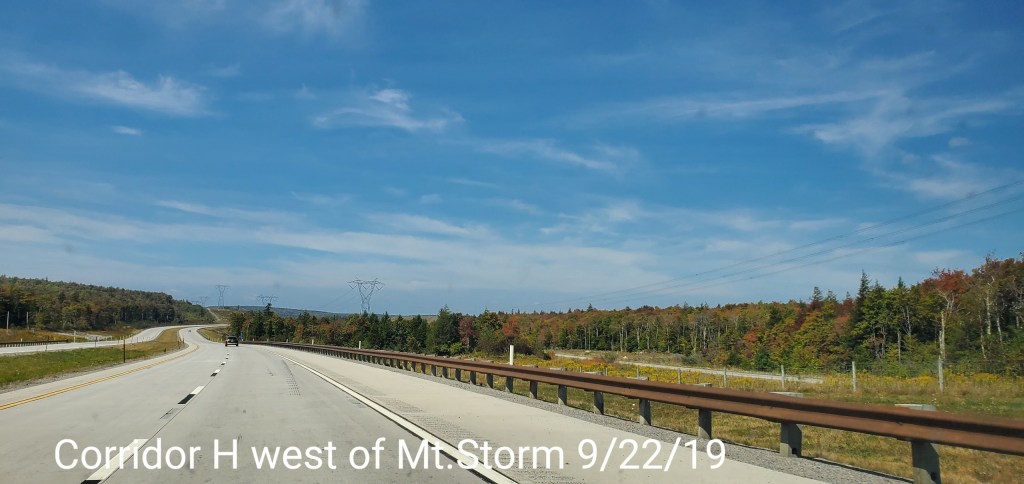
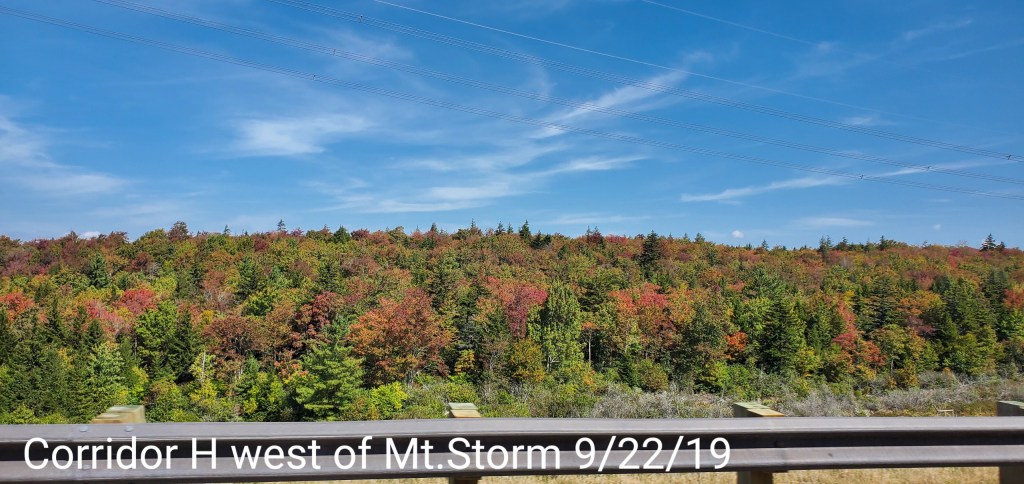
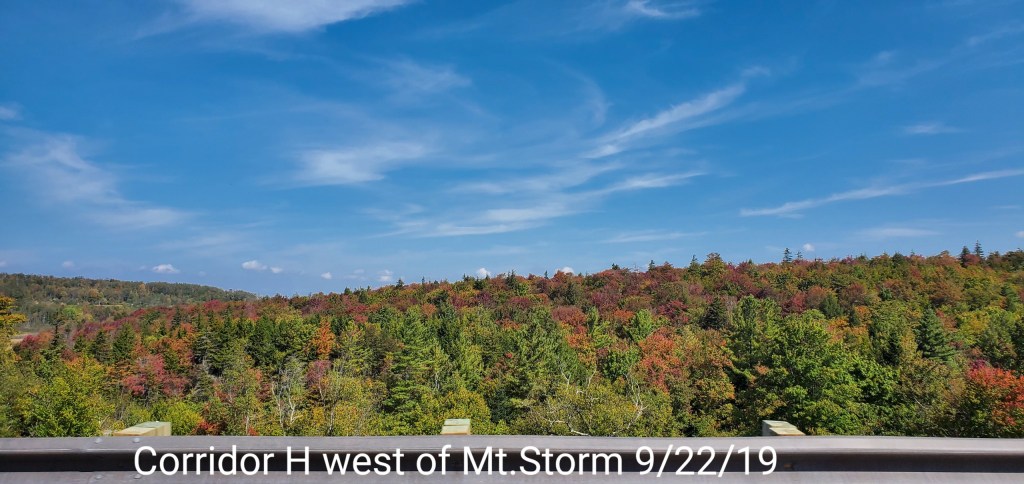
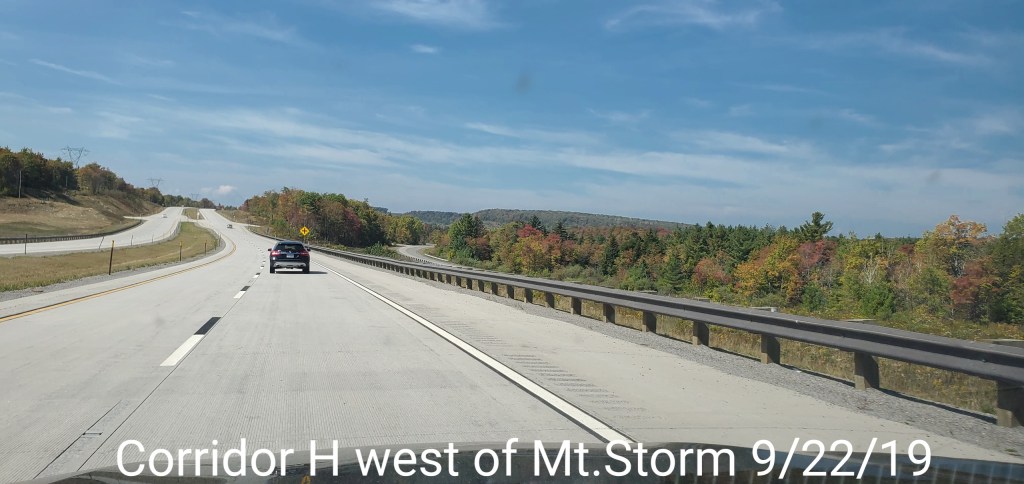
Corridor H- Mt. Storm to Davis
East to West. Corridor H(aka 48) between Mt. Storm Lake and Mettiki really has some decent color to spotty patches of really good color. As you go from Metikki entrance to Davis, the color backs off. Why? Biggest factor is tree type mixes alot more in the locust, cherry type vs more in the way of maples east. Locust tend to hold green, brown up, fall. Cherry gets fringed red, yellow, dry and fall, especially with the dry weather of late.
Elevation in this stretch generally 3150-3450′


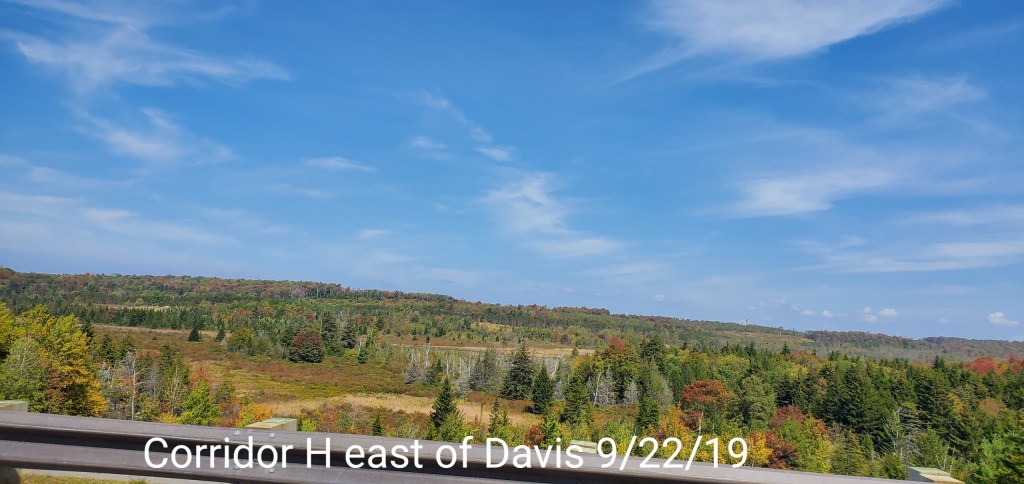
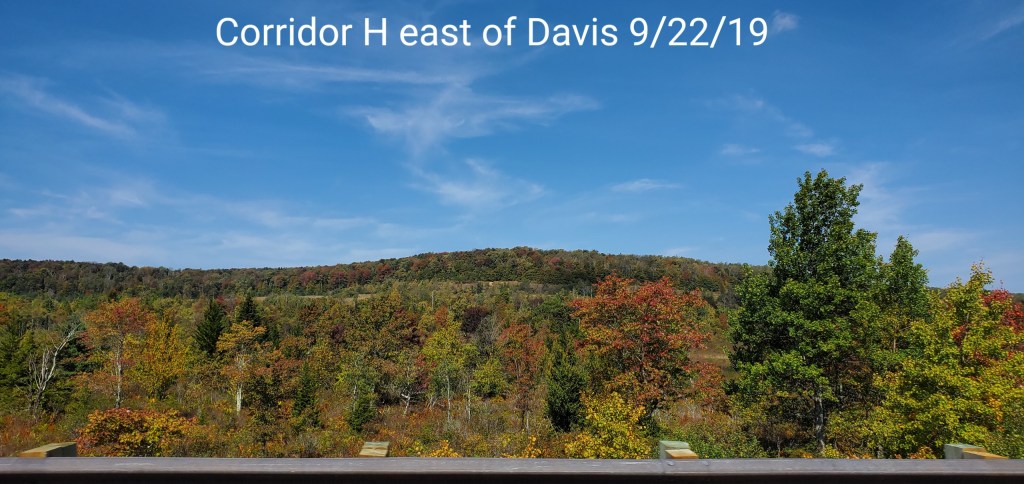

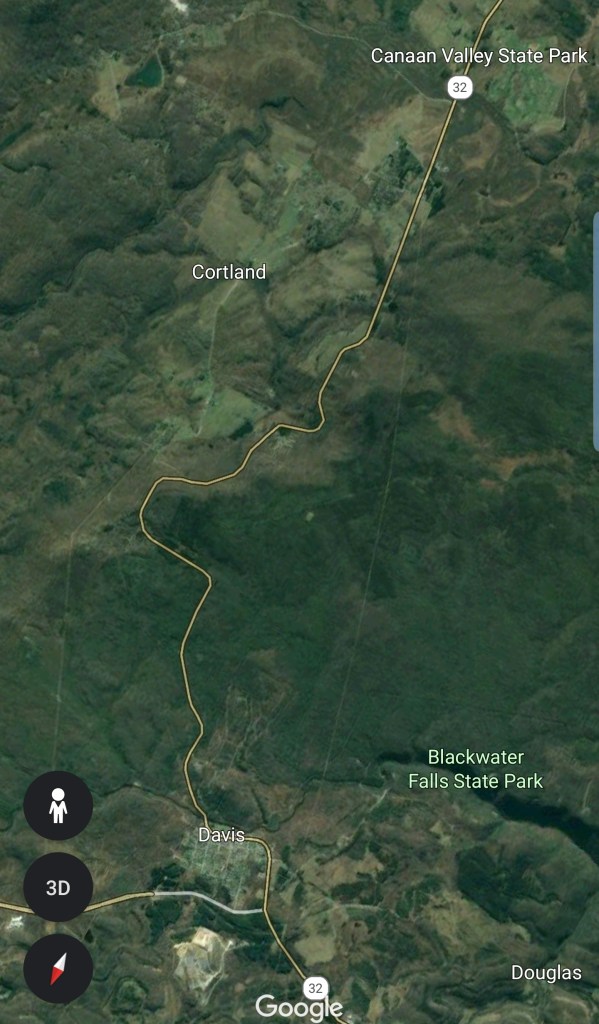
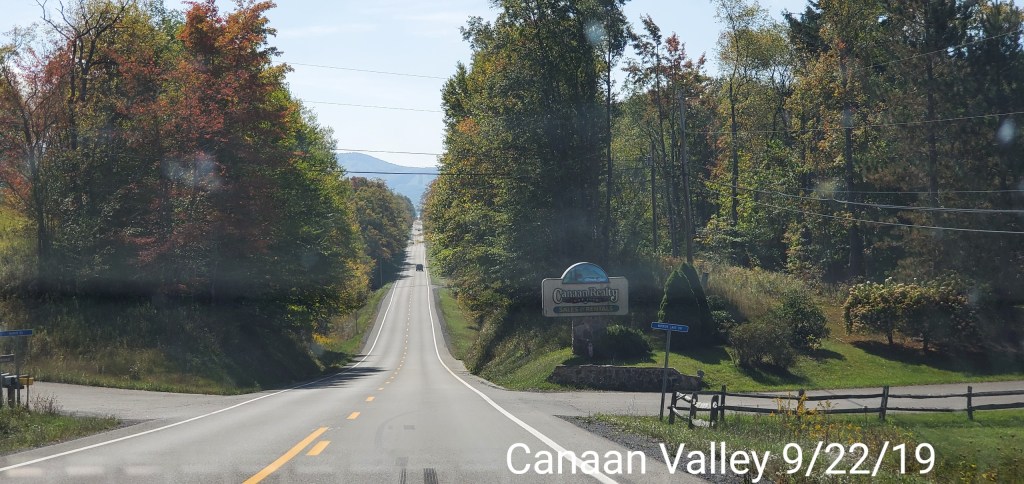
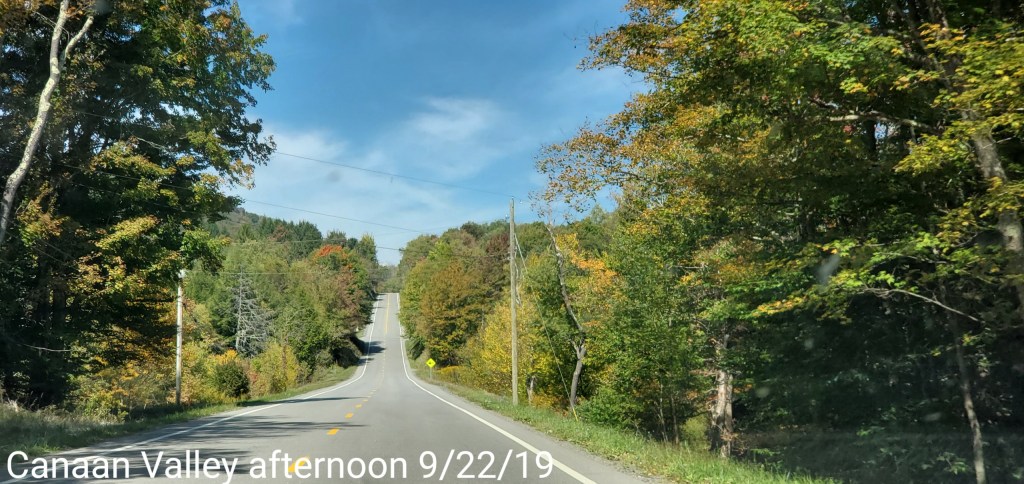
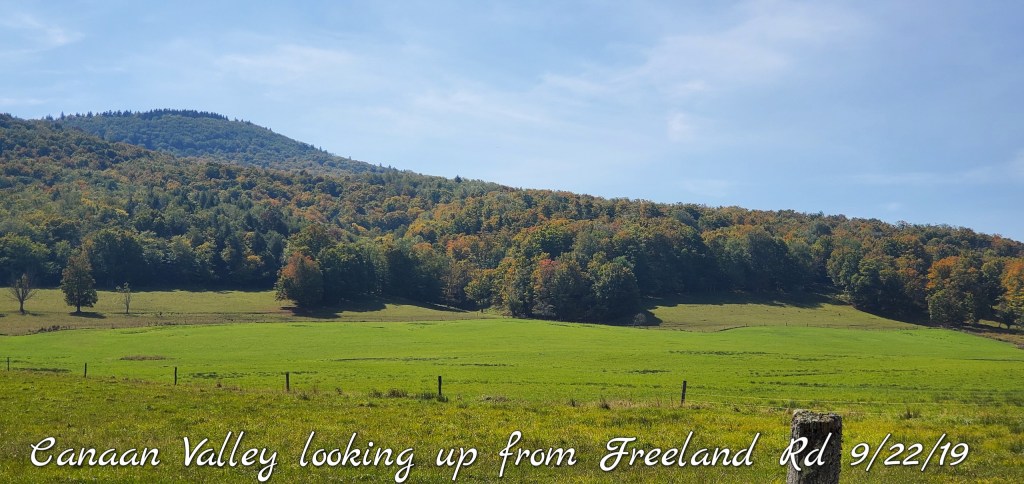
Davis into Canaan Valley
More in the way of maples, beech, birch, cherry, hawthorn near Davis along the Blackwater, also some locust. The maples have at least fringe colors and spotty trees of good color. Beech are fringe coloring, birches very little color and they are typically later. Locust are blah. There is color over this section. The west side of Canaan Mt. Has I’d say 35% color, that’s somewhat less than typical. We still have a week to go in the month. This will creep up. You get back along the bog areas on Canaan Mt. The colors are as good as they’ll get. Most trees have colors. Maples are dominant in some of those areas. Those maples also get stressed due to their environment of wet ground(even now) and a much colder nighttime environment. These types of high bogs are overall the coldest average temp locations in the region.
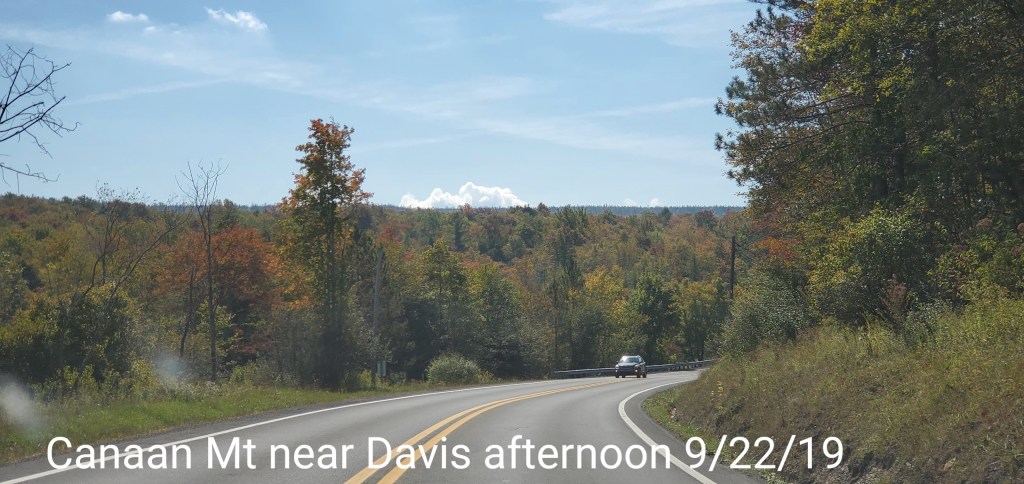
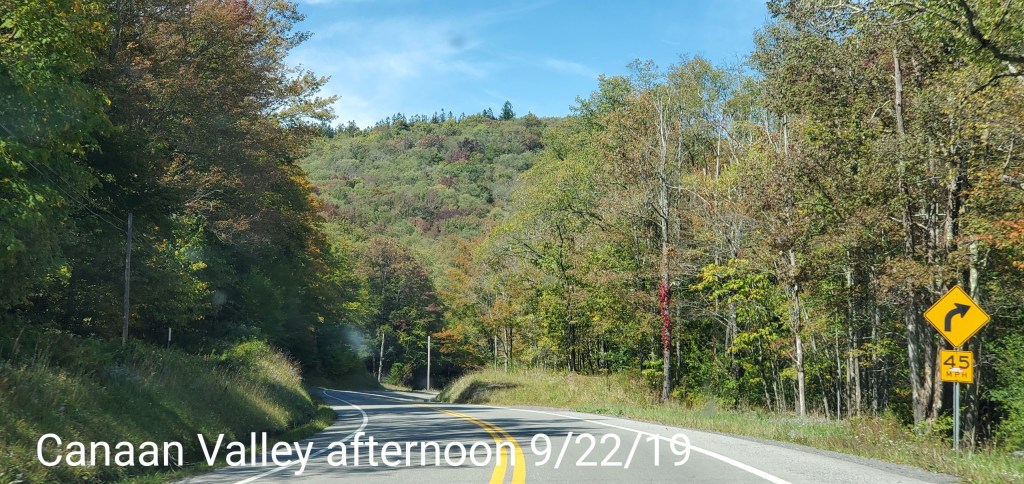
At the peak of Canaan Heights, along 32, lots of beech as you Crest down into Canaan. Those have changed some and some have fell off. On into Canaan, the northern areas of the east slopes of Canaan mountain have a fair amount of maple, some have some color, others lagging. The middle to southern half of the east side of Canaan Mt. Locust, cherry, beech, birch, spotty maple, so color is limited. These hillsides are also the mildest at night consistently. That too impacts it. As far as the Valley floor, you get around the Balsam for areas, example Freeland Boardwalk. Plenty of bright yellows amongst the firs These are areas that are much colder at nights. Some of these spots were 20s last week.
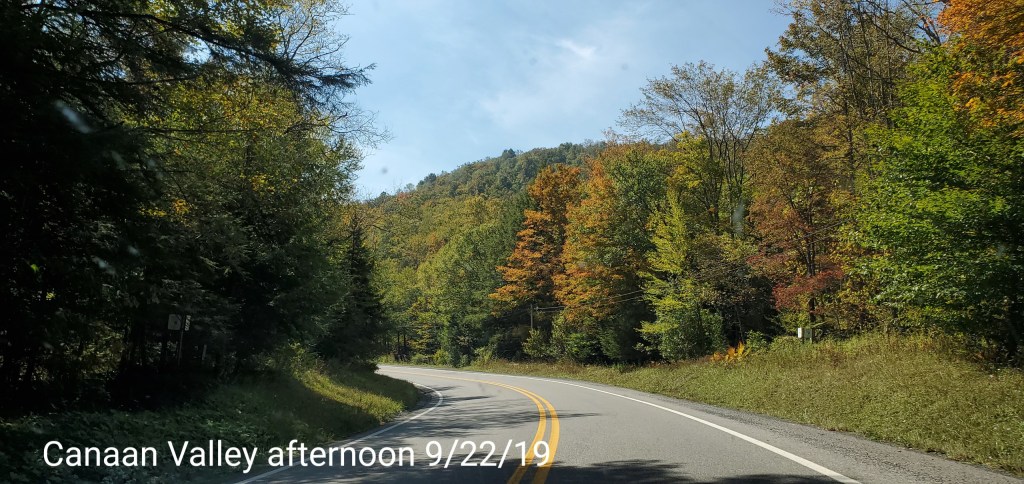
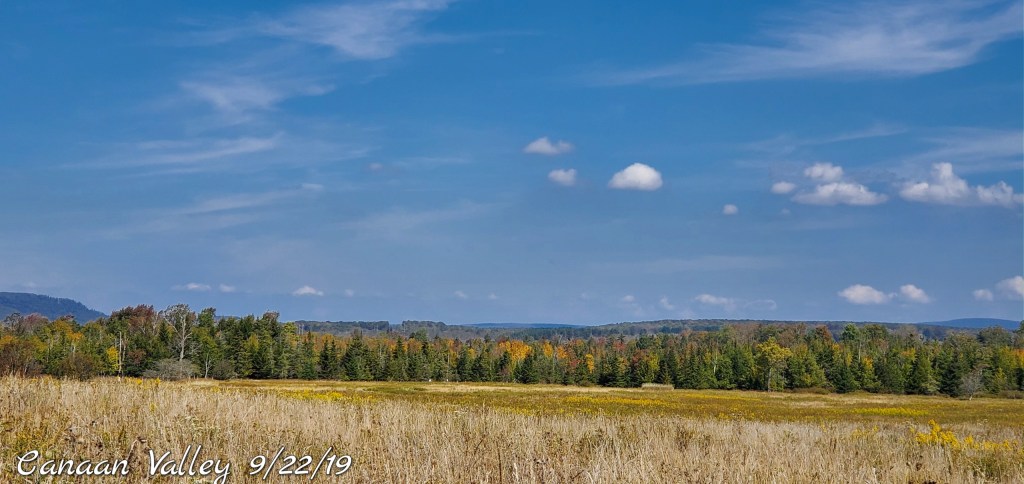
Over towards the State Park, maples and lots of birch, with birch being later, greens are to be expected in these areas, typically Oct 5-10 they pop. Also same for the Blackwater Canyon except a few days later.
Elevations across this area- mainly 3100, up over 3700 along Rt32, back down to hair over 3200 on the Valley.

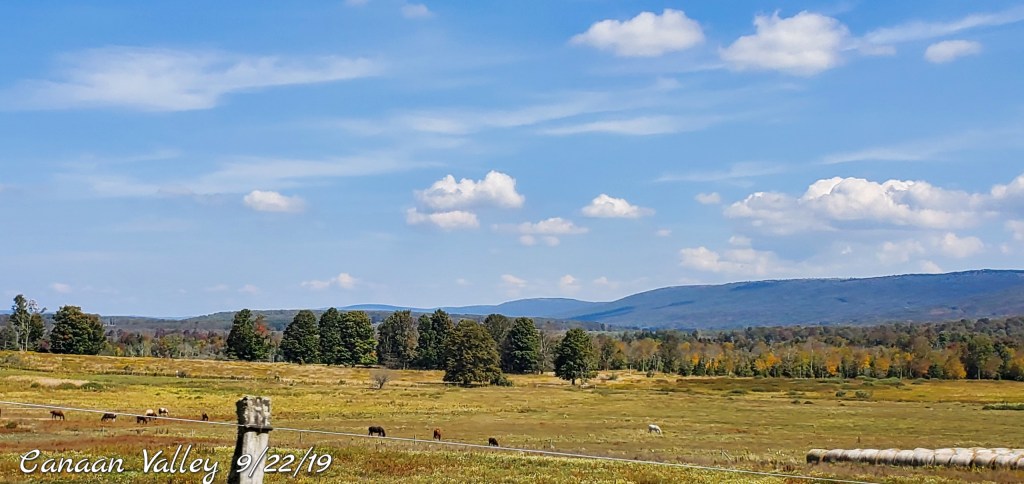
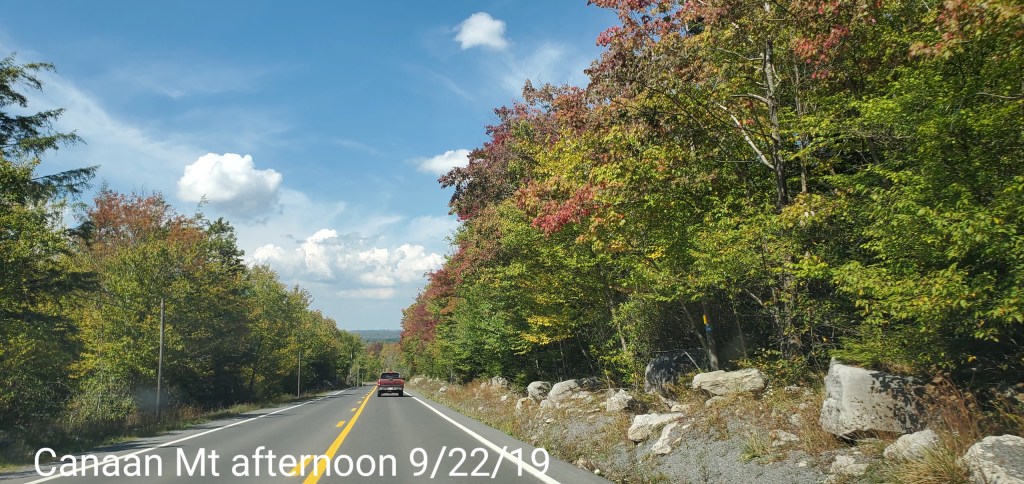
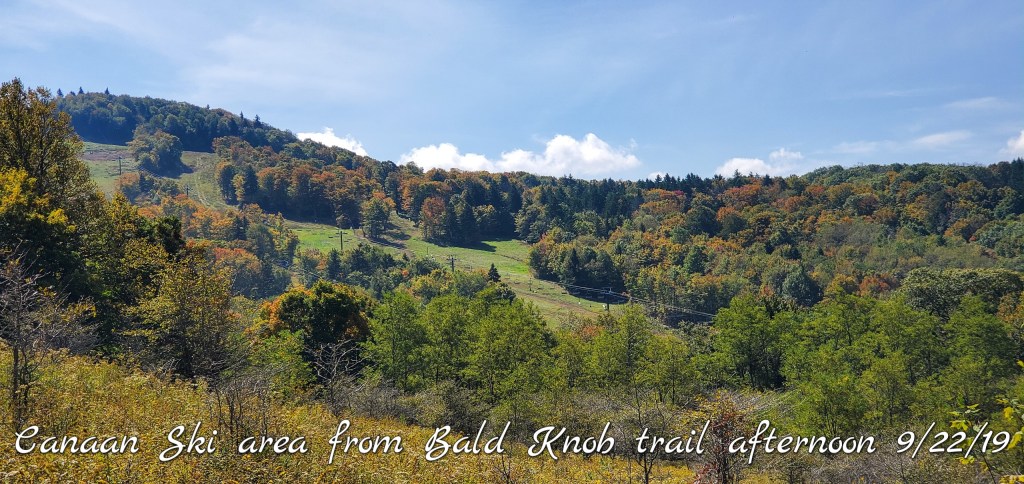
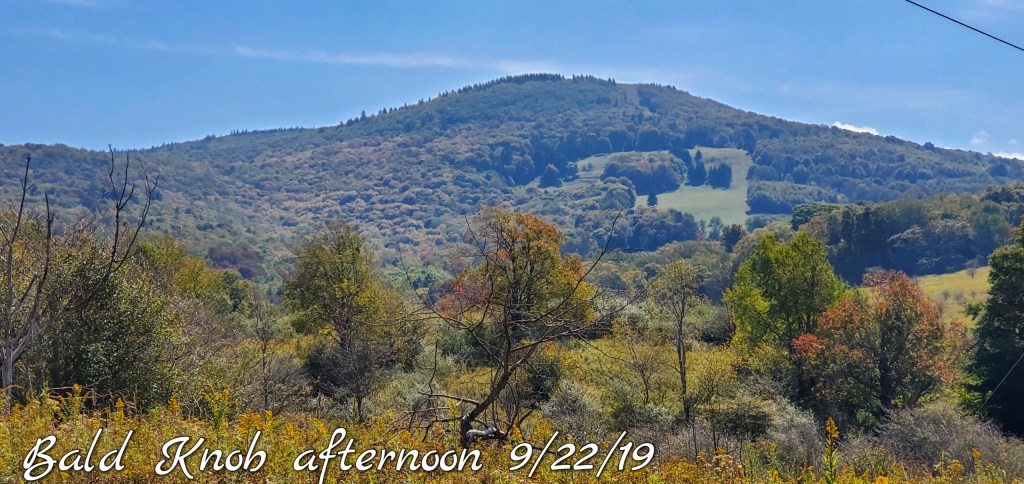
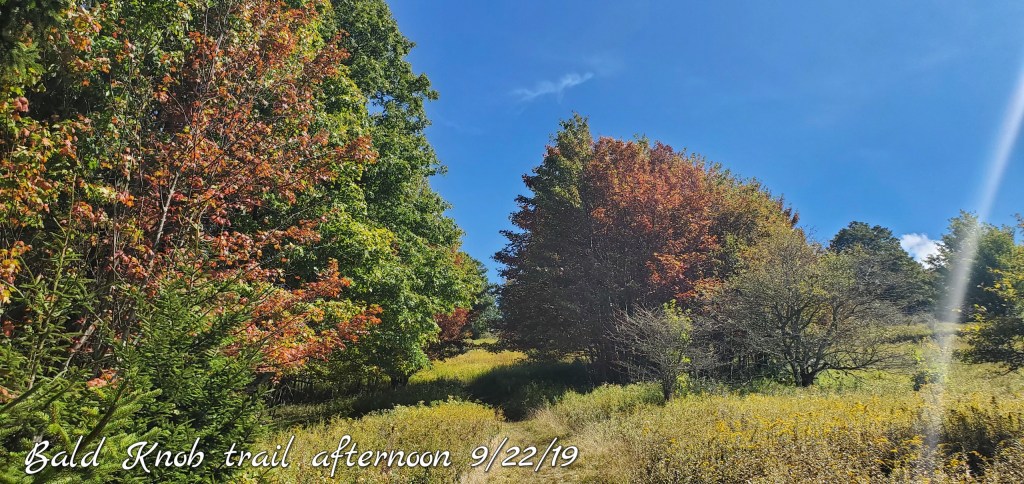
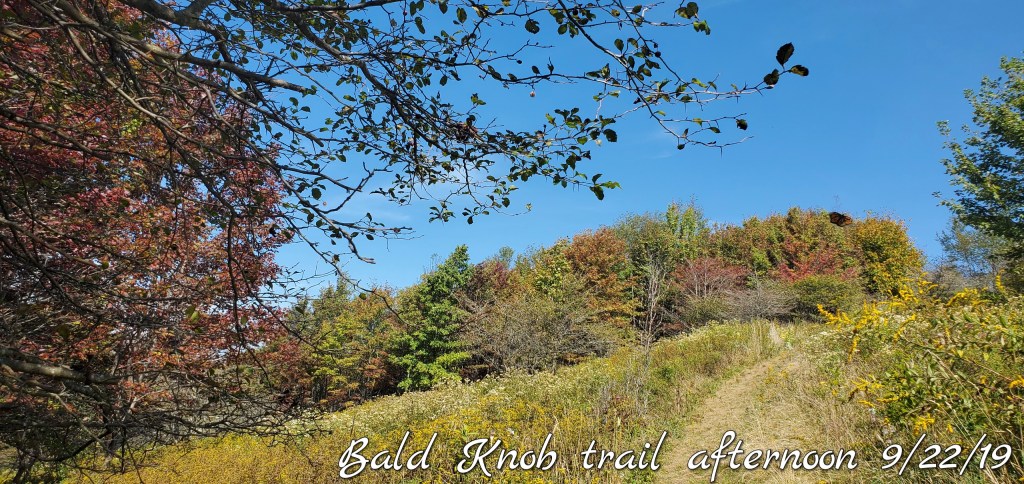
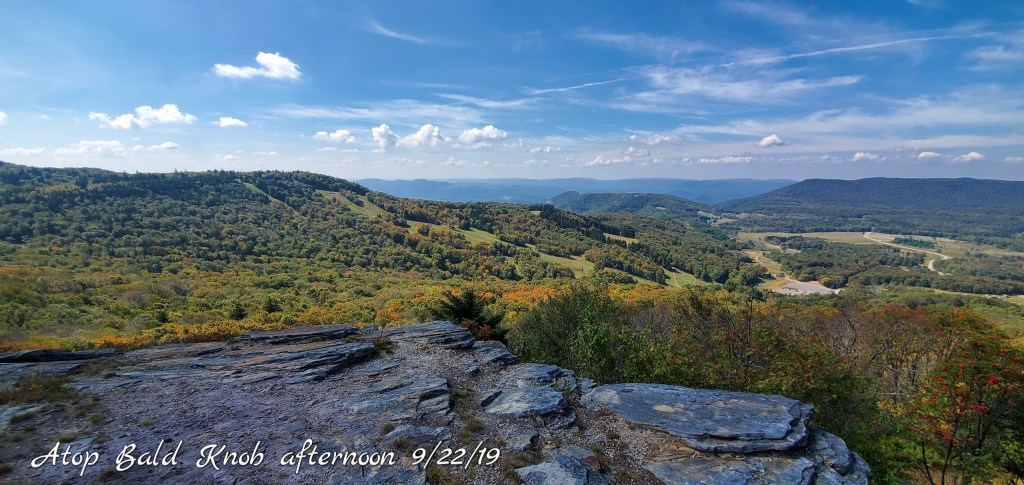
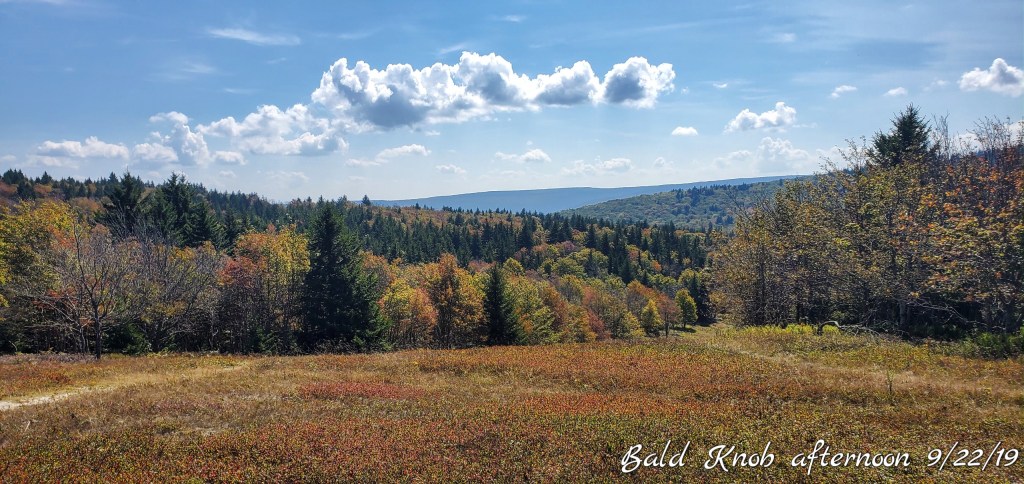
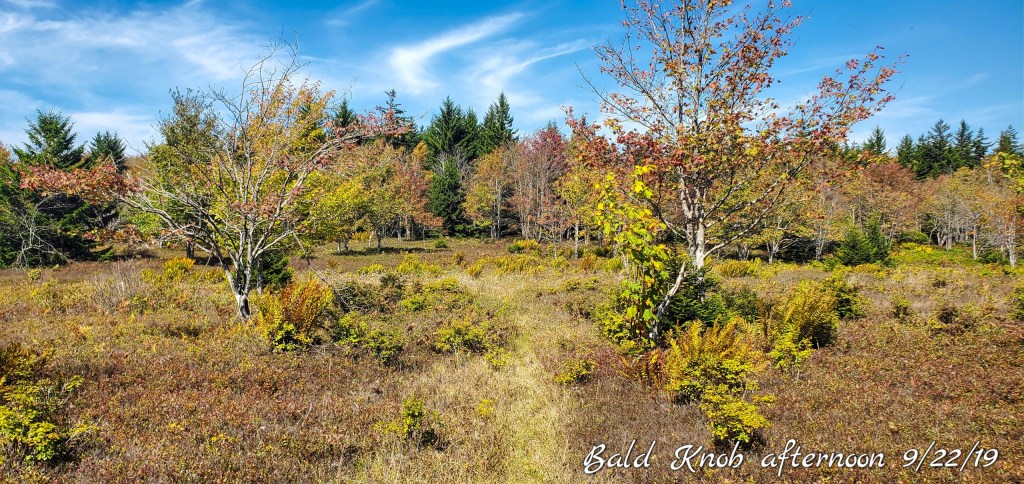
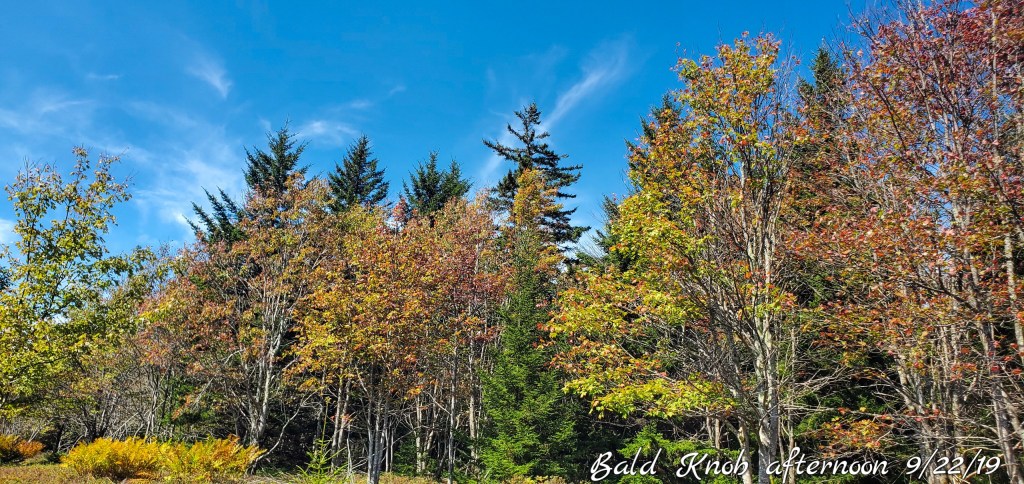
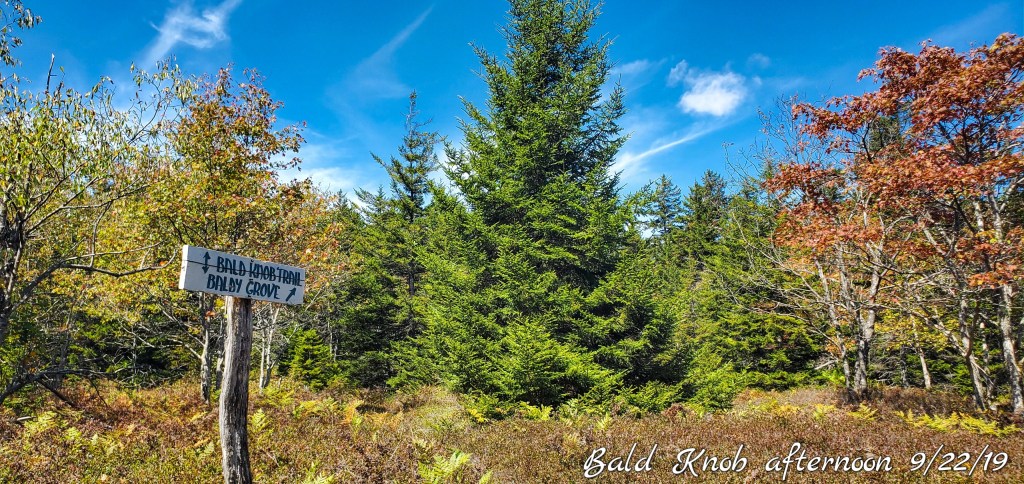
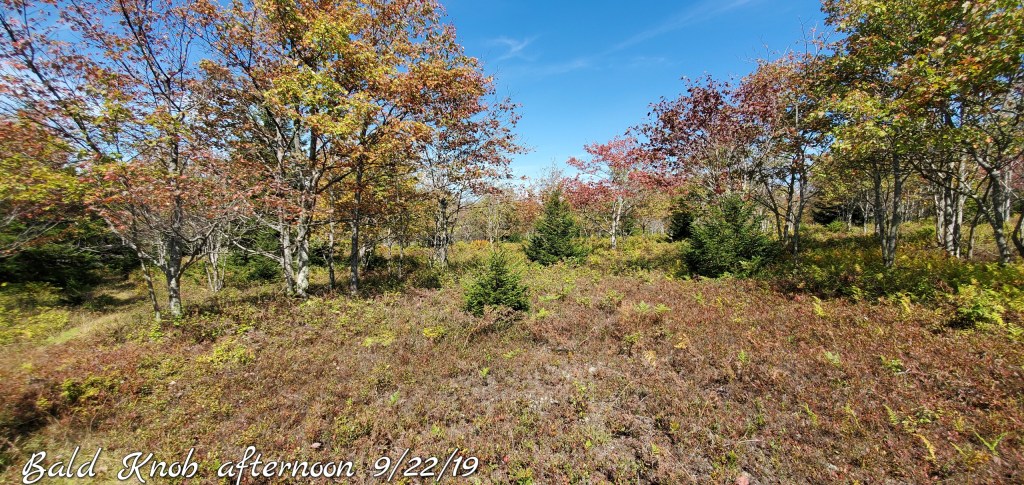
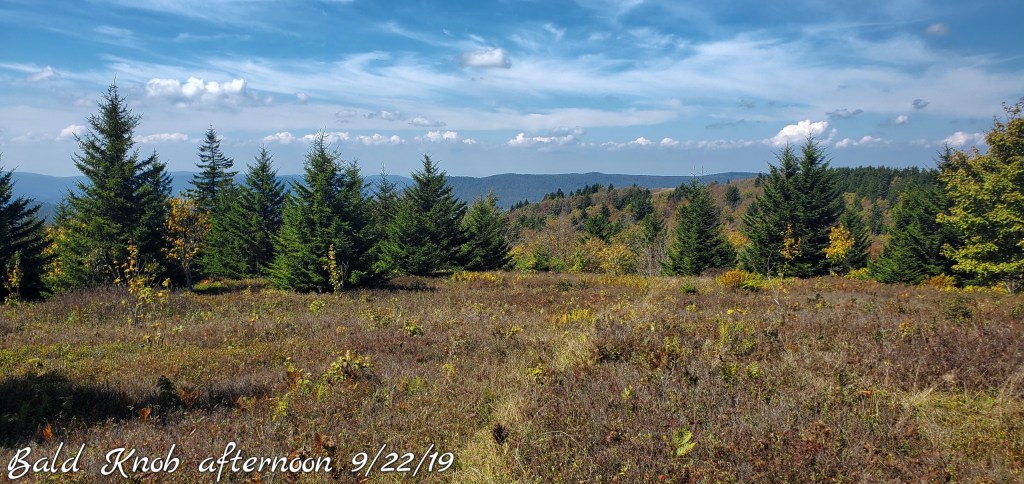
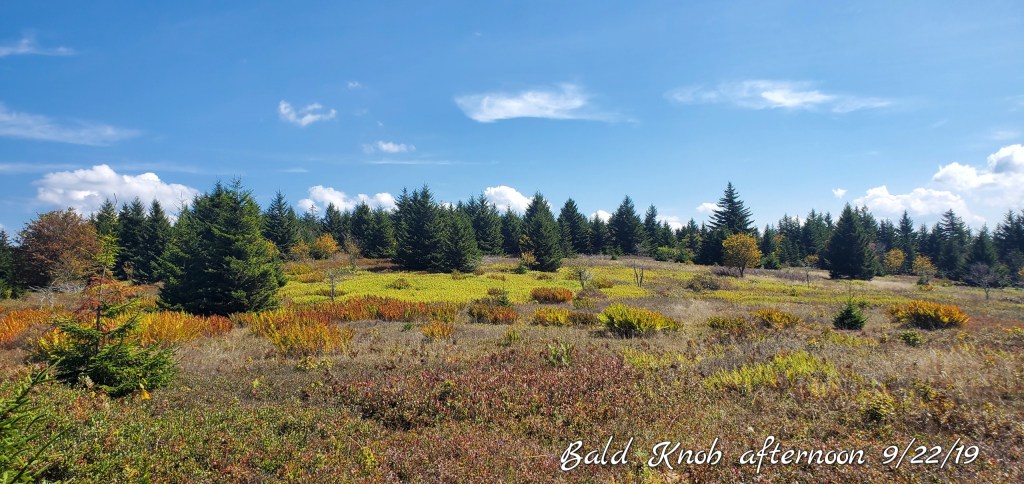
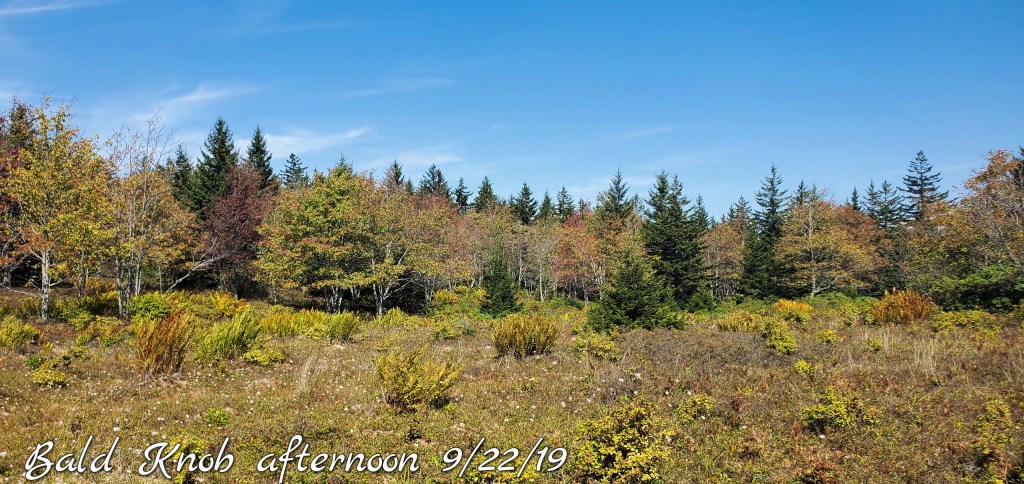
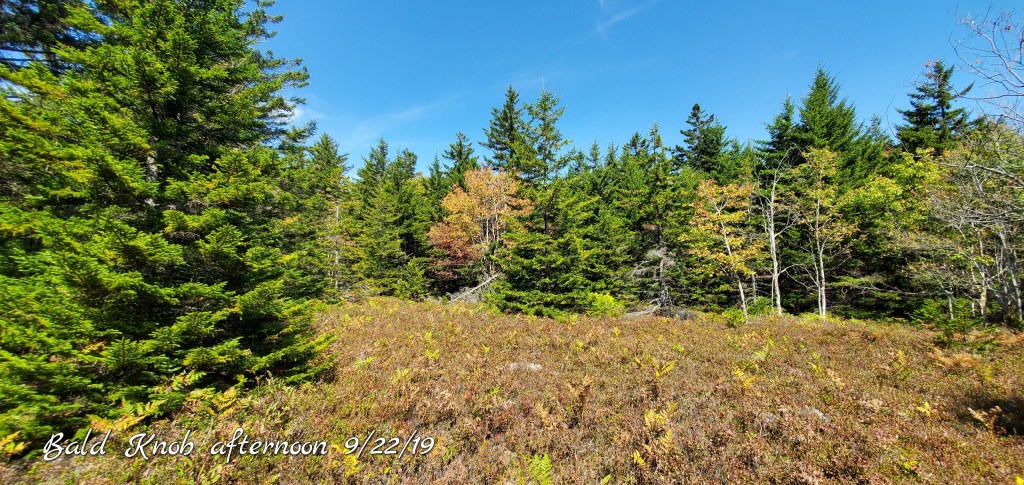
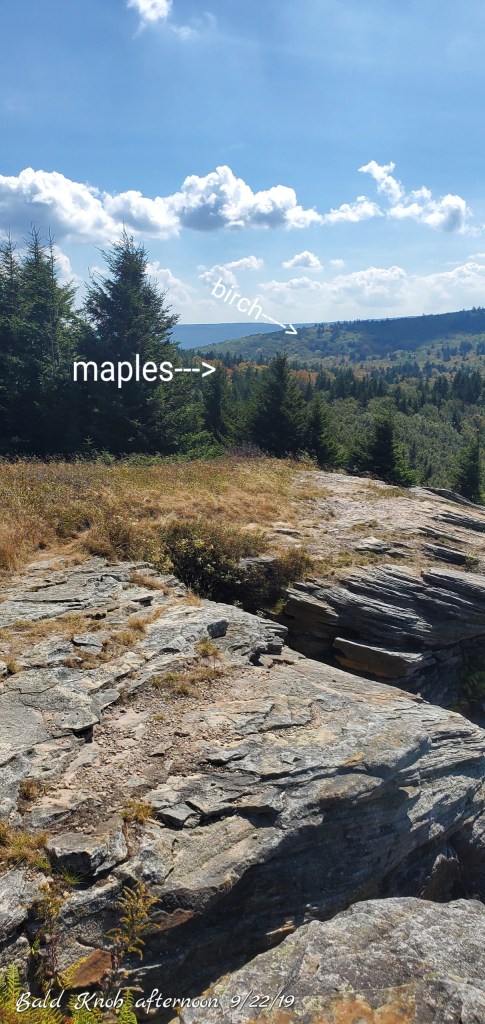
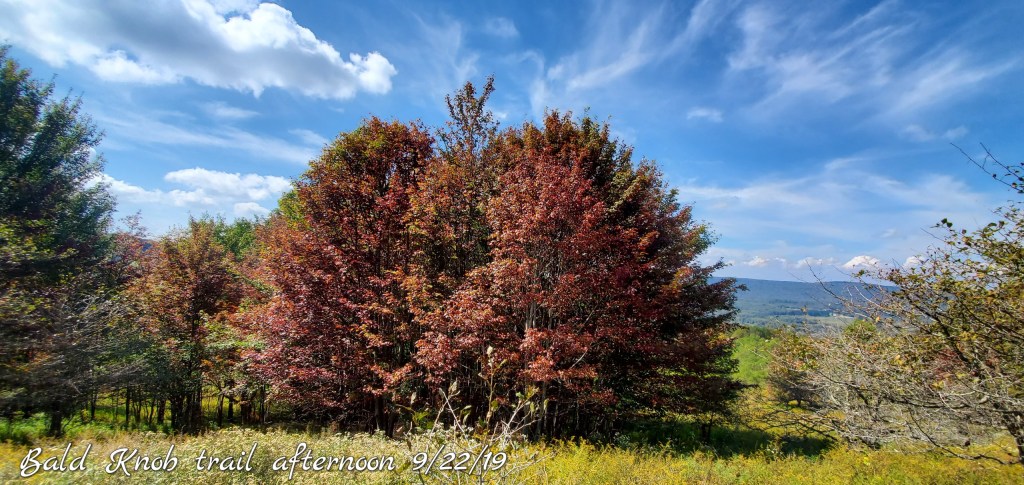
The Valley up to Bald Knob ..
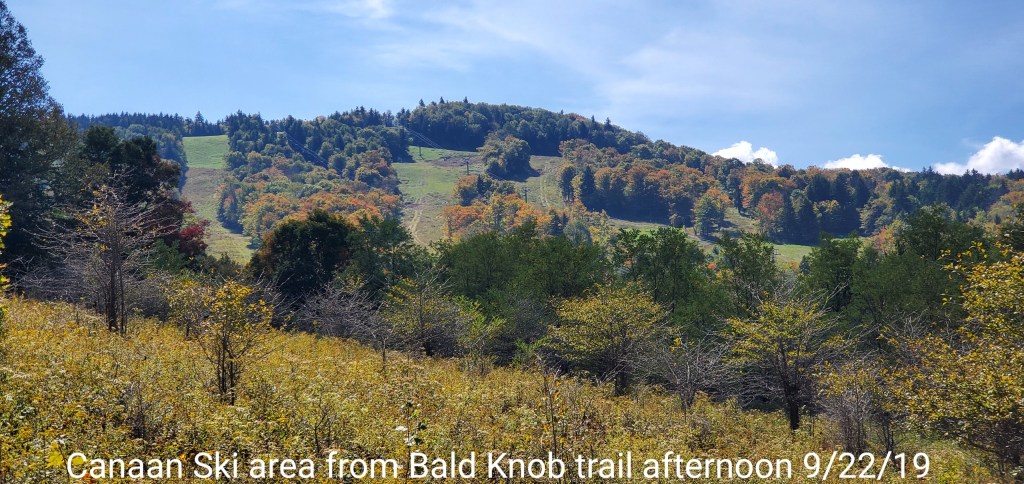
This area goes 3200- 4350 with a look towards Weiss at 4450. Baldy more colorful than Weiss? Yes. Baldy is primarily smaller maples. That northwest slope,,less colorful lots of birch, same story for west slope of Weiss up high…more maples lower, and the ski slopes are getting some color on those as the lower west sides of Cabin. It’s not terribly off on timing. In 2017, that year began with a cold beginning of September, aided for a quick color change up high, while down lower, excluding maples lagged. This year is 10 days +/- behind that year, but ahead of last year that featured lots of cloud cover, rain(which led to anthracnose ruining alot of maple color) and cloud cover equals mild nights
That’s one aspect of this warm pattern. It’s been dominated by high pressure with the big ridge over the east…lots of dry air which heats up faster, cools down at night faster as well. You do not get that under a wet pattern.
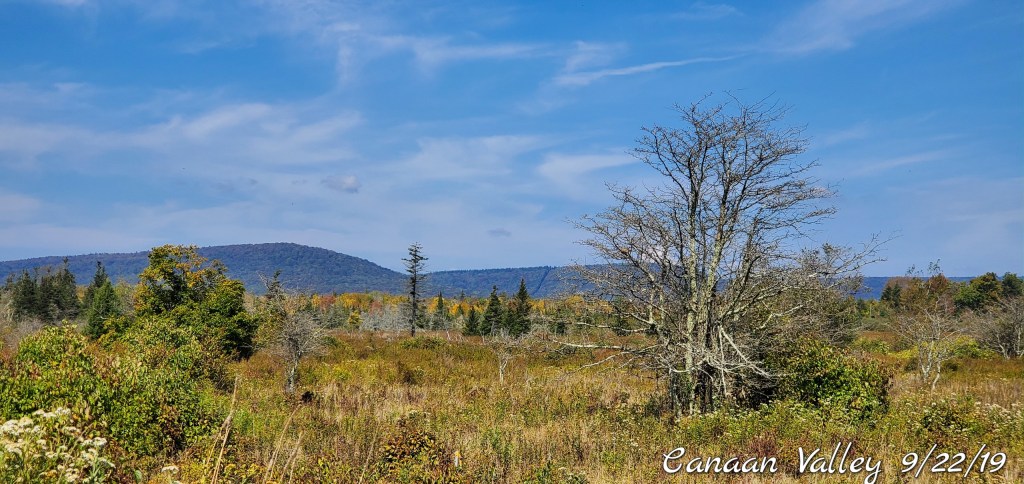
That said maples are changing along lower west side of Cabin and the mature birch is not doing much yet. Atop Cabin Mt on Bald Knob, primarily small maples. Small maples, dry conditions, bam…this area is at peak color and as I write this(a day after these pics were taken) those colors are likely dropping with this wind today, and some rain.


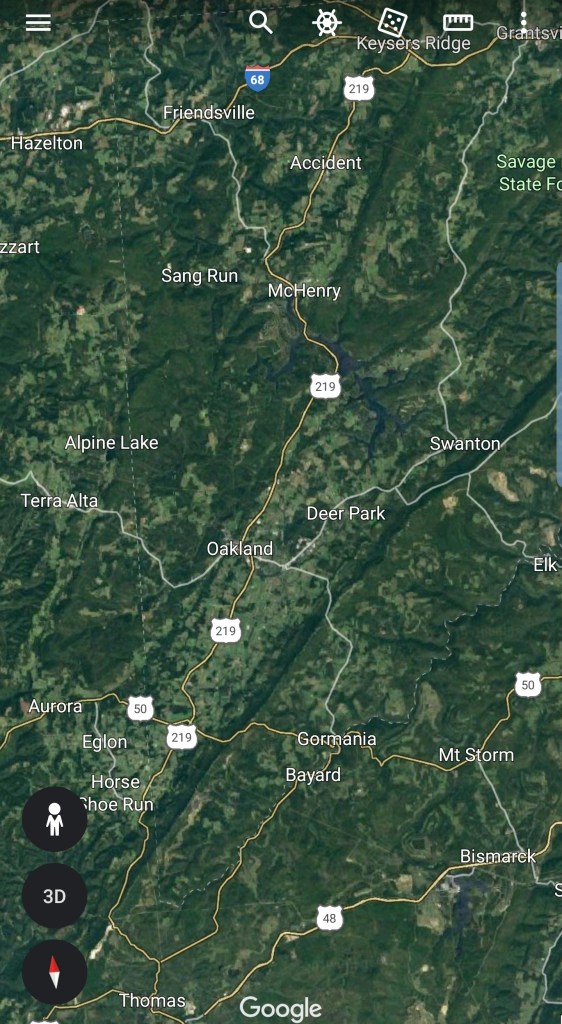
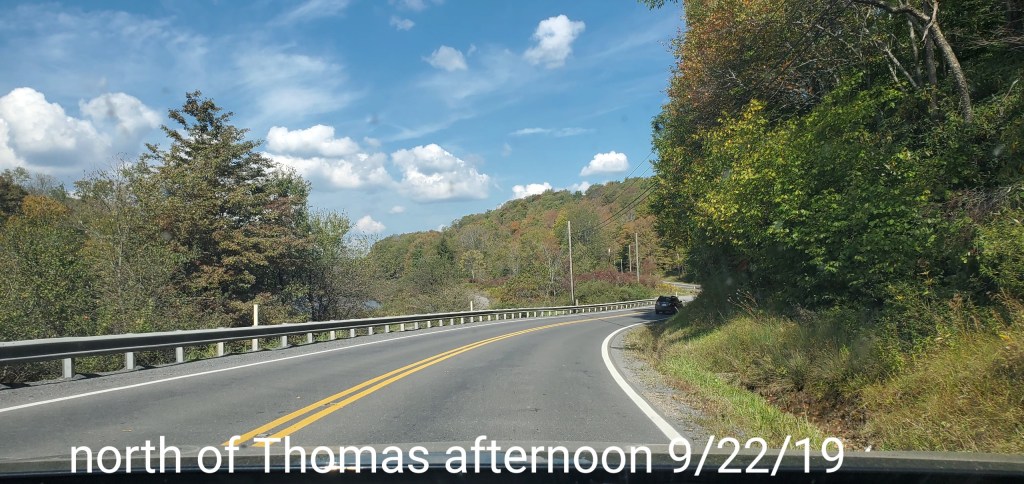
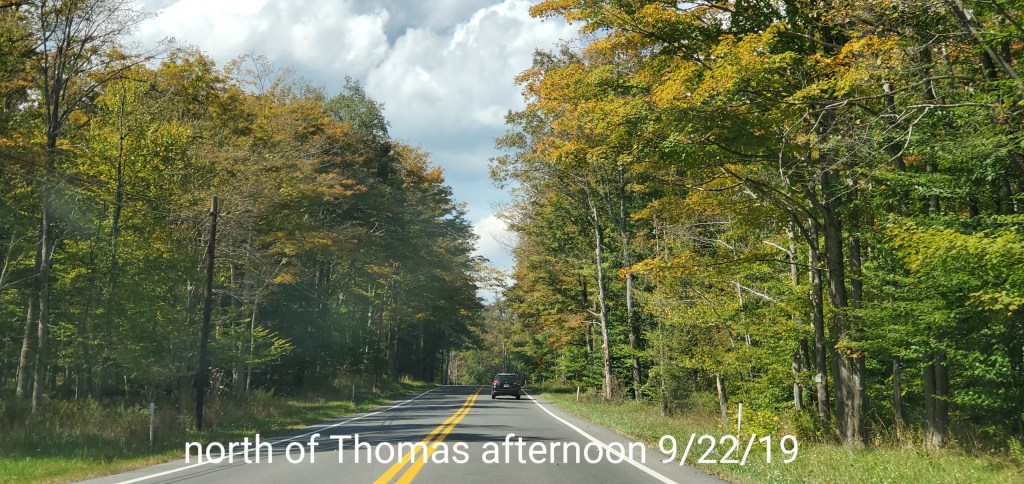
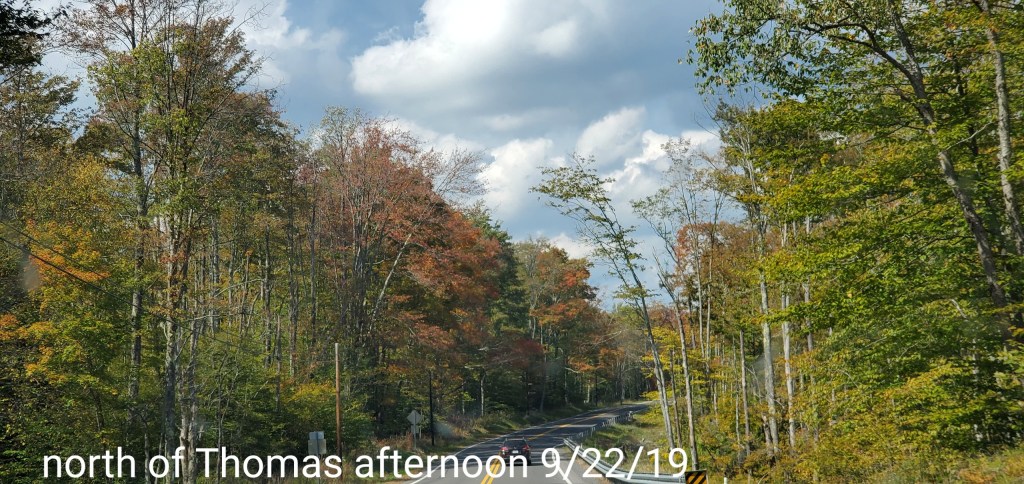
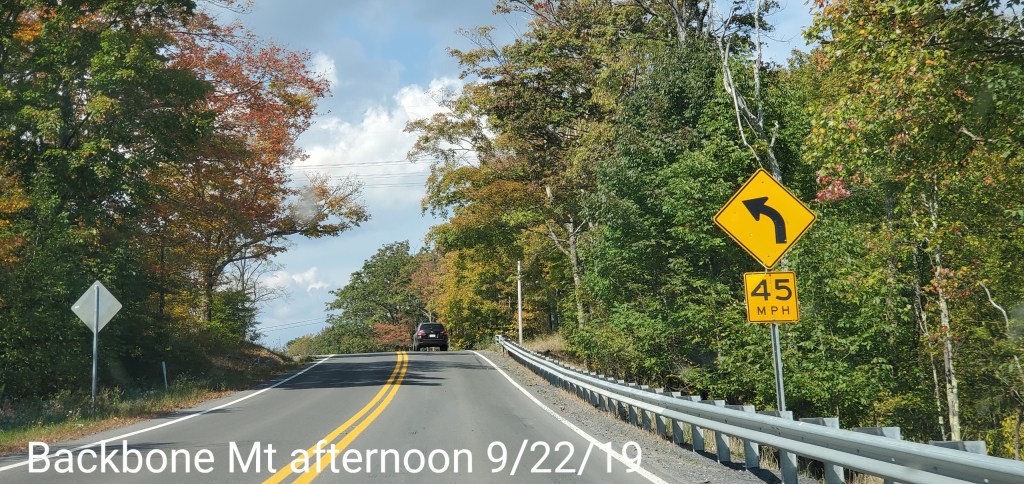
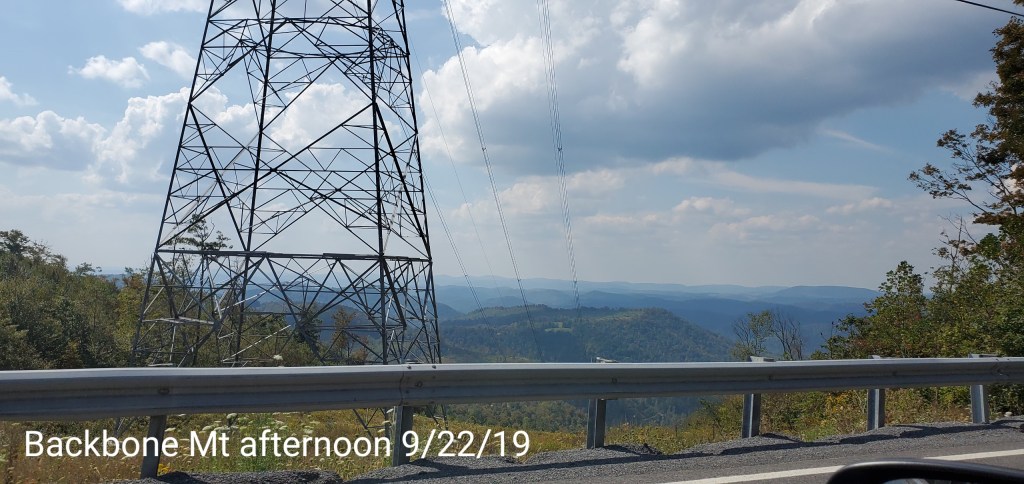
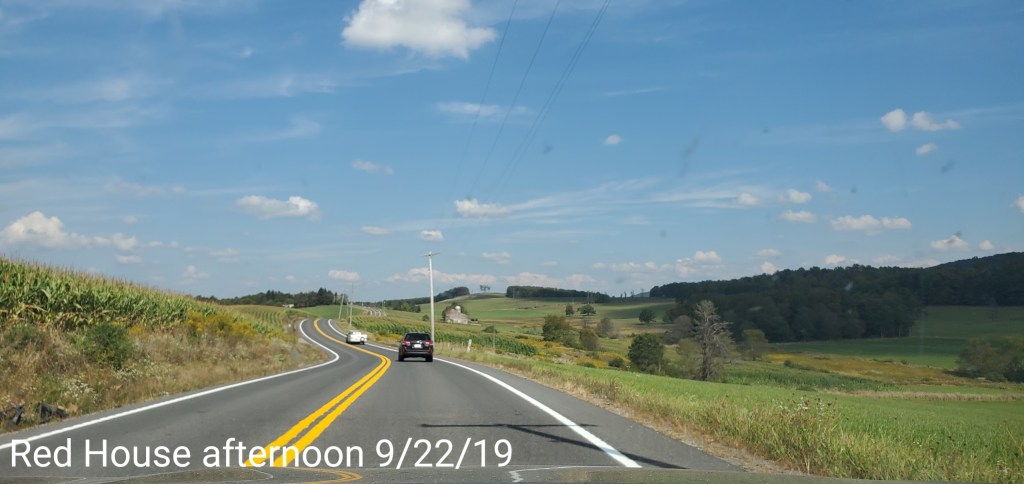
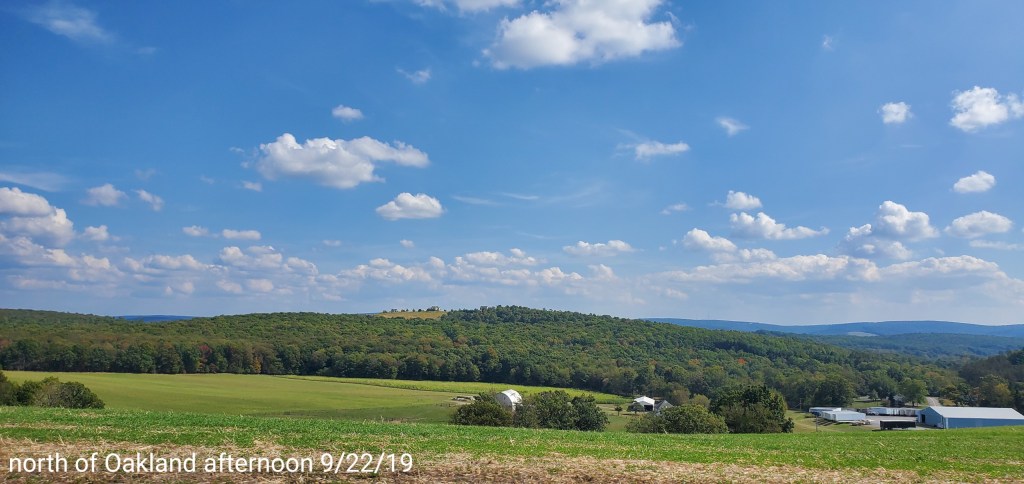
North from Tucker to Garrett County.
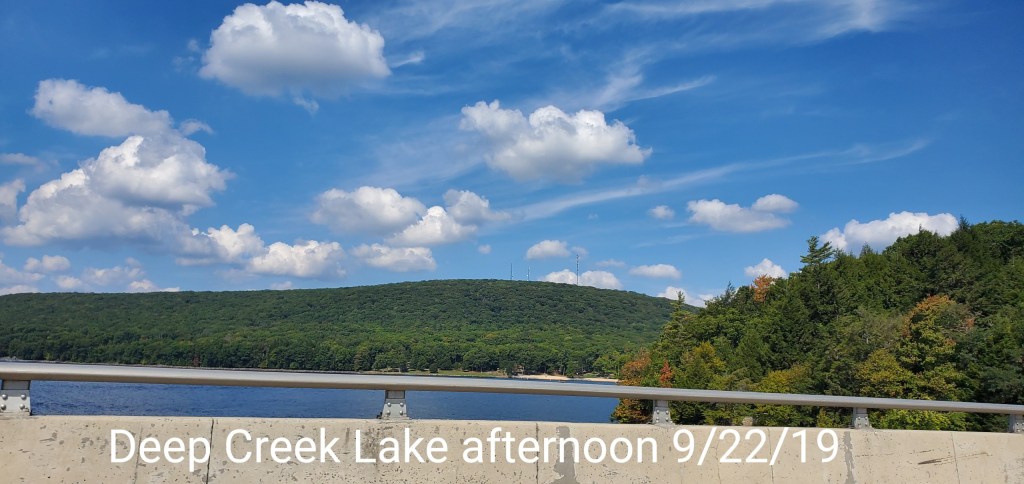
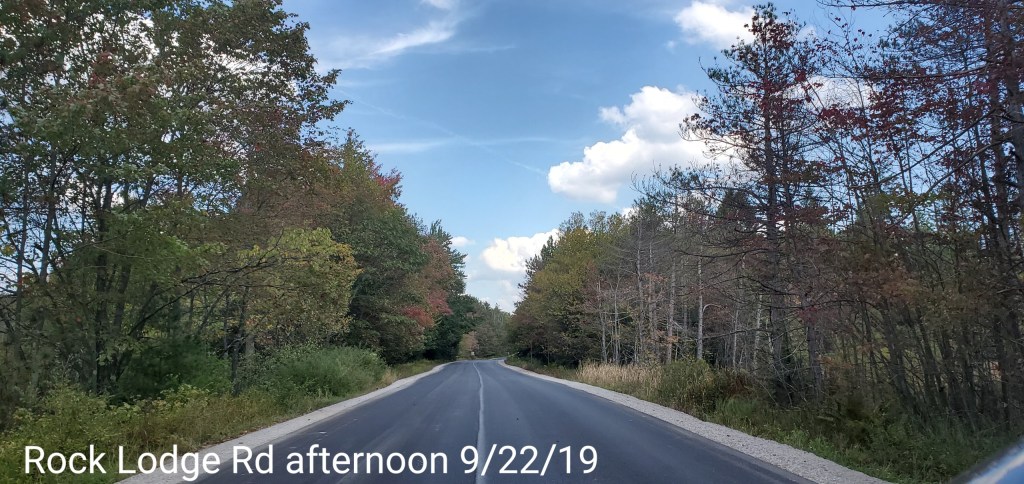
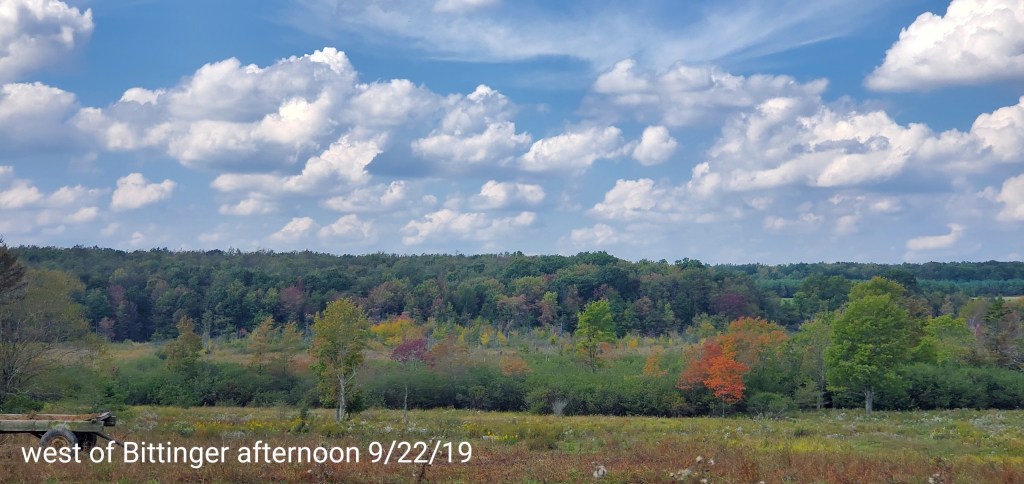
From Thomas in north to Backbone, again lots of maples, some decent color and lots on the verge .However the decent down the west side of Backbone the primary tree type turns to Oak. Oak , both red and white change color much later. Well into October and some hold on through the month. A big snow often causes them to collect early snow and break, despite being a strong wood. So, from the west slope of Backbone up to Deep Creek, aside the cooler Valley patches that have some maples, that do have color, there us not much color otherwise. From Deep Creek to the Bittinger area, maples again come back in play and again, much like elsewhere, some are on the verge or changing, and some have. There is section along Rock Lodge Rd where Cherry creek returns to view and begins its descent to Deep Creek that has maples that typically begin to turn in August and some of those are losing leaves. Not a big area, but I’ve posted that location lots on this page. The area from that location north to Bittinger and along the Cassleman River north, increases in maples, increases in what color is out there .
Elevation through this stretch in general 2400-3300

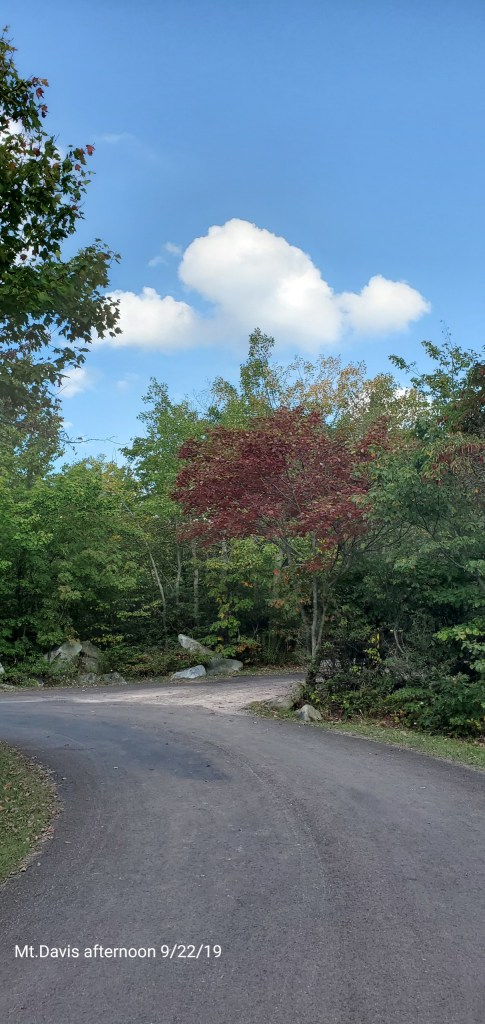
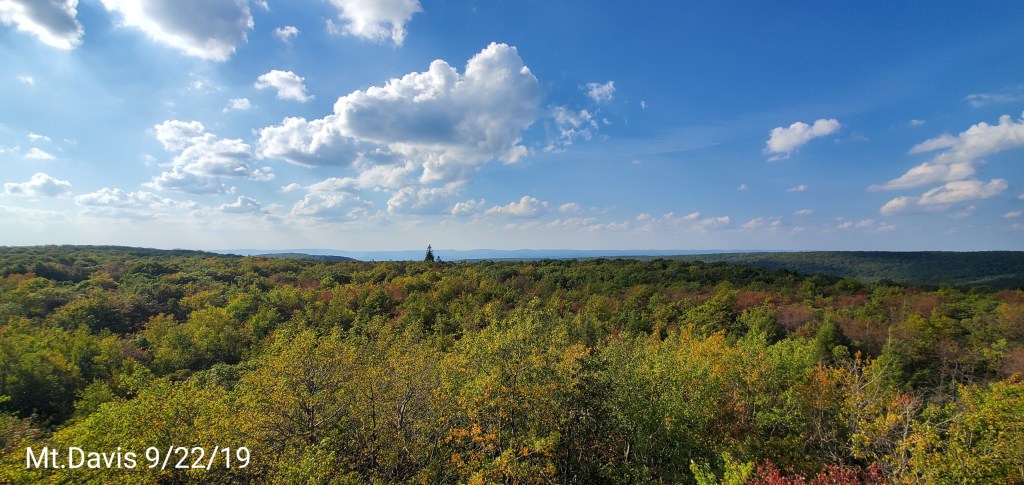
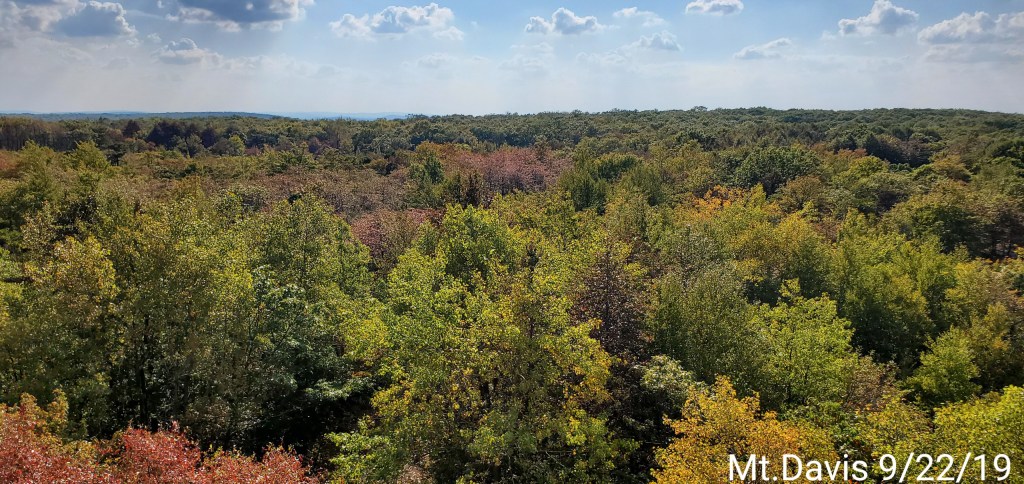
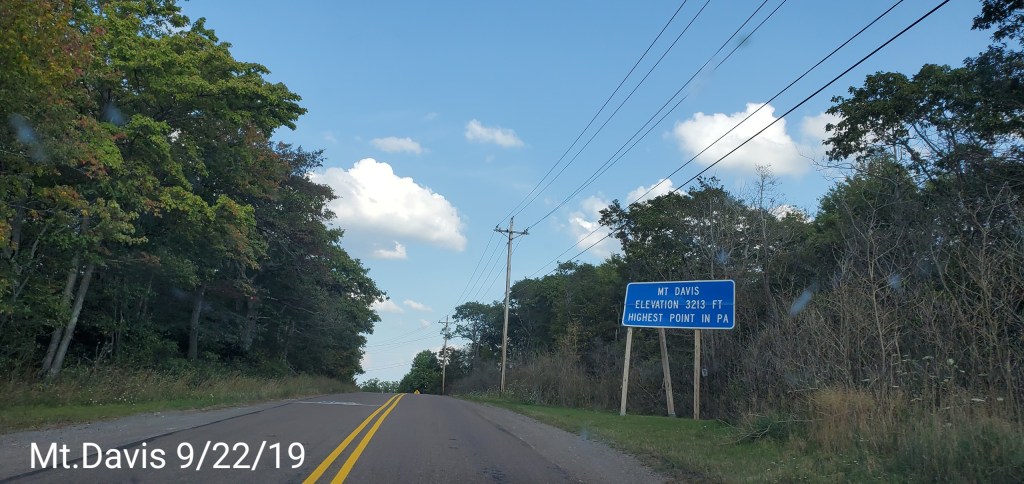
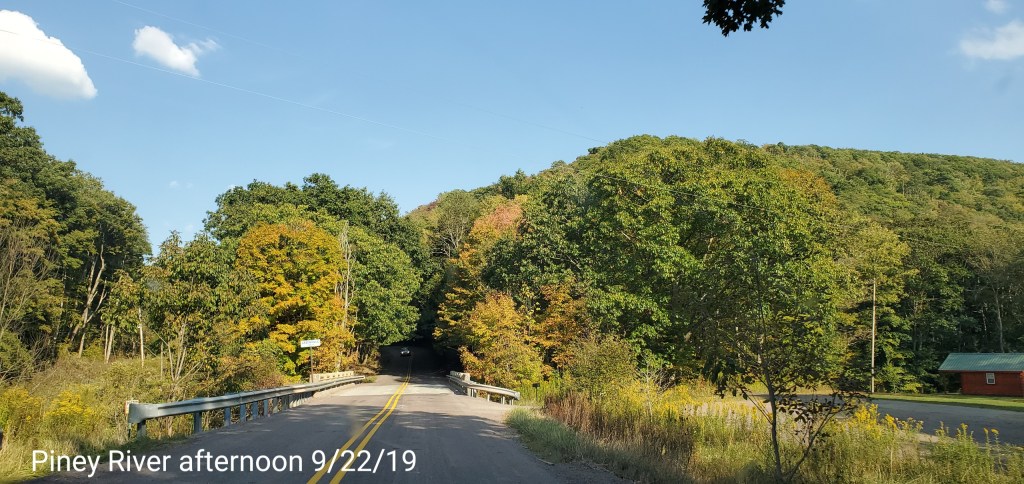
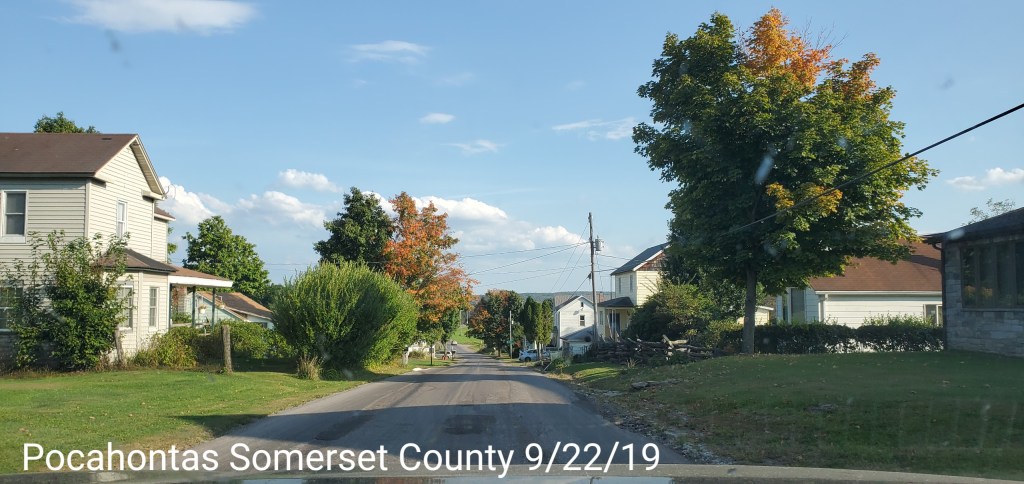
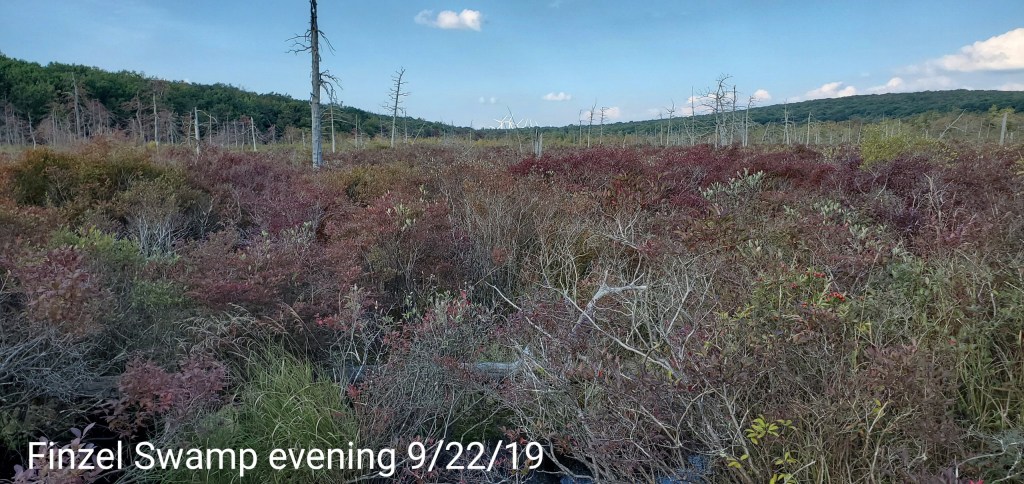
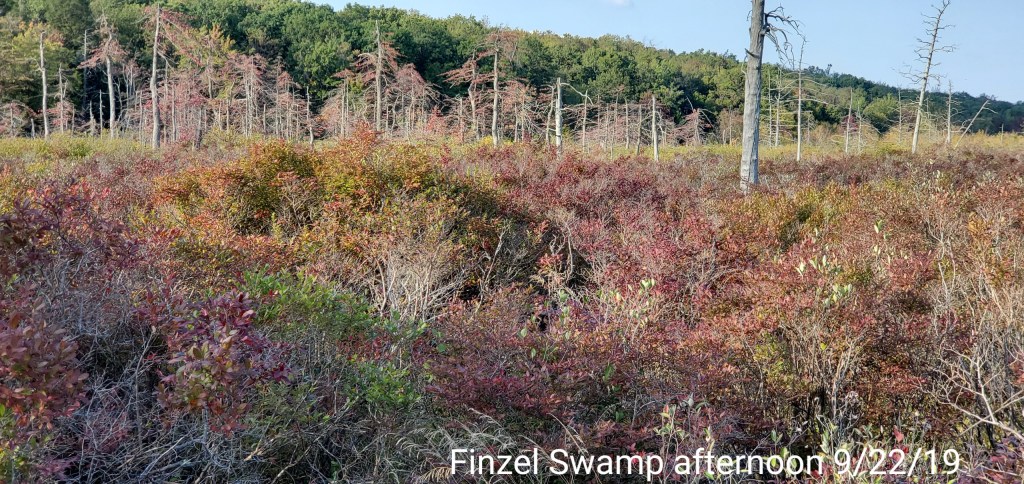
Somerset County Pa, Mt. Davis to Finzel Swamp
A good mix of maples, oaks etc gives a spotty color theme. Some gum trees help with adding some spotty reds in locations they exist. Not an abundance by any stretch. The Finzel swamp health, has passed its peak, the surrounding slopes, are yet low on color. A tad behind, but not alarming.
Elevations through this area- 1980′ along the Cassleman near Salisbury to 3213′ at Mt. Davis, with the Finzel Swamp just shy of 2700′..


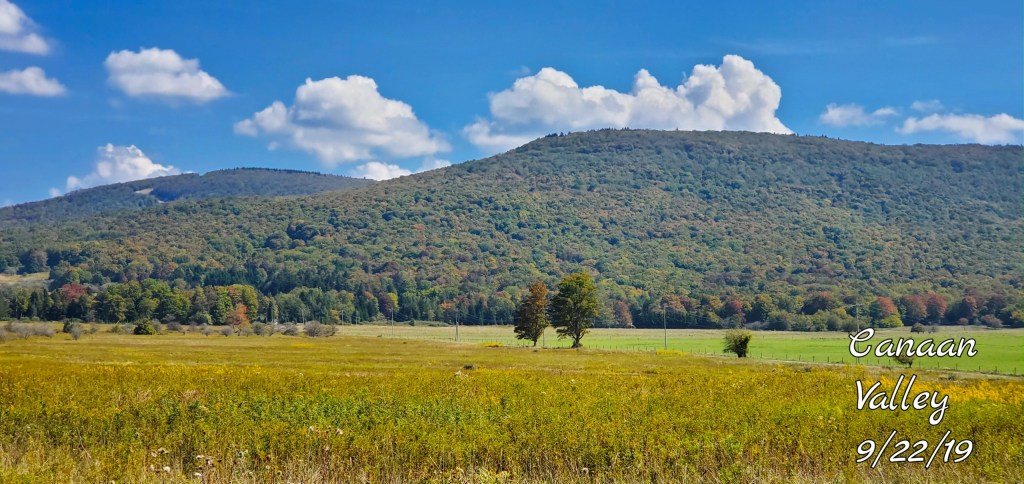
A Canaan yearly comparison….
2017,2018,2019


extras
The dry panic……. yes its dry, but
It’s been a very warm, and dry September. Water levels are very low Not RECORD low precip or record warmth. It seems when its dry, word is “I’ve never seen it this dry”. In reality, who looks at the data at hand. Some folks look up averages. Averages are nothing more than a group of extremes divided by the number of extremes. Some folks refer to averages as “normals”.
Let me ask you, say the average high today is 70°, and say you have recorded data for 50 Septembers. You may say to yourself, it should be 70° today, that would be normal, I googled it for my area. However, on this date, there may never been one September 22nd with a temp reading of 70° max. So, how would it be “normal” if it’s never occured. That’s why averages are only a blend of extremes.
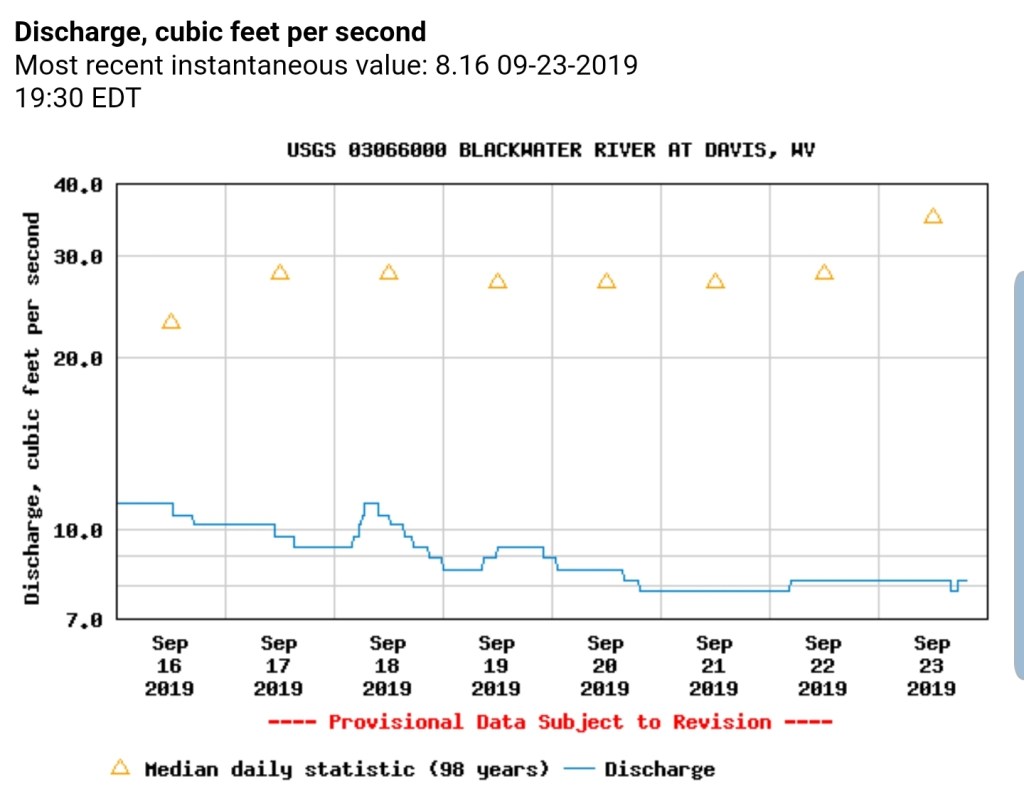
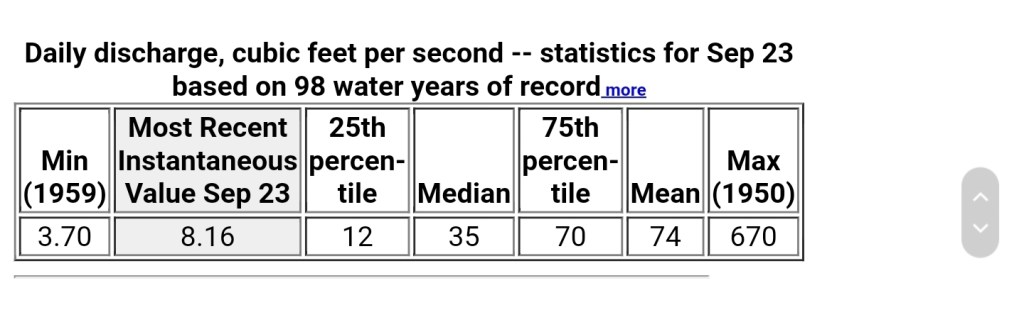
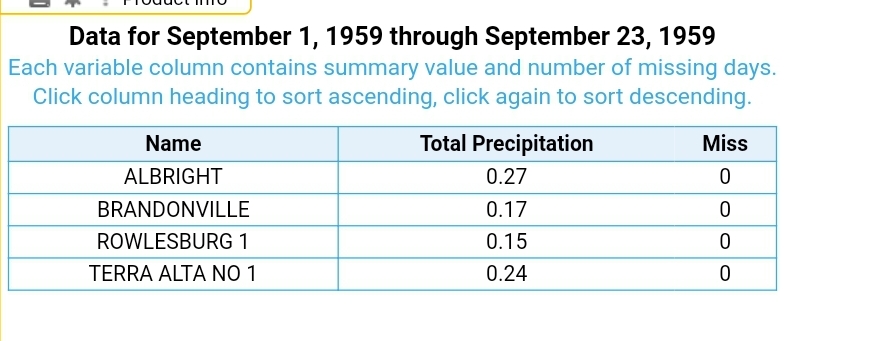
That said, many areas coming in with very low rainfall totals this month. More extreme in the Wv Alleghenies. However, its NOT unheard of or “never happened before”. Looking at the available data for the Blackwater River from the USGS site this month. Record min flow for the date 1959, 1959 day after day. Through the 23rd of the month in 1959, Canaan Valley had recorded 0.0″ of rain. Stoney River Dam(Used to report observations) reported .2. Both locations big contributors to the Blackwater. This year Canaan reporting .45 nearby Davis 3SE on Canaan Heights at .62, just west of Stony River Dam(former site) is a Cabin Mt station with near .2 precip, that west of the station feeds the Blackwater.
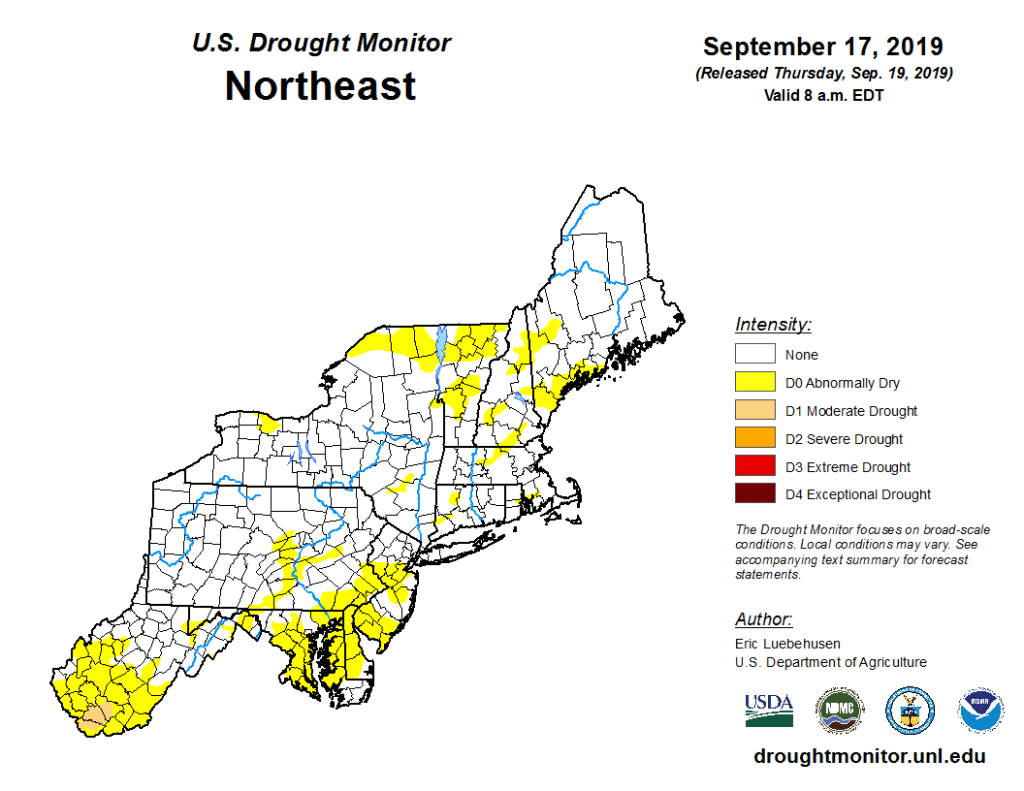
The past month, 4-6 weeks has brought yearly rainfall totals to near normal in the area as a whole with some spots just above, some just below. Enough so, some abnormally dry conditions are being monitored. This image released on 9/19
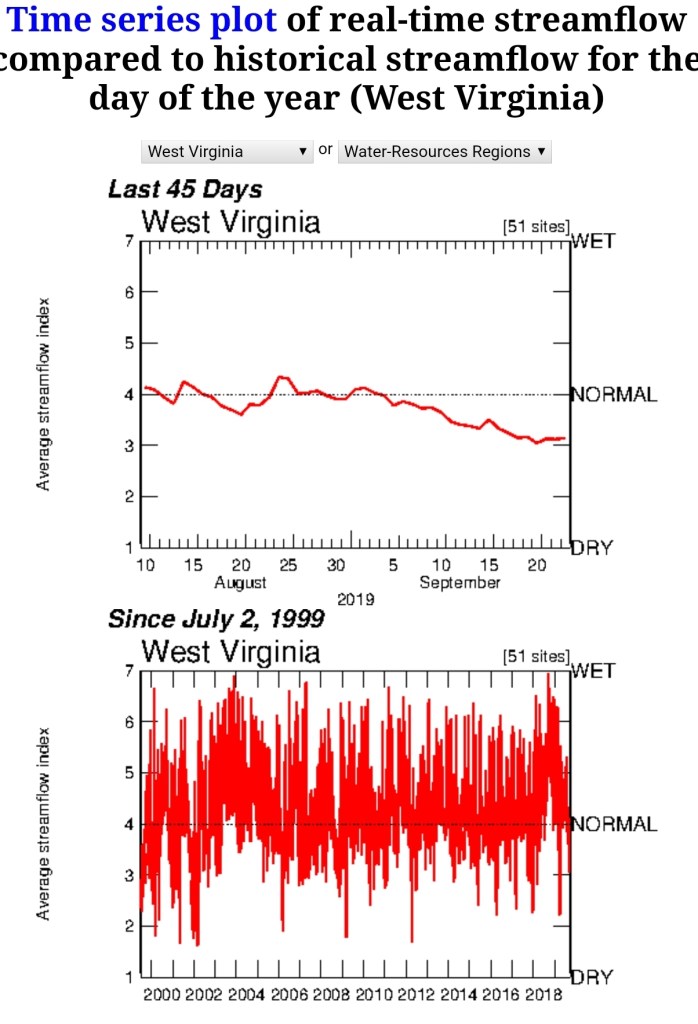
Stream flow is low and Wv as a whole below normal. For the last 20 years, trend is steady of ebs n flows

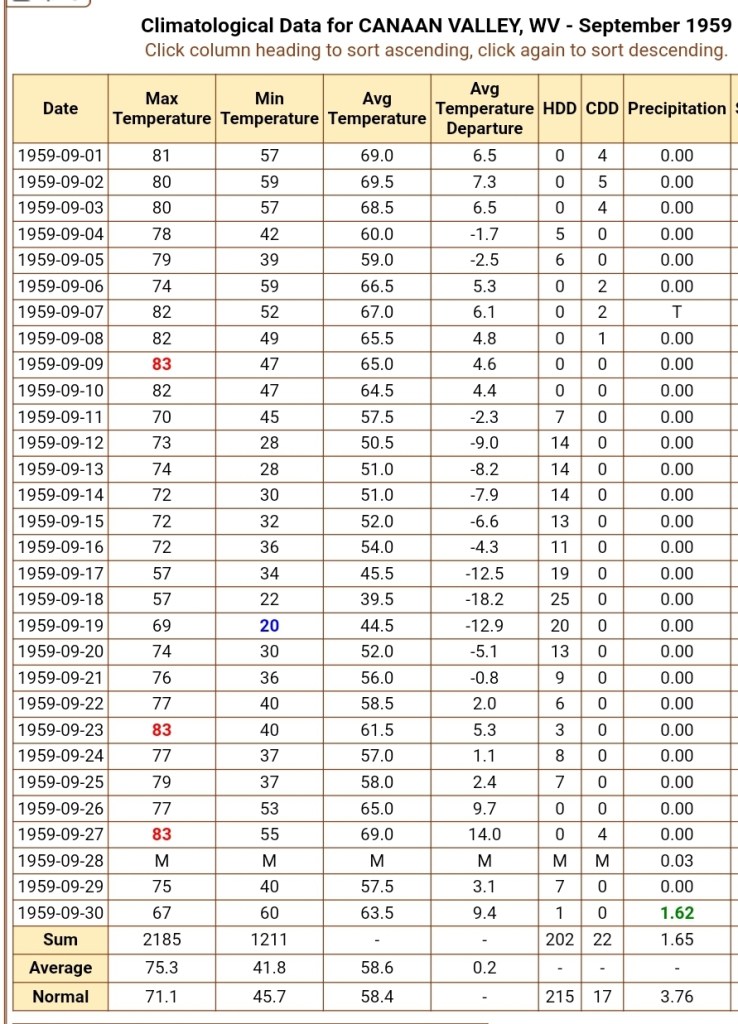
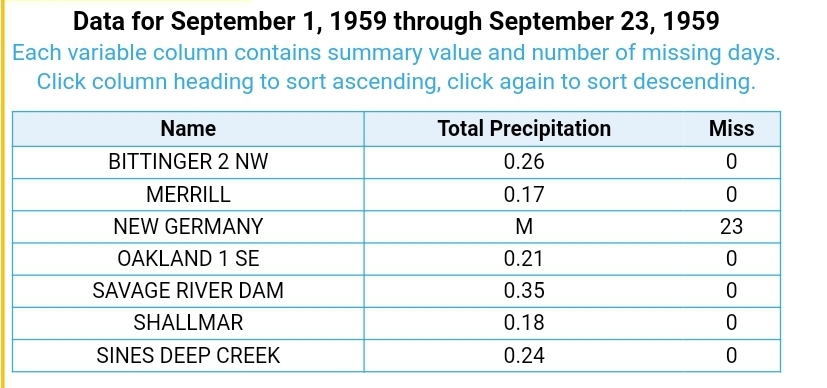
Historically, back to 1959. The year Canaan was at 0.00 through the 23rd. Which all area stations did finally get some appreciable rain late month with the remnants of hurricane Gracie pushing north. The heaviest of which stayed in the Shenandoah.
Canaan data for Sept 1959, along with current data from the Blackwater gauge in Davis and the low flow for the date. Its low now, but well over double the flow of then
Other area numbers

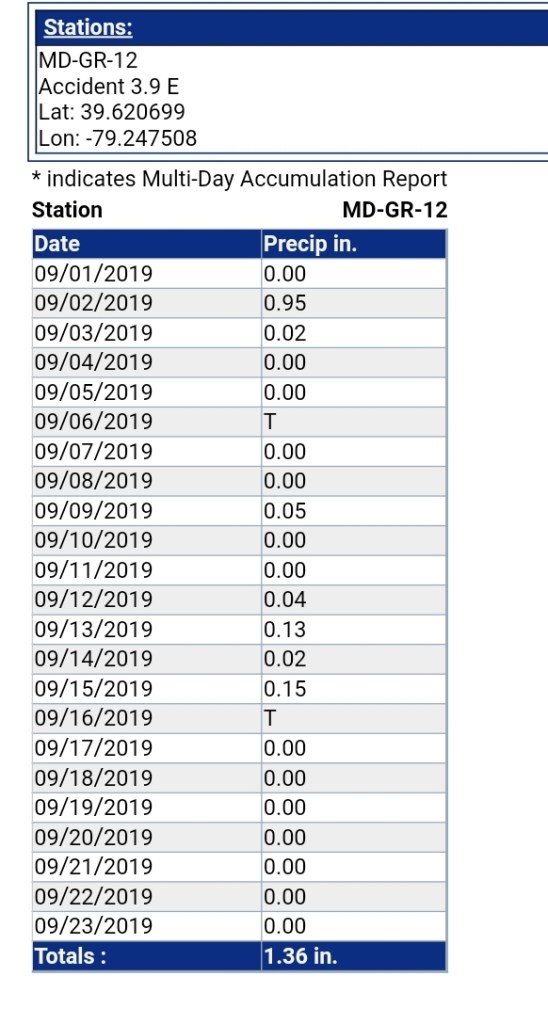
Currently Bittinger 2nw(now Accident 3.9E
Precip that month 2-4″ below normal, this month 2-4″ below normal.

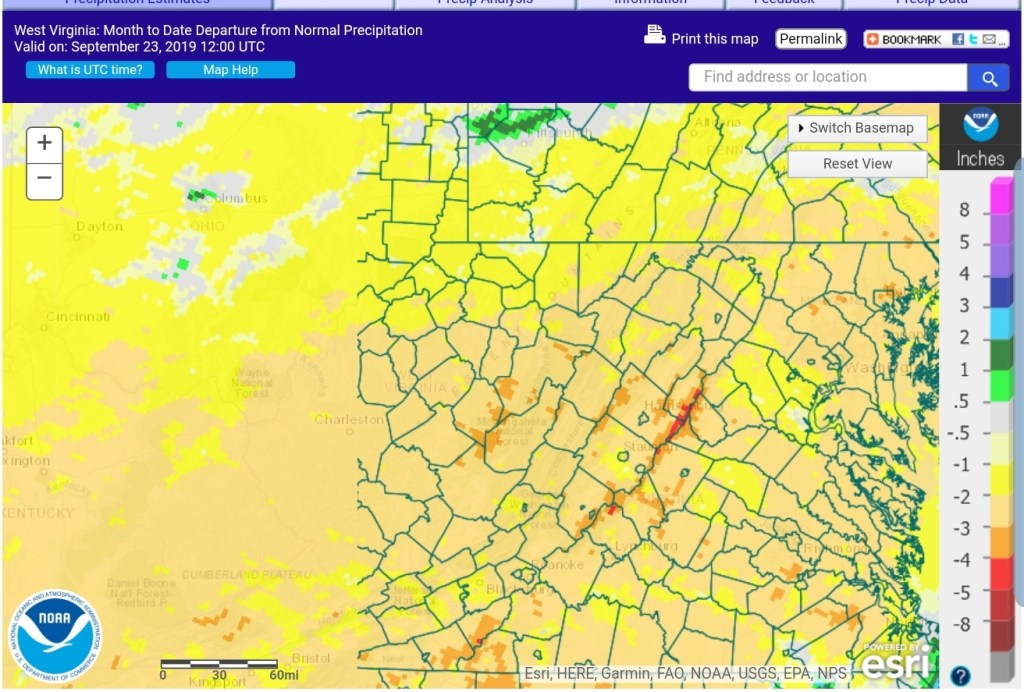
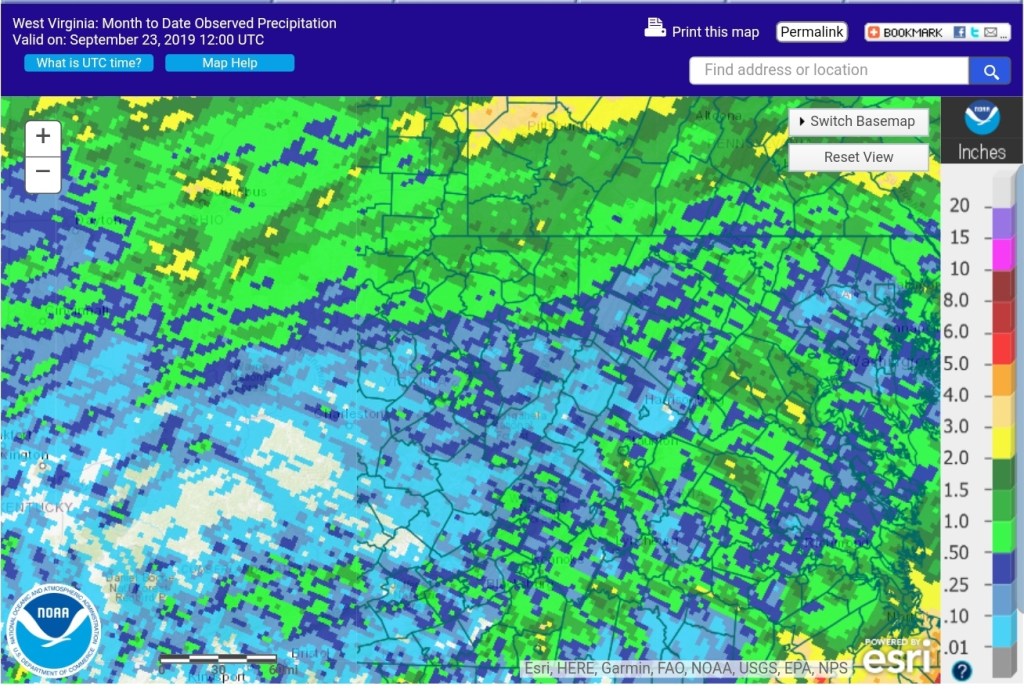
Oberseved regional precip this month
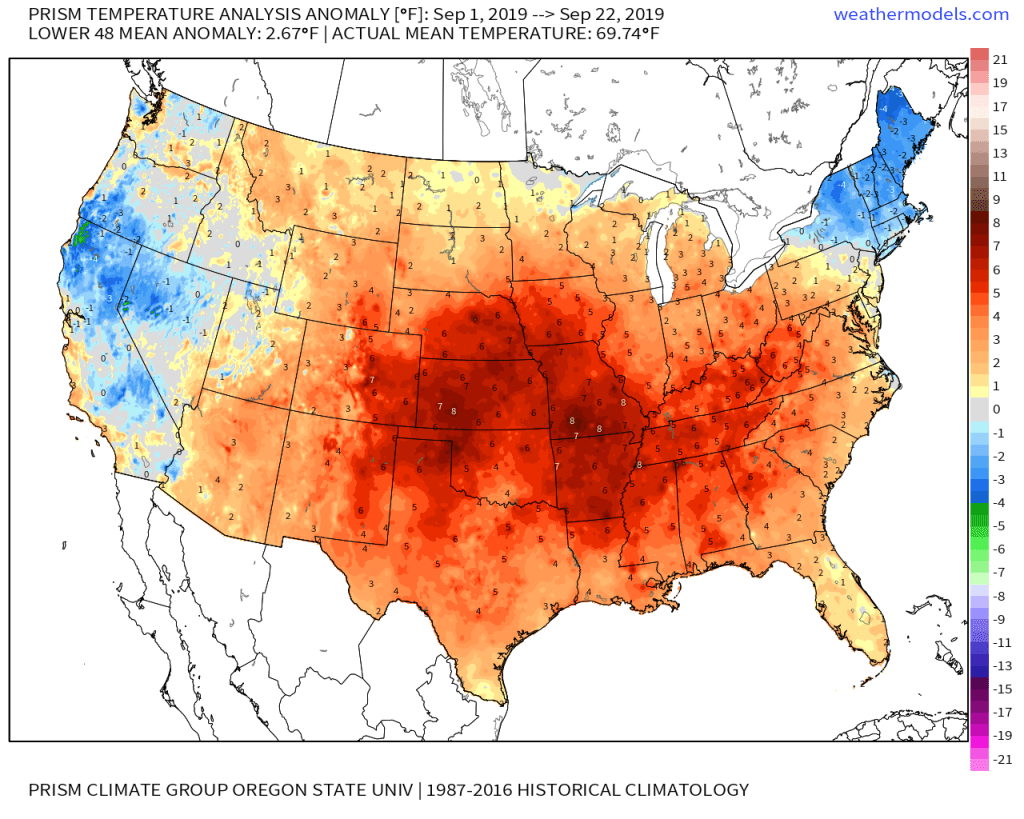
Temps this month locally, a touch under those. One thing about a big ridge, high pressure, and building warmth this time of year. One- nighttime mins are still able to drop off. The separation in averages from Valley to high ground separate. The diurnal in the valleys grow. The dry air heats and cools faster than moist air. That September as an entirety to this one through the 22nd, that year more of a trough west(we should see that area cool more before this month is out). The heat is centered west and broader this year. This year the extreme is not as extreme as that season

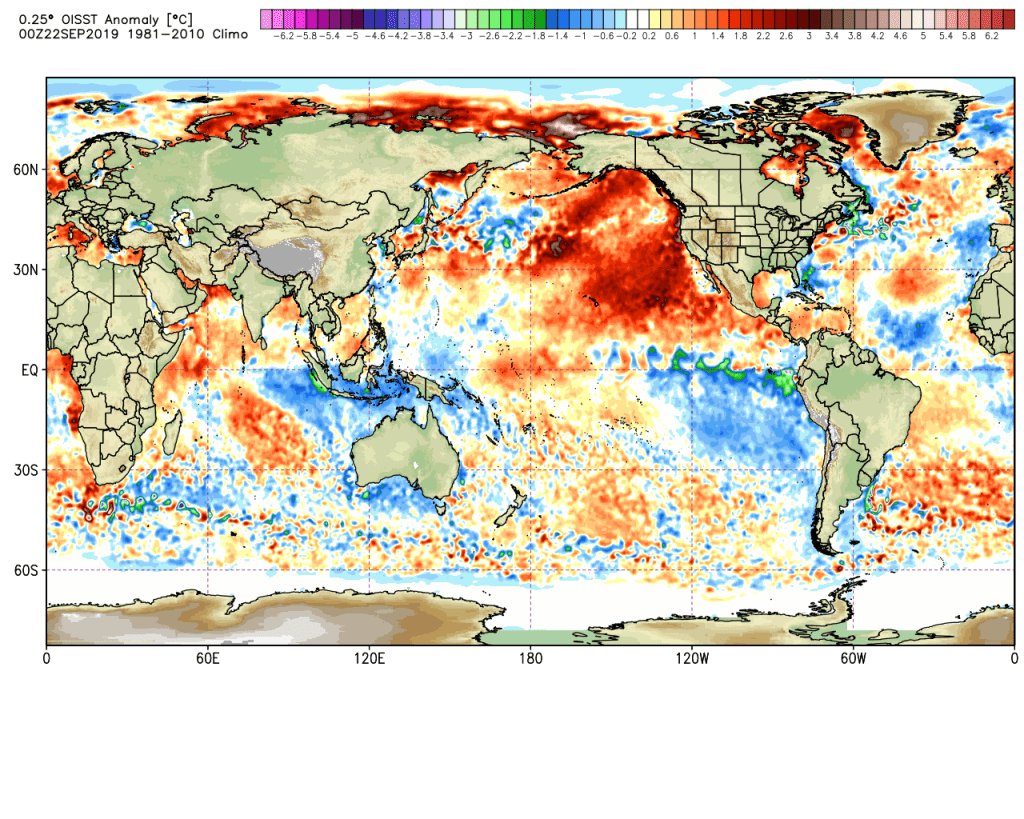
Pattern setting it up. Similarities in SST(sea surface temps) do exist. Biggest variation is the northeast Pacific. That does not allow the trough to dig as much out there . Lots of ridging east, trough digs west.

SST, color code is varied from the 2..lots of similarities, with the biggest variation south of Alaska.

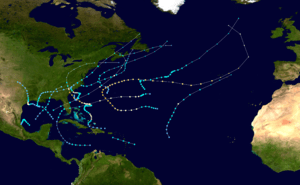
1959, 2019 hurricane season

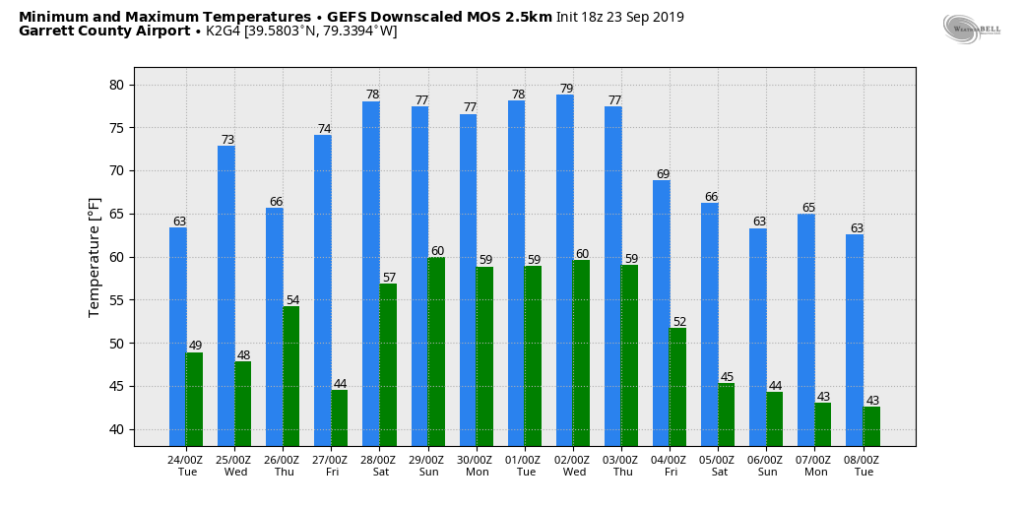
Looking ahead…….off the GFS
GFS most temp outlook. *has performed poorly in the long range*
GFS ensemble 5 day precip anomaly. Holding the drier than normal conditions in place, with hopefully some changes the first half of Oct.
