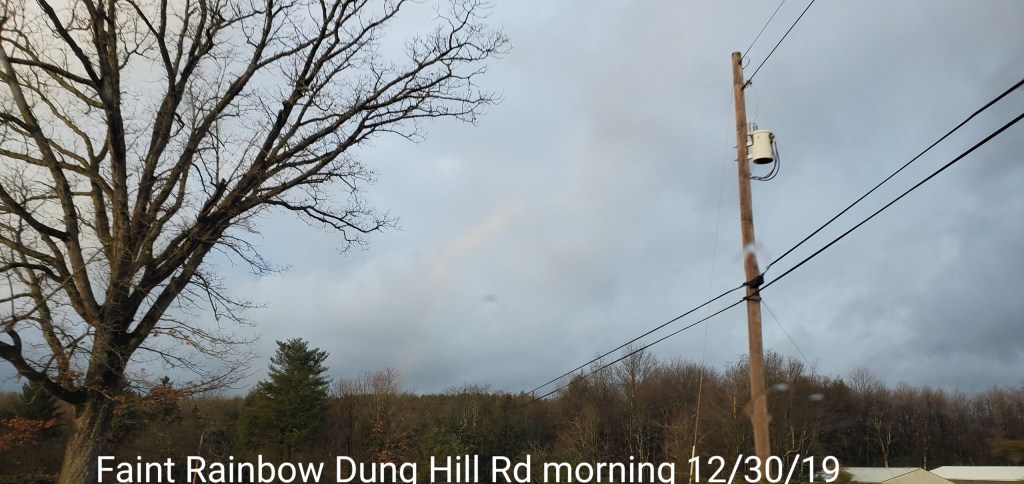
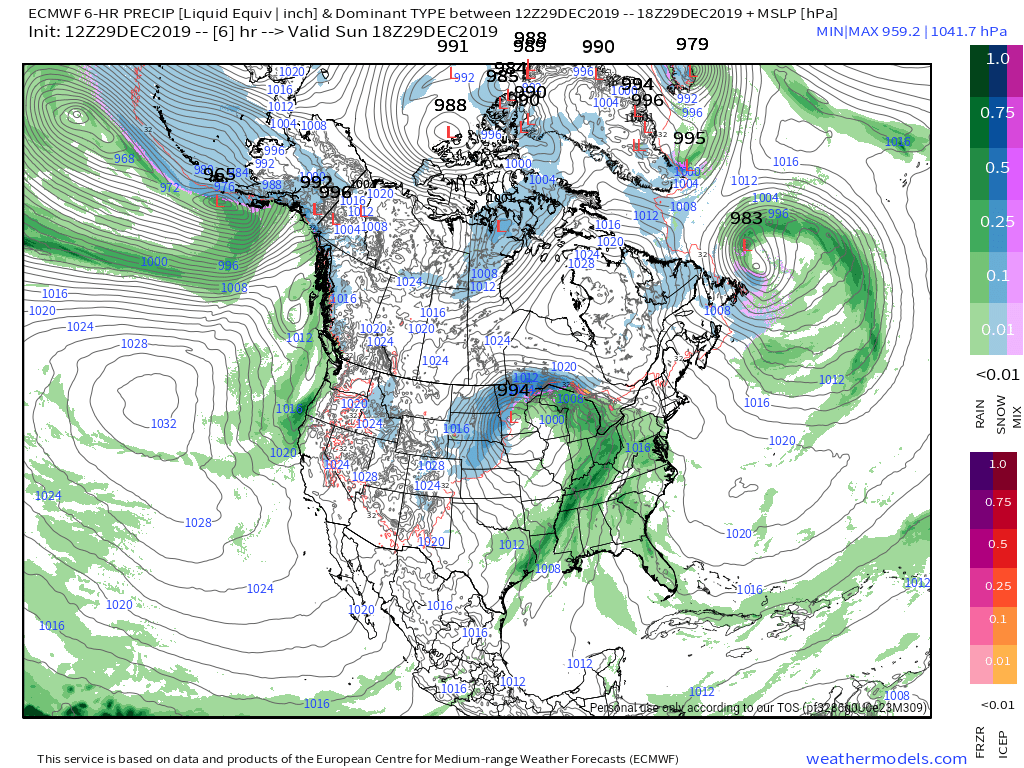
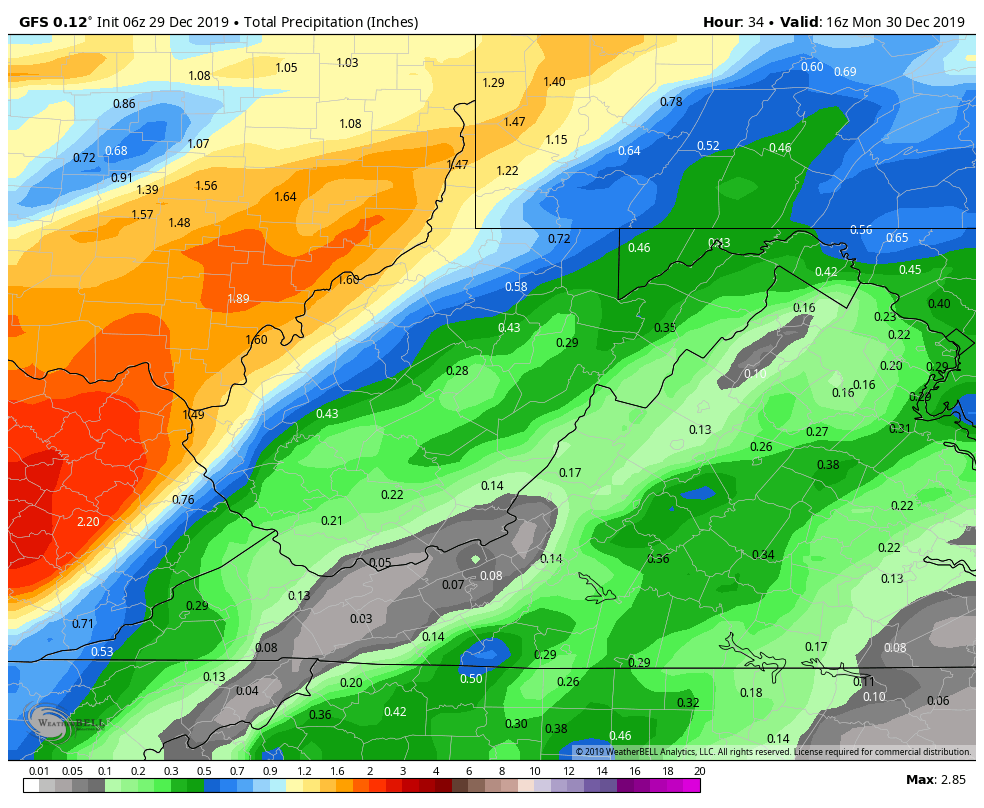
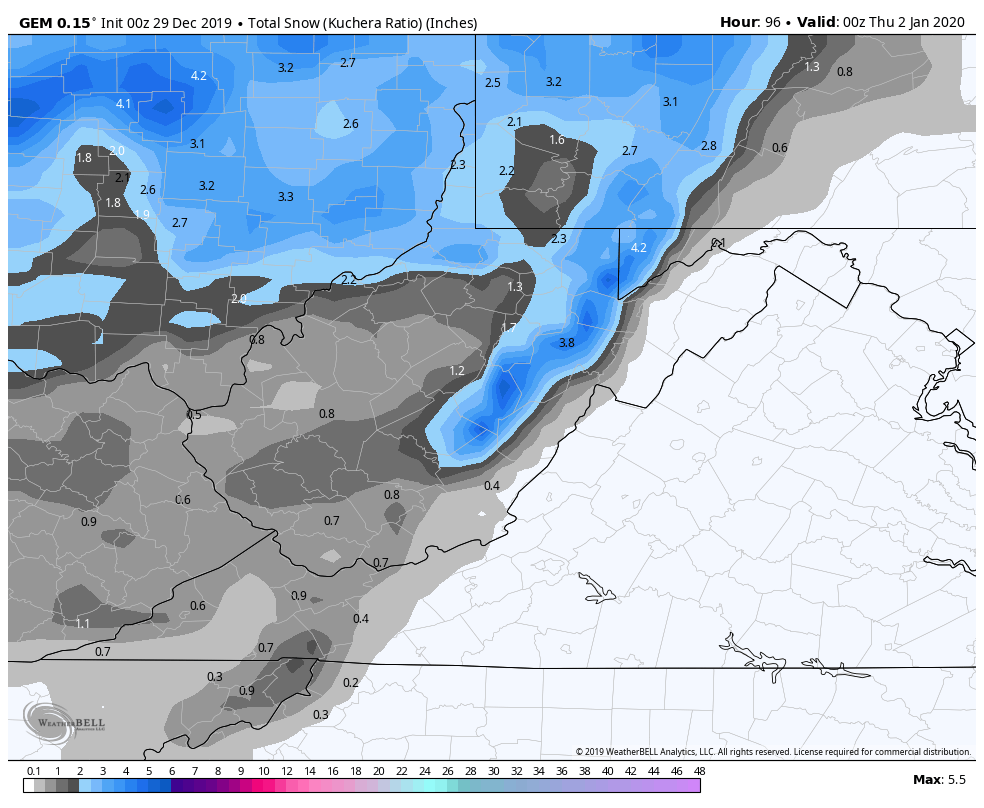
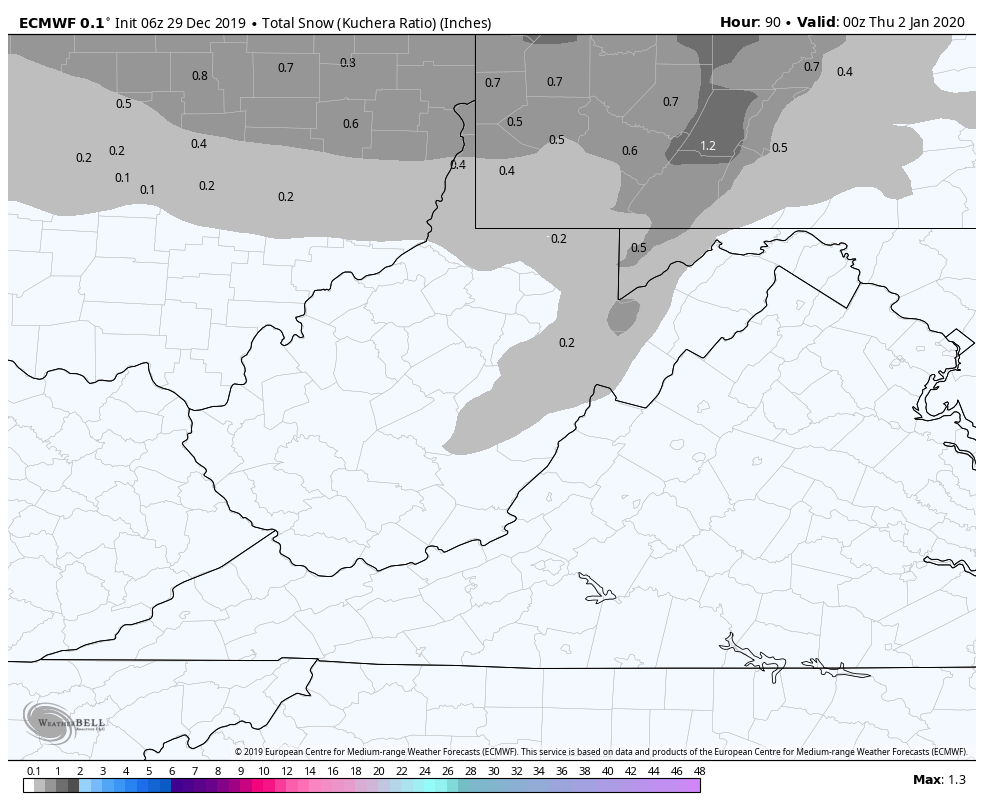
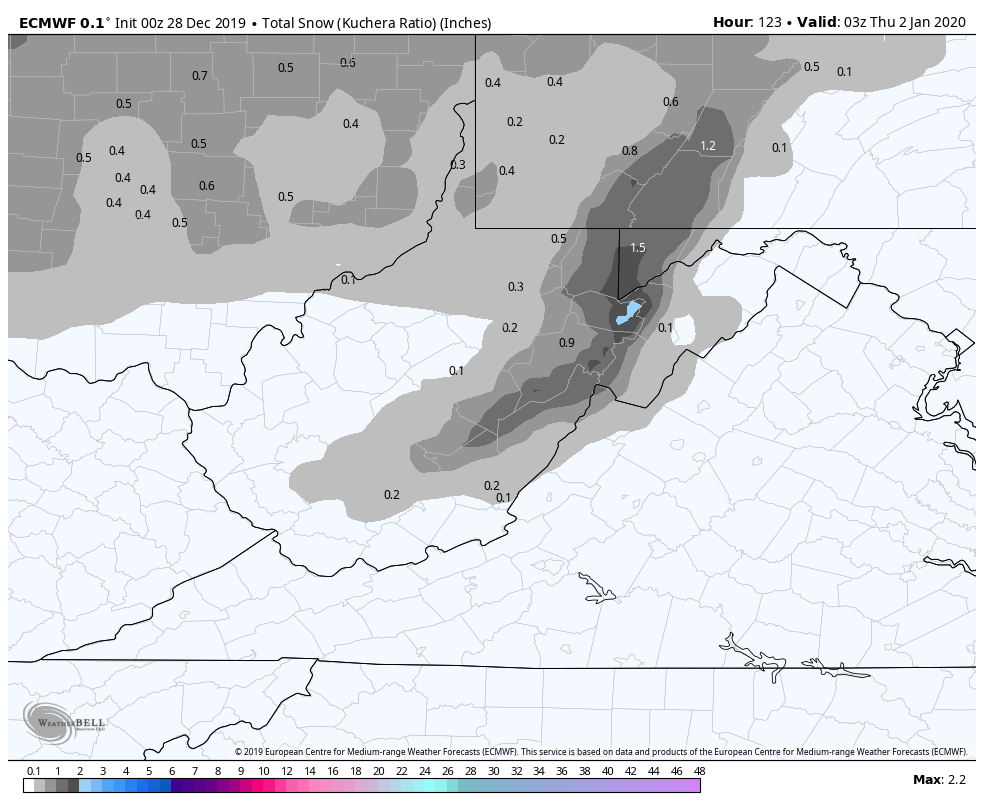
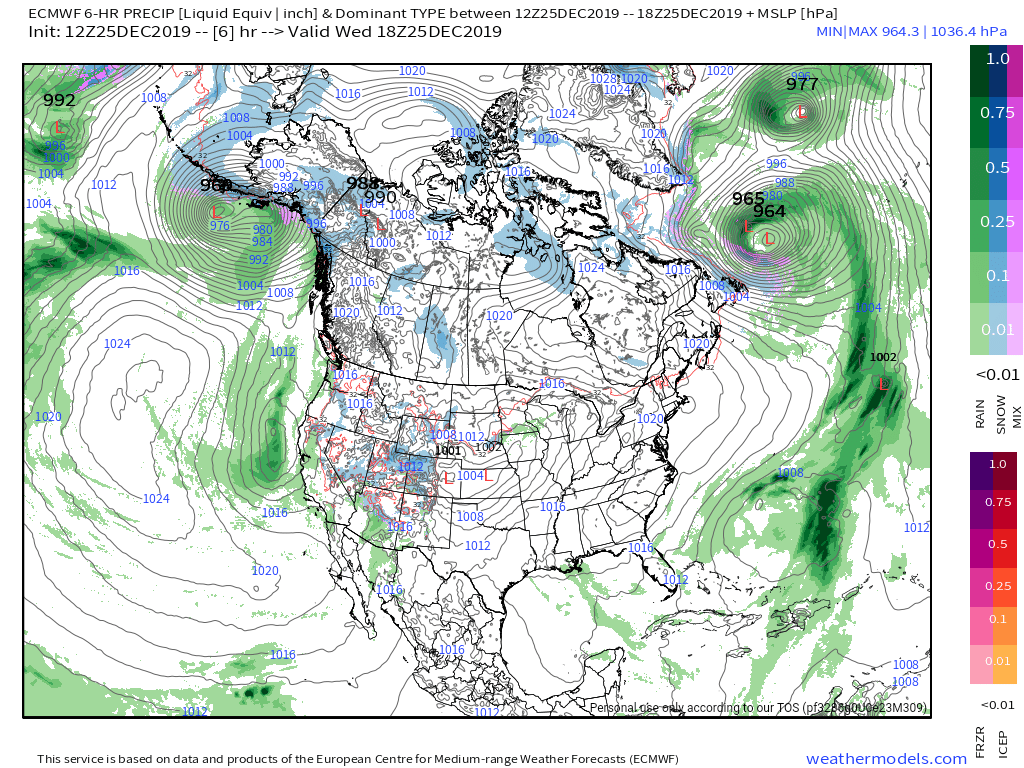
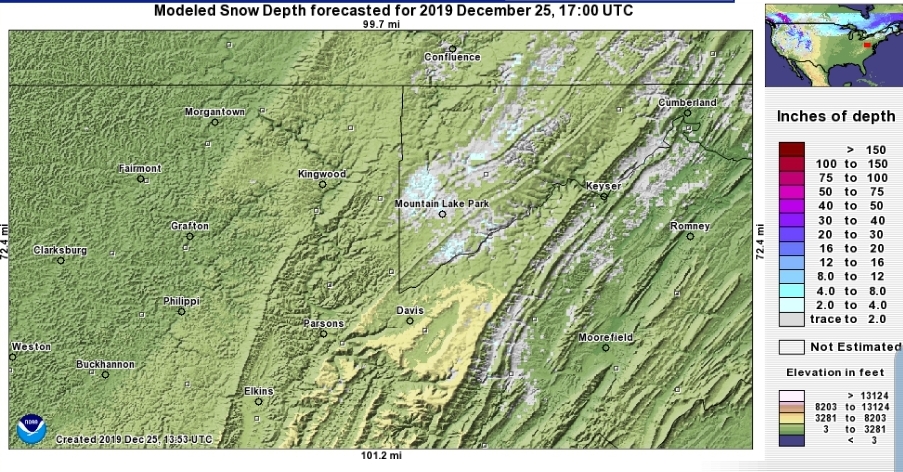
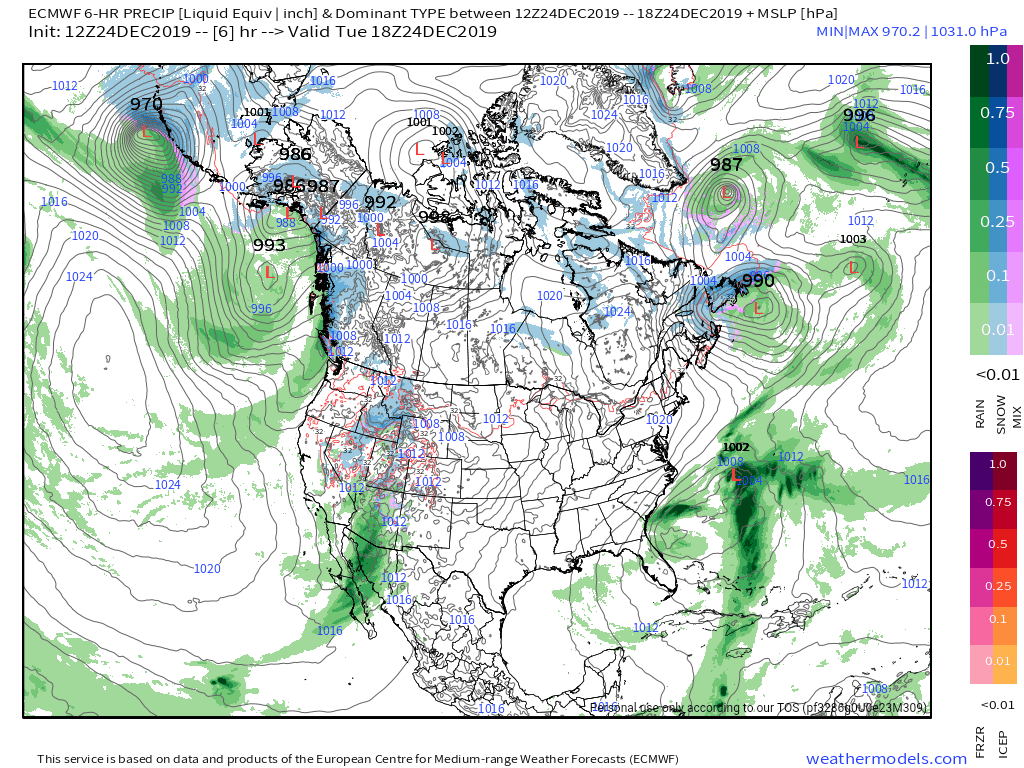
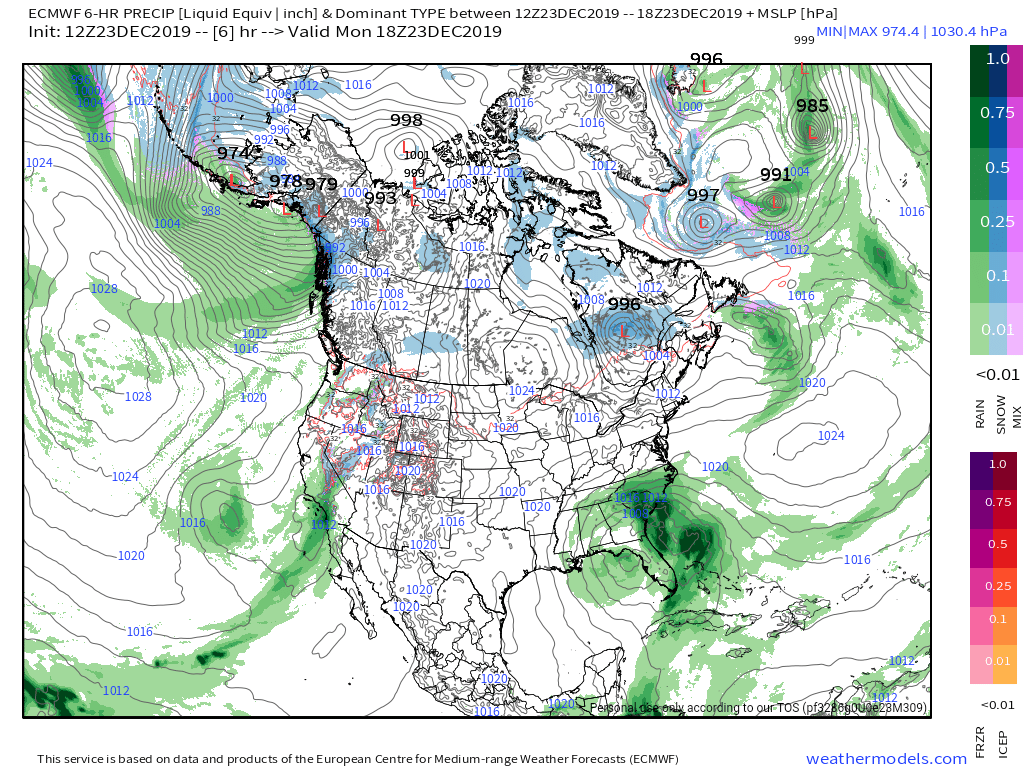
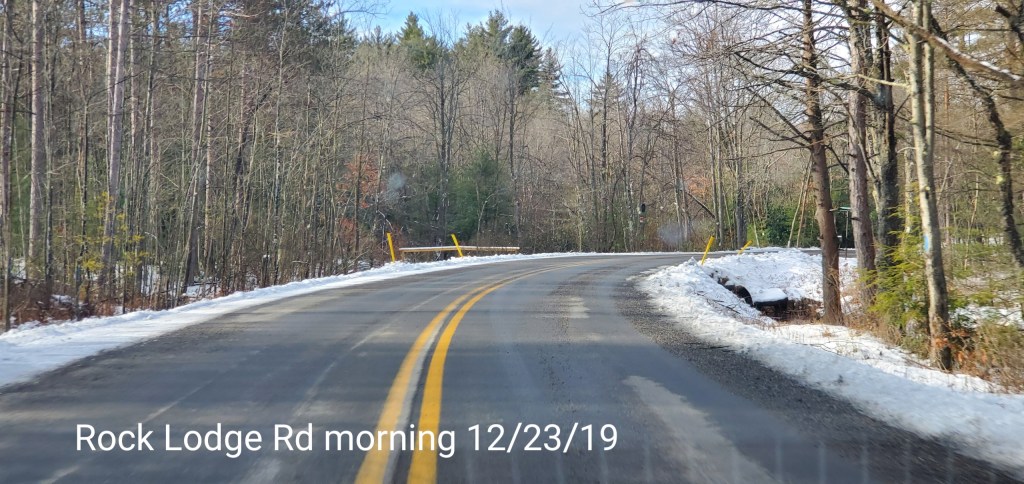
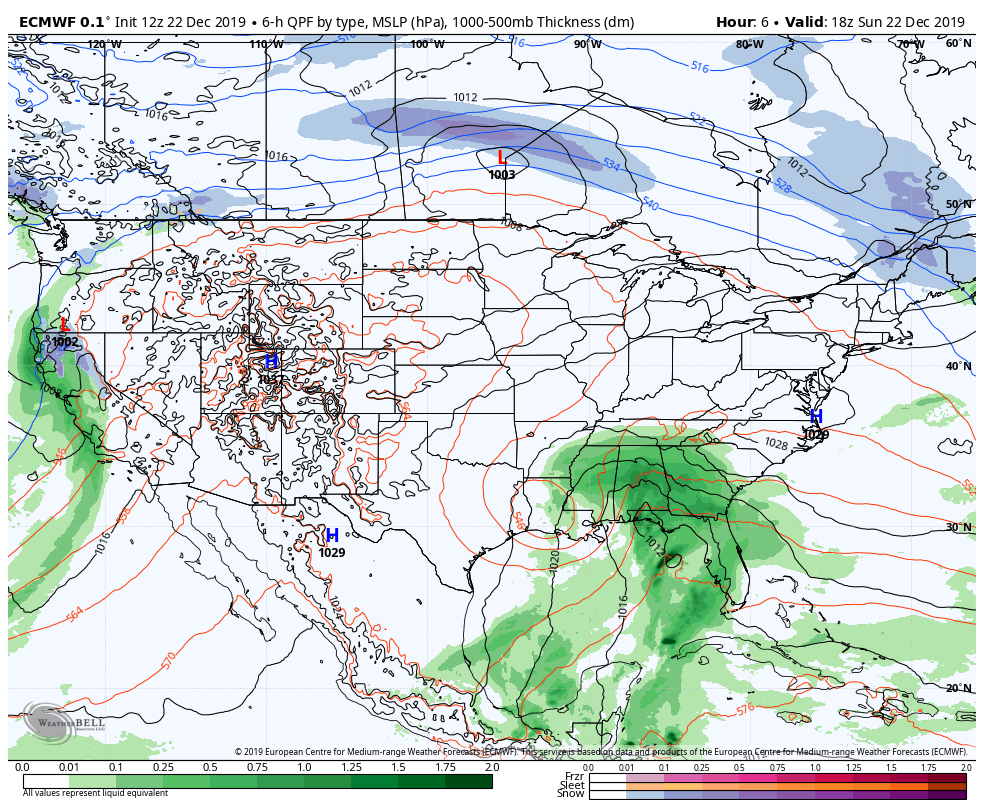
Some very fine light snow early, mainly just cloudy, windy, few peaks of sun and much colder today. All models except the ECMWF over doing the snow today. Almost all remained north until after dark some into Garrett.
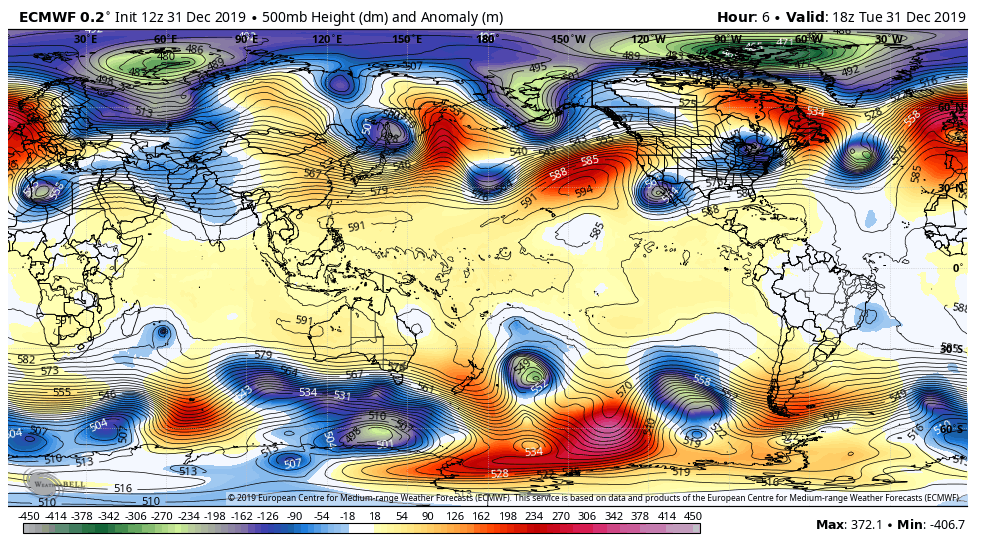
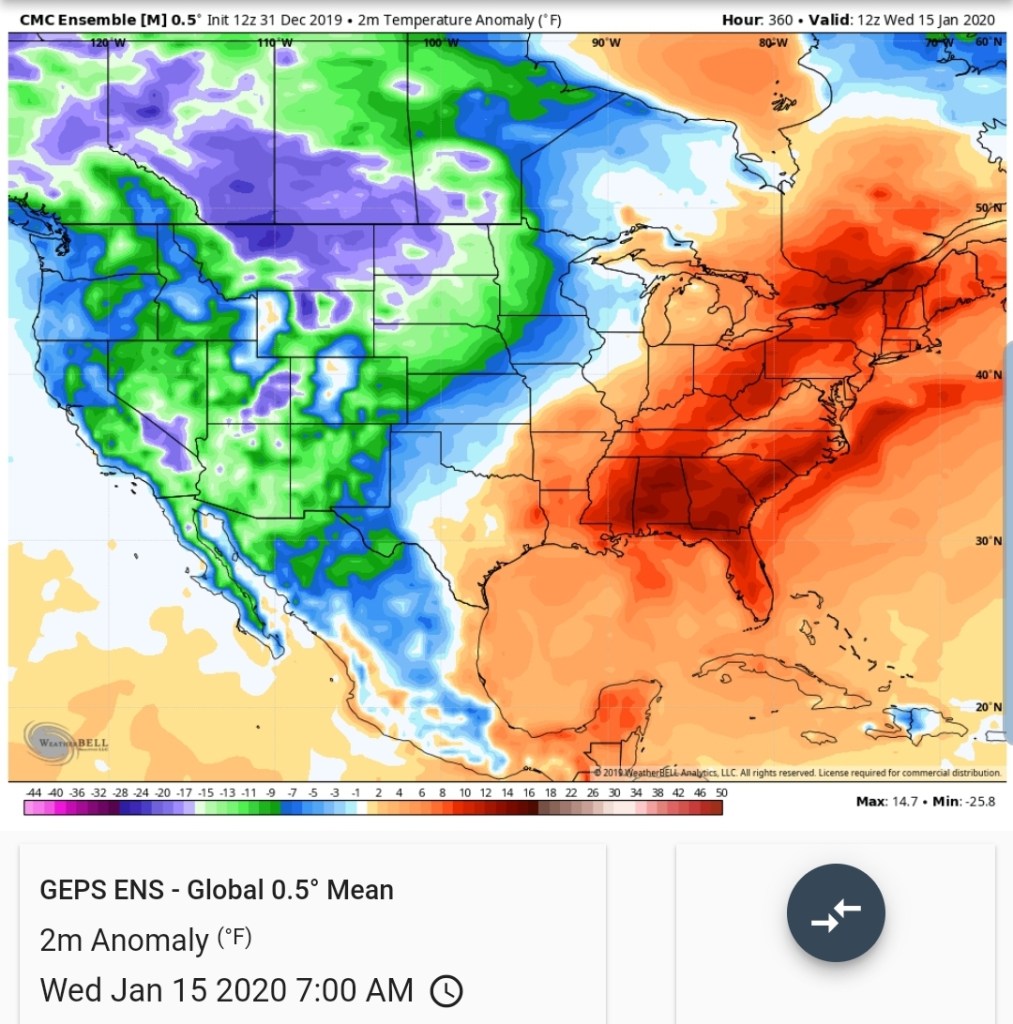
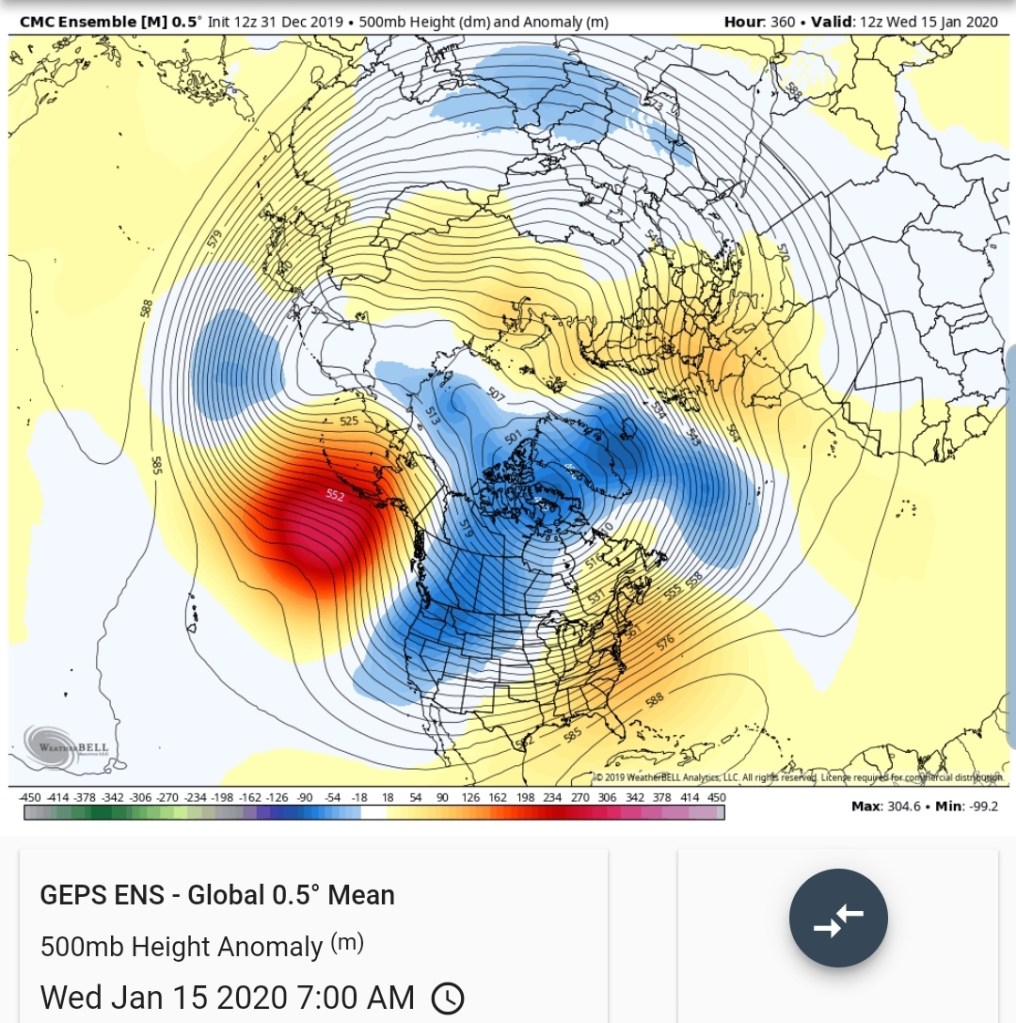
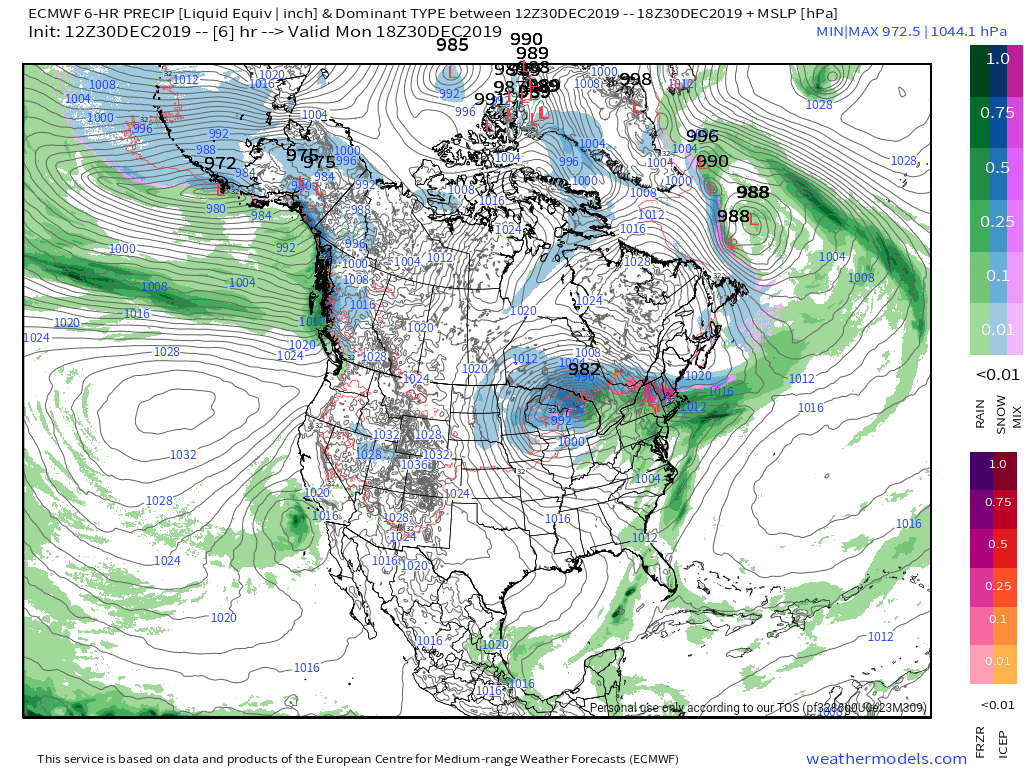
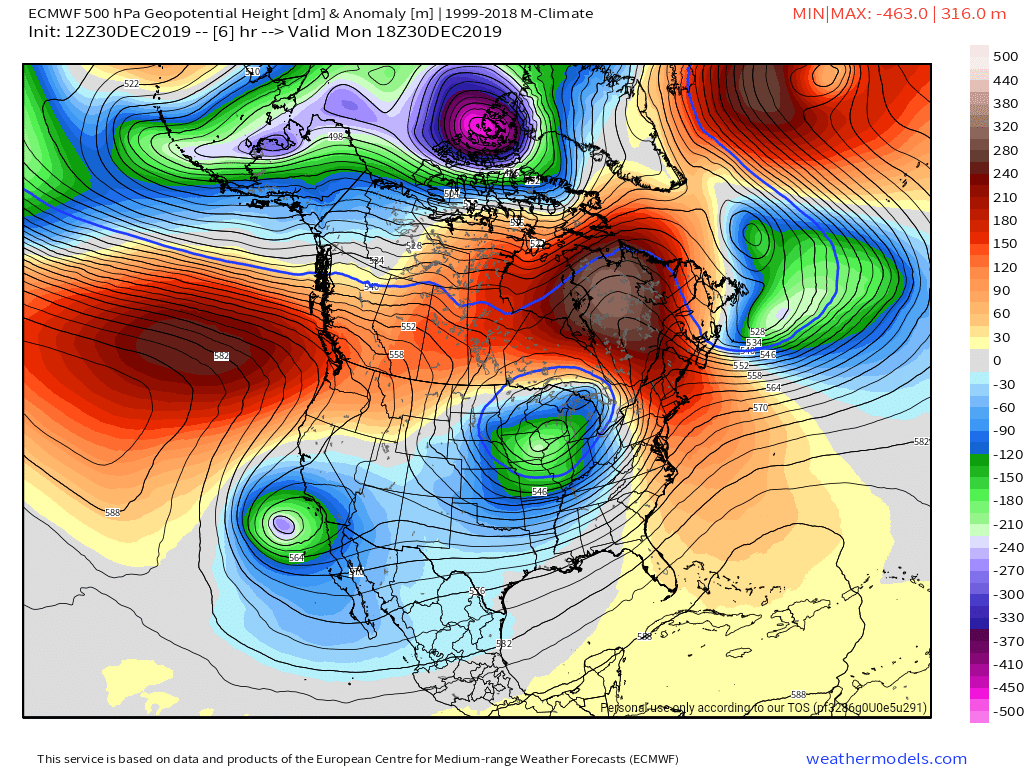
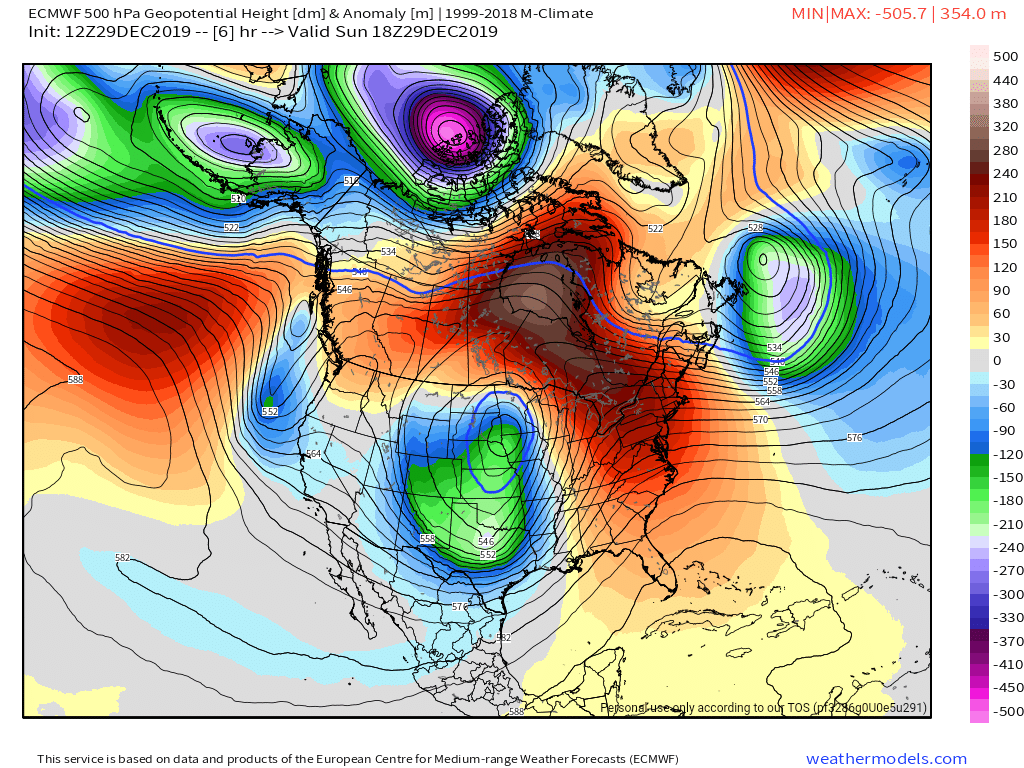
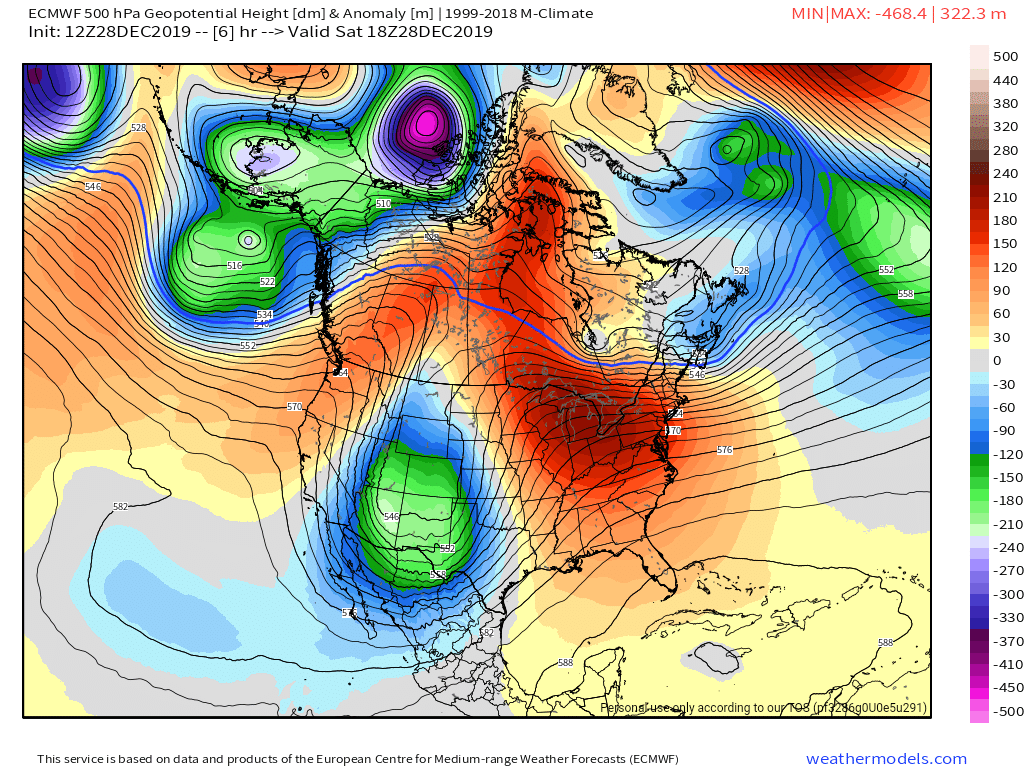
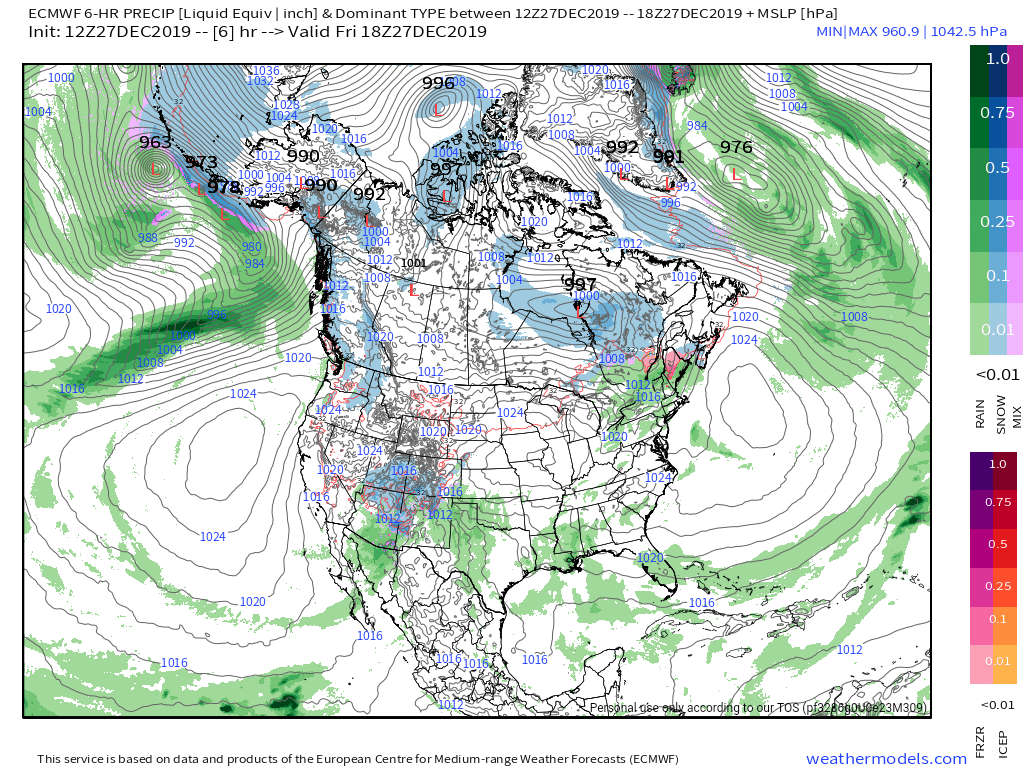
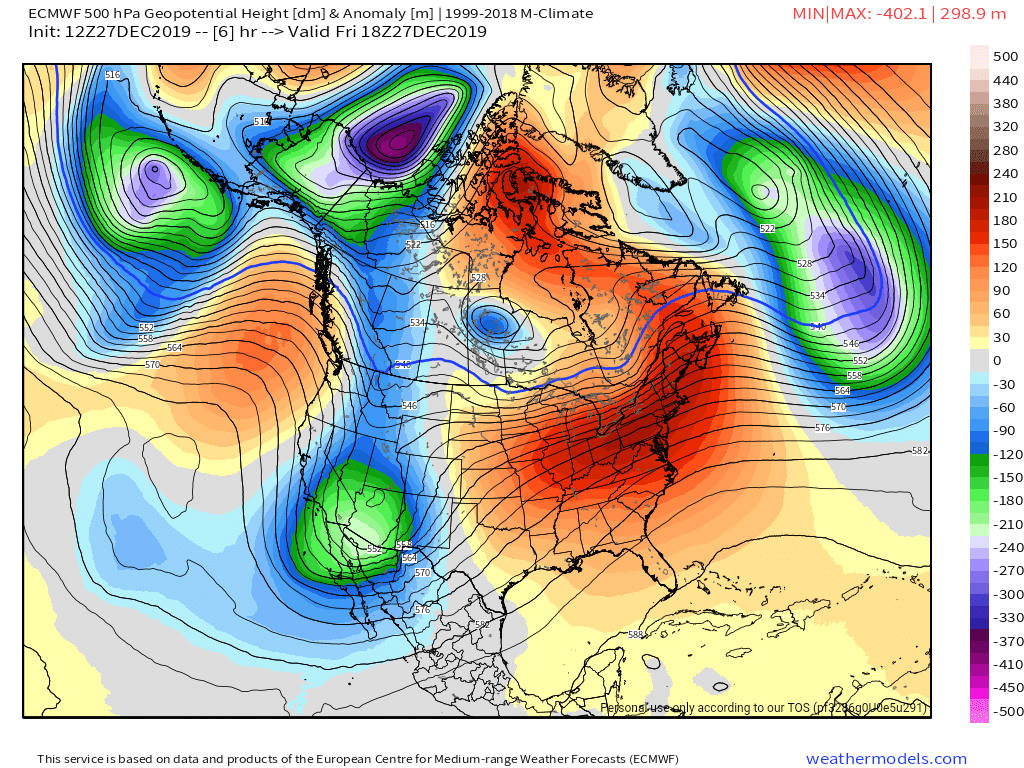
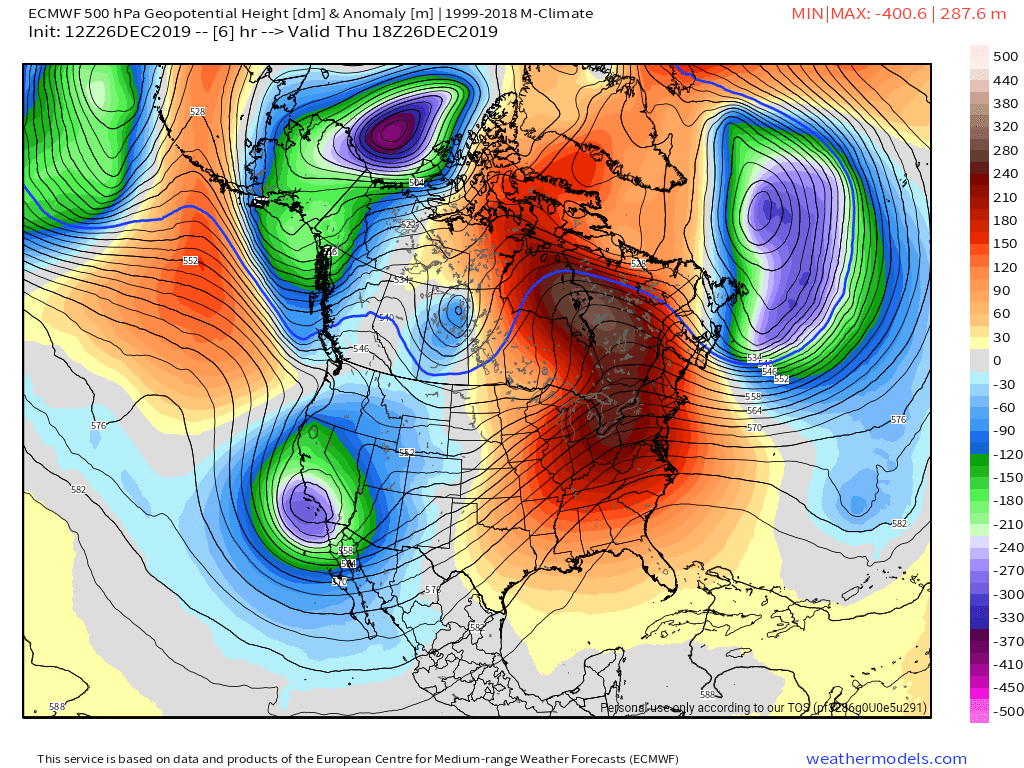
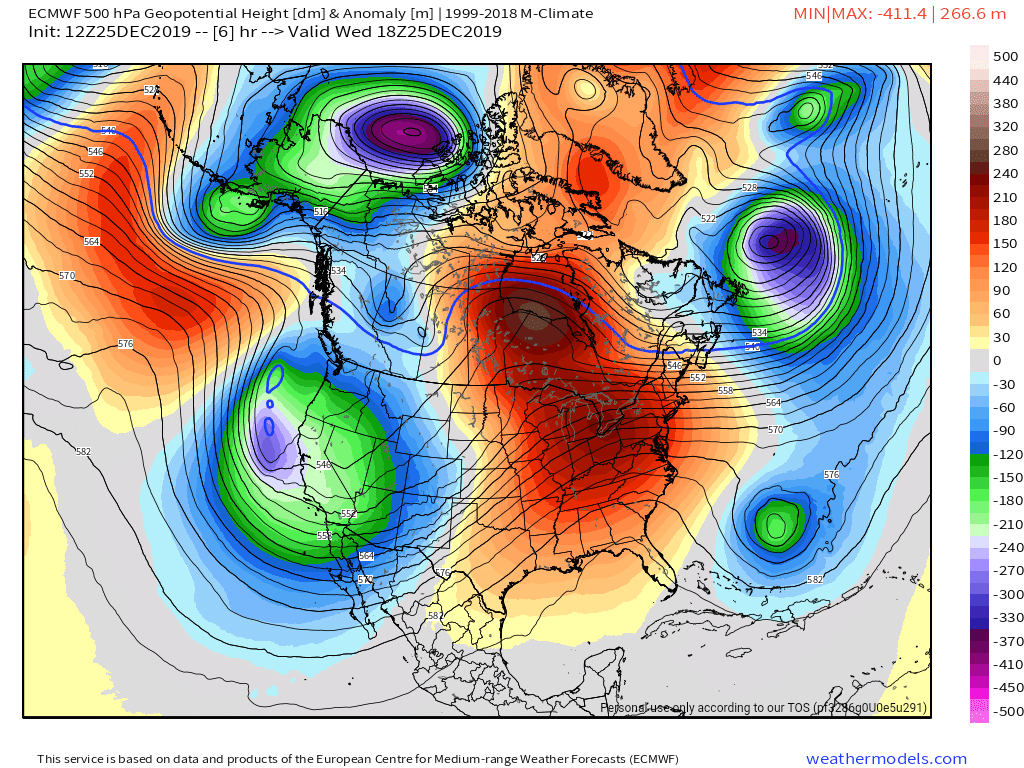
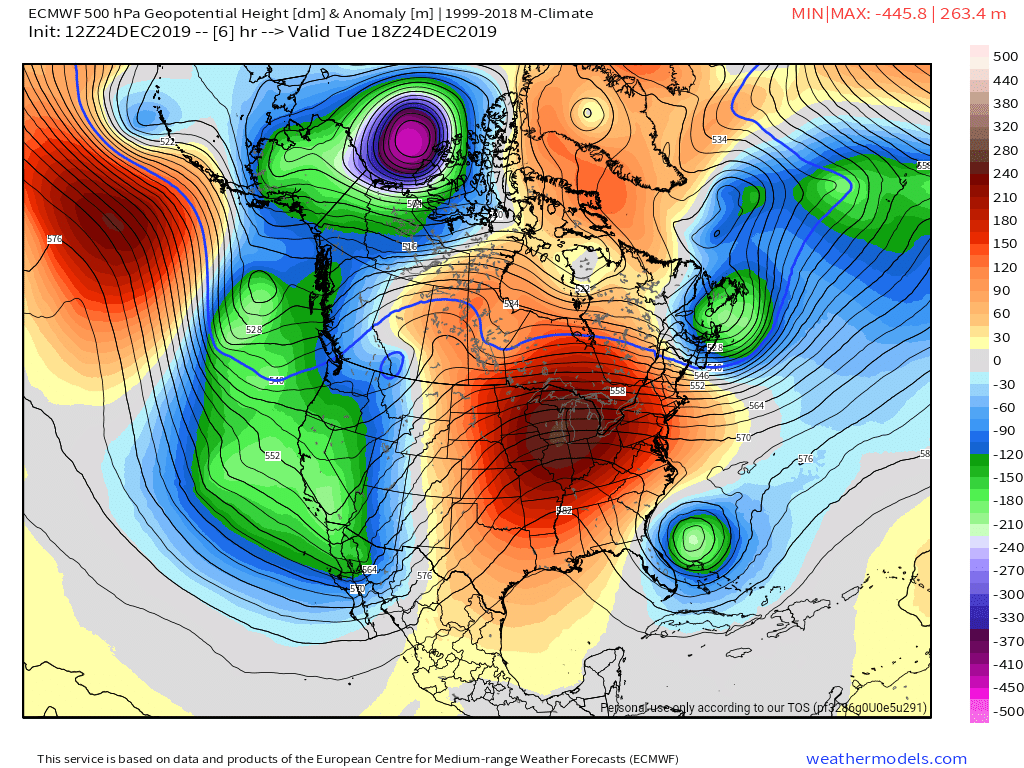
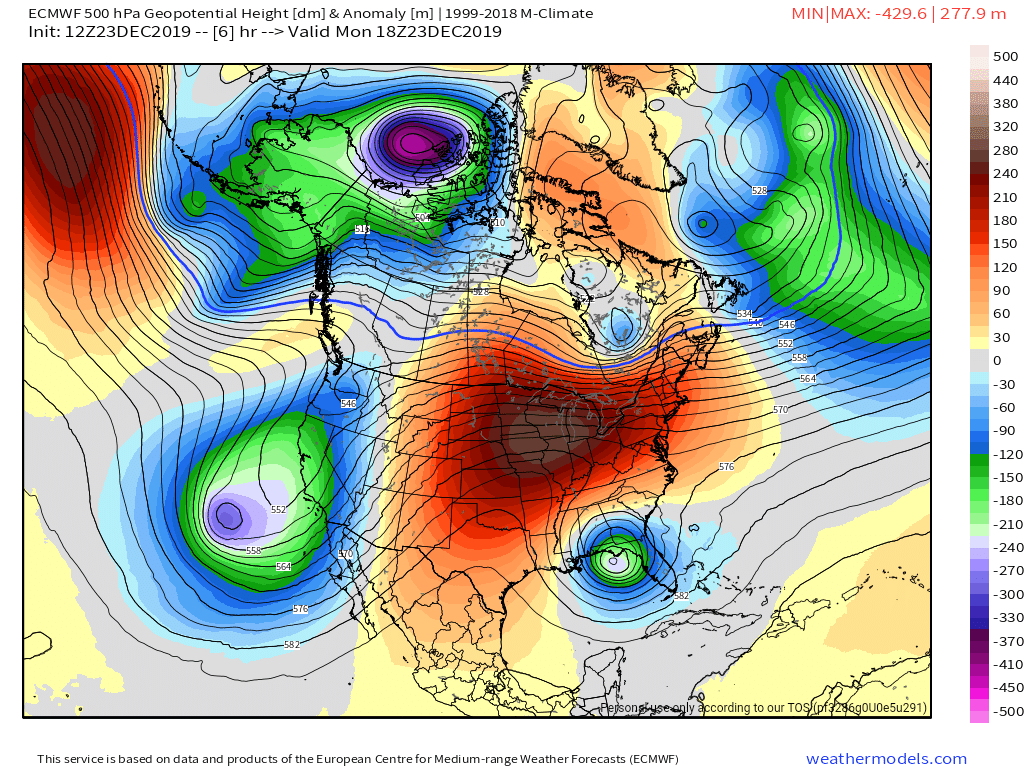
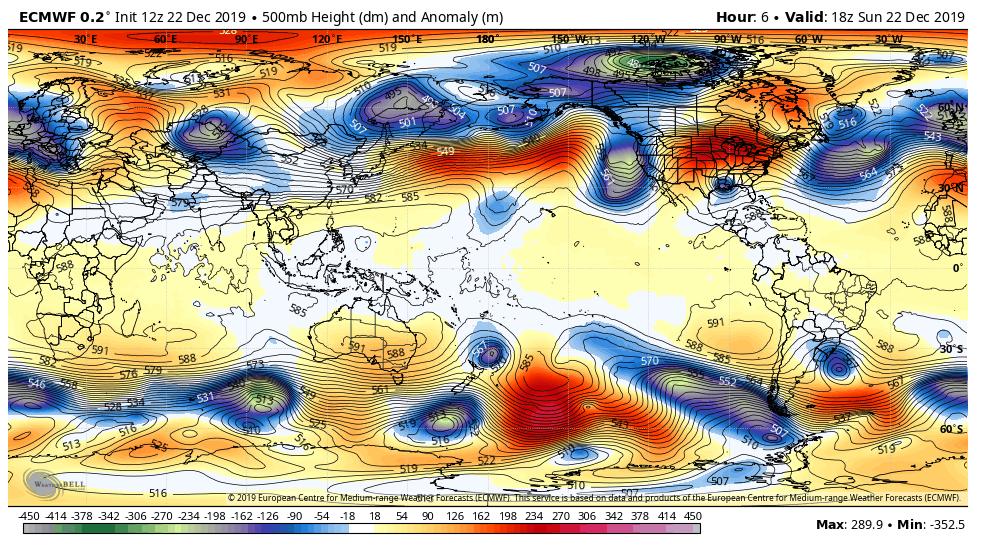
Surface features and 500mb height anomalies and flow
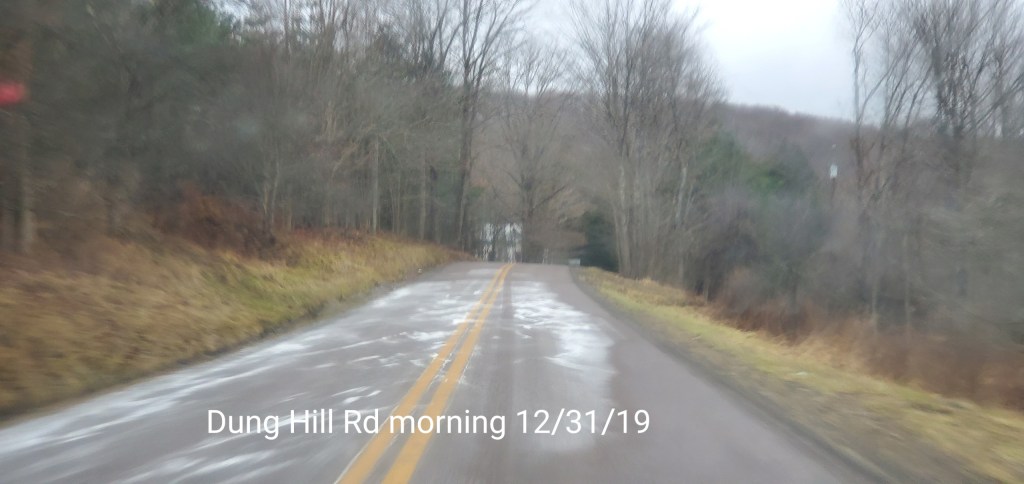
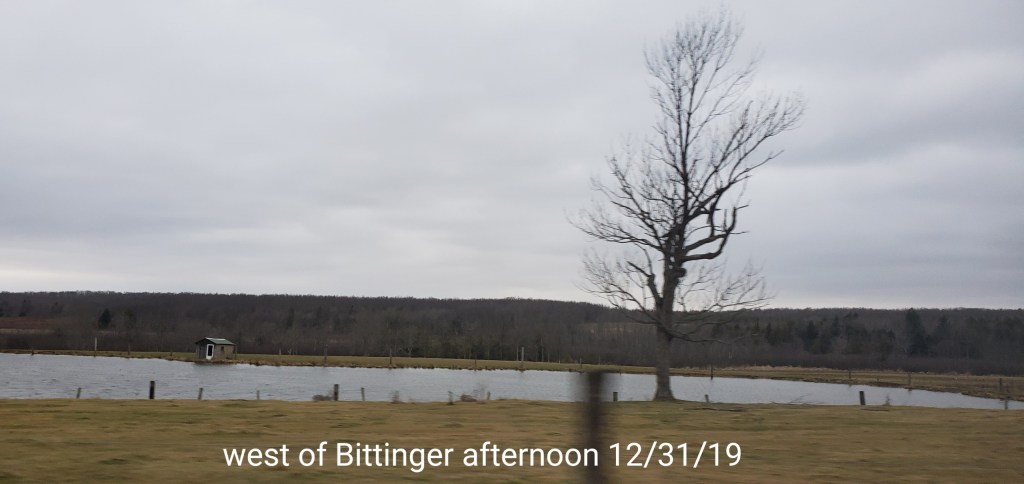
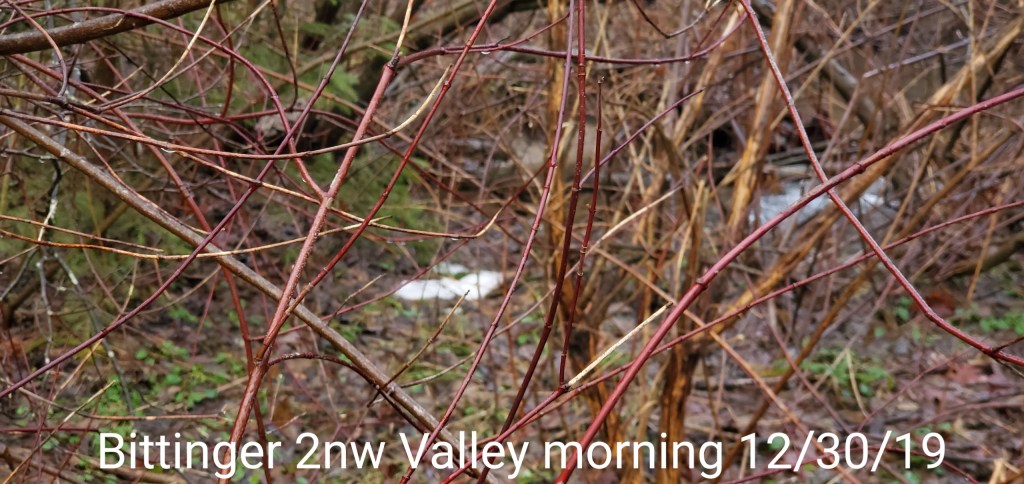
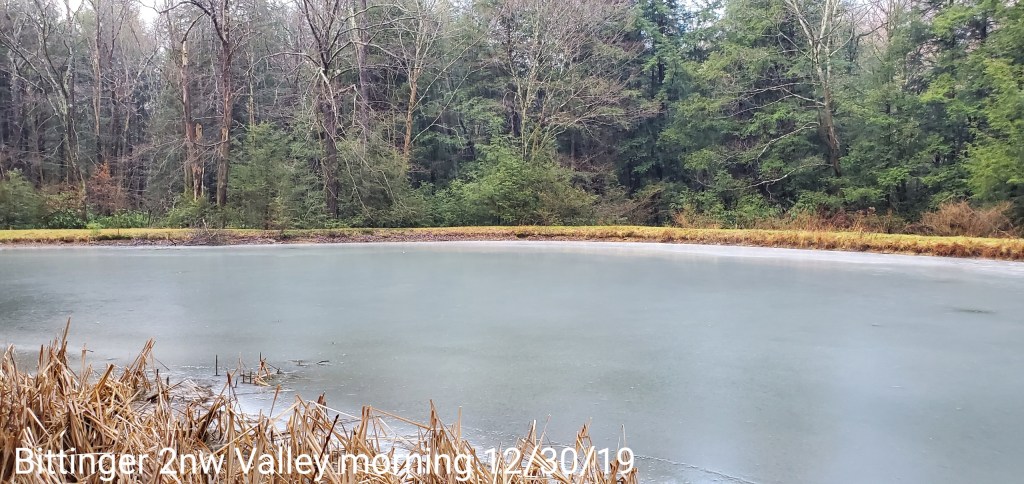
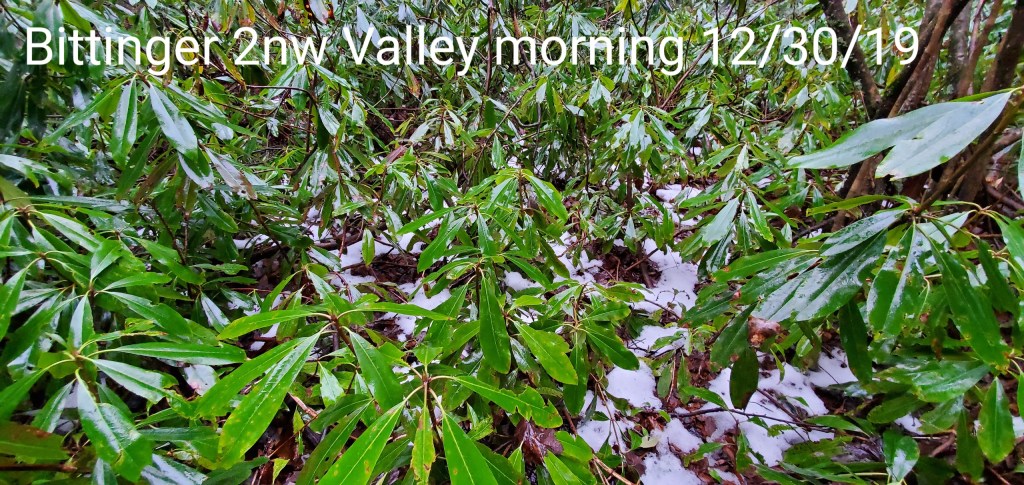
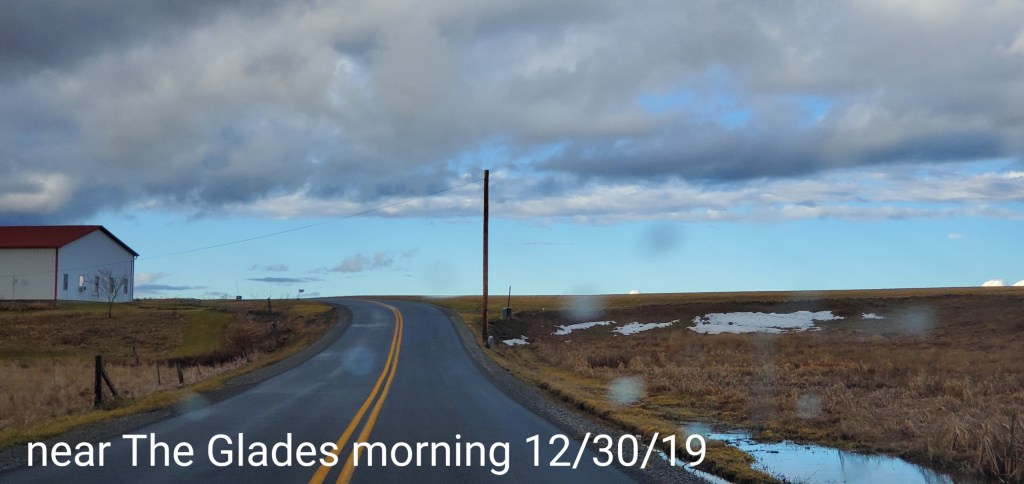
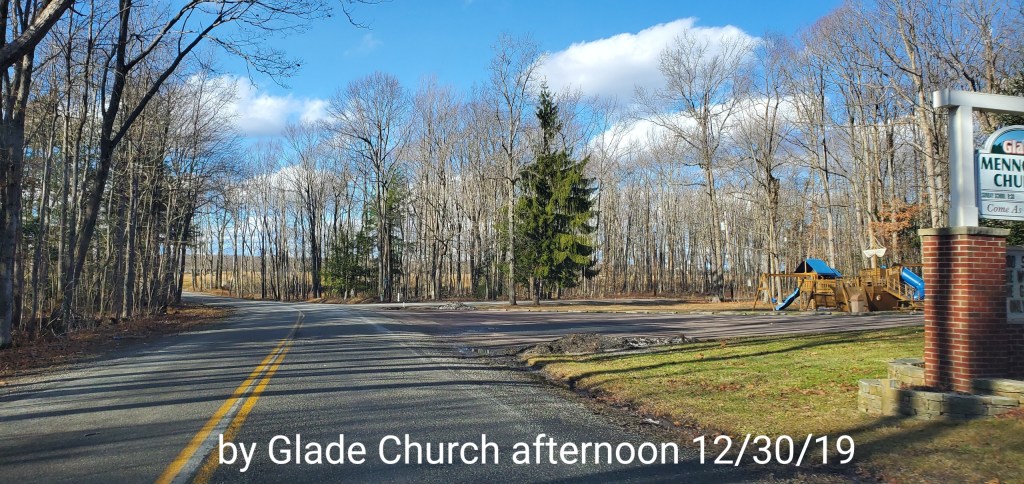
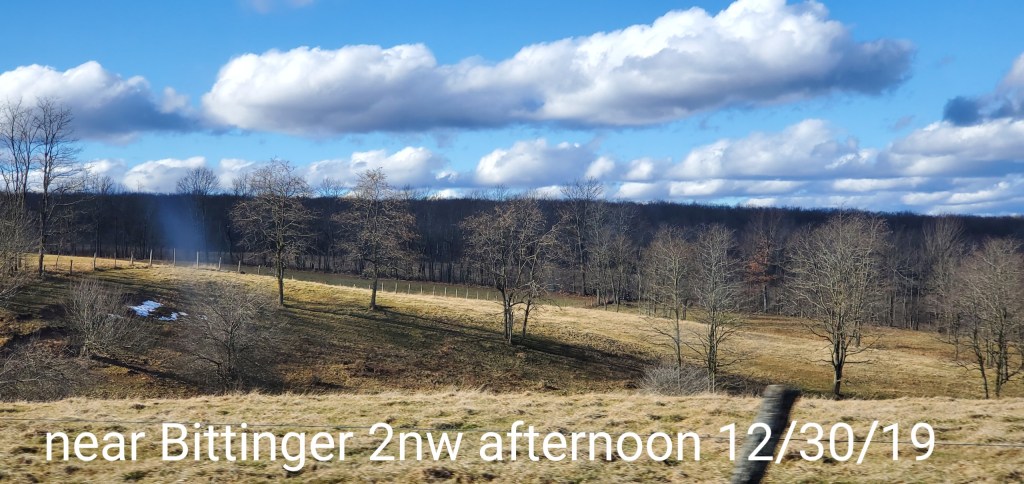
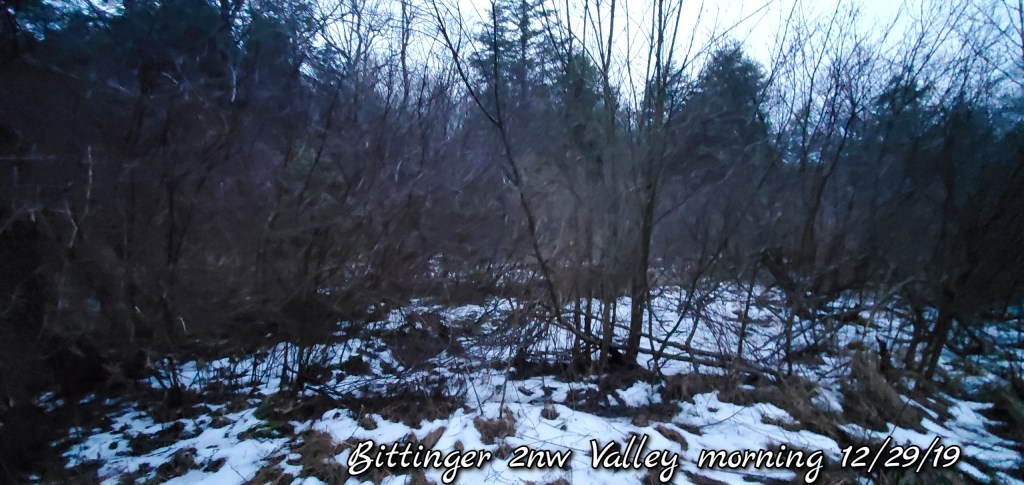
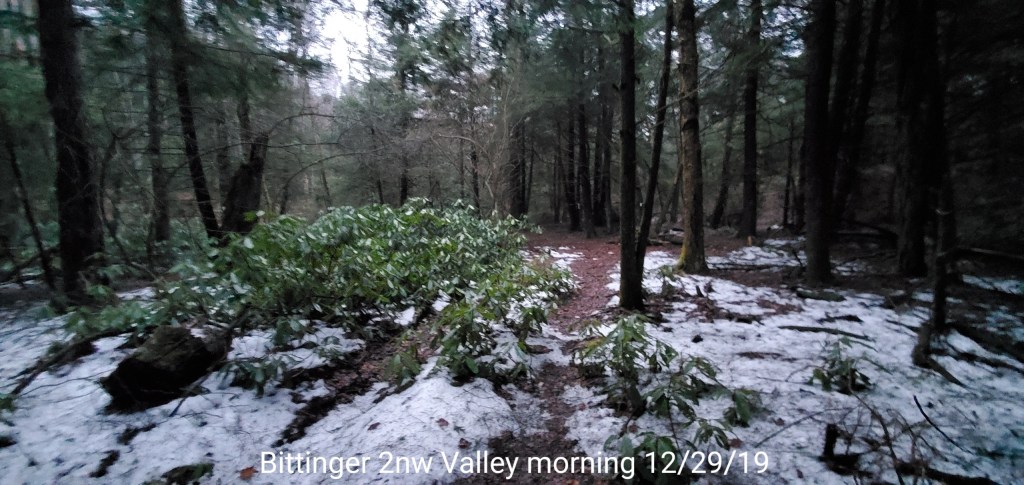
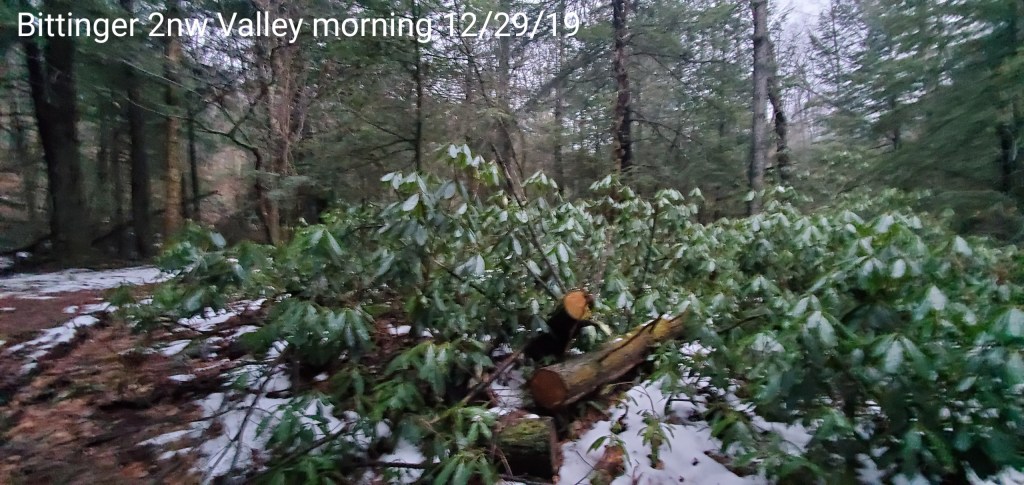
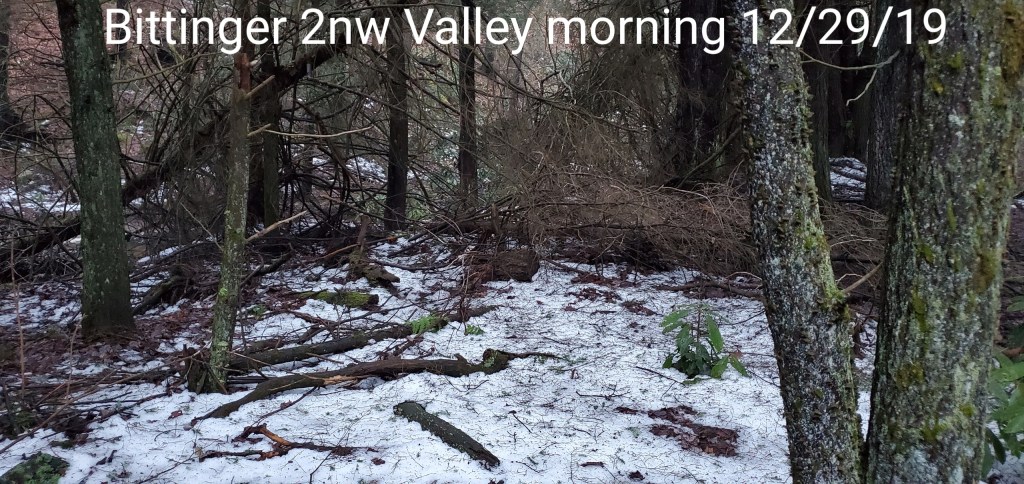
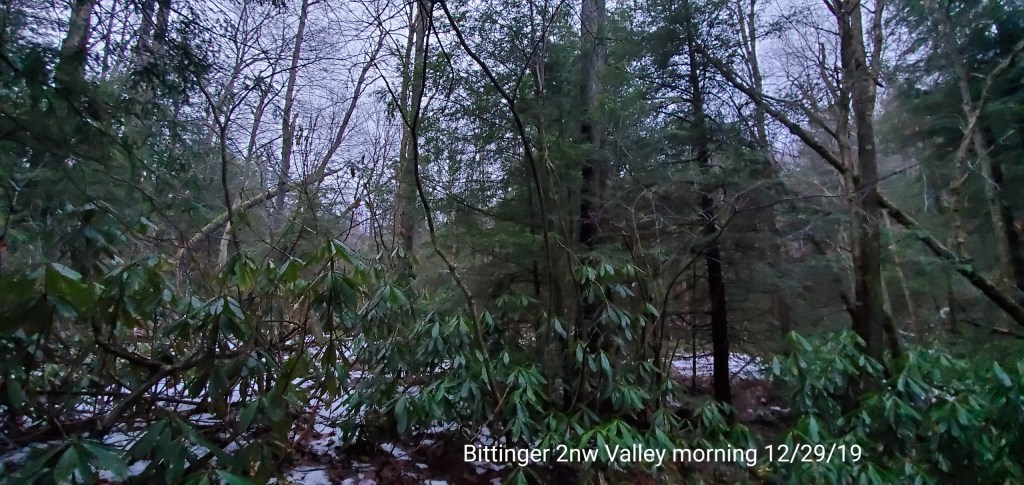
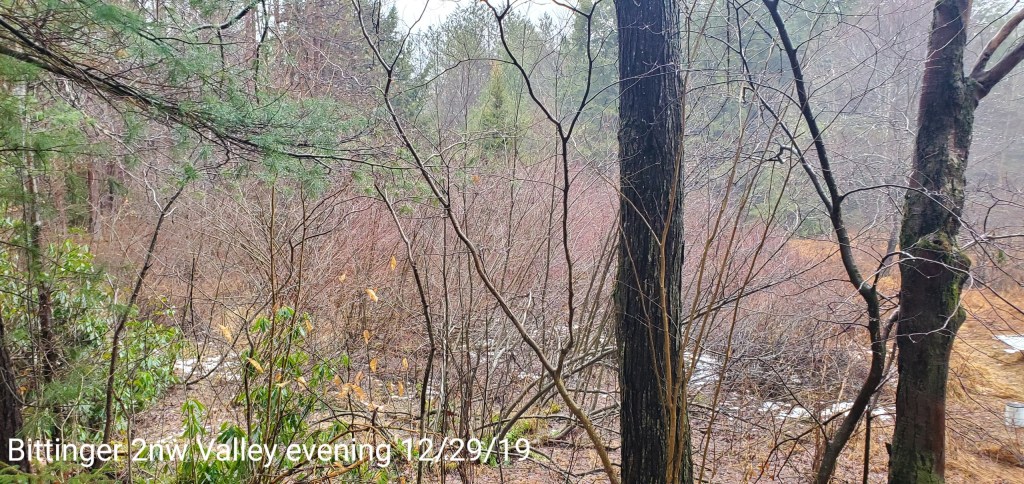
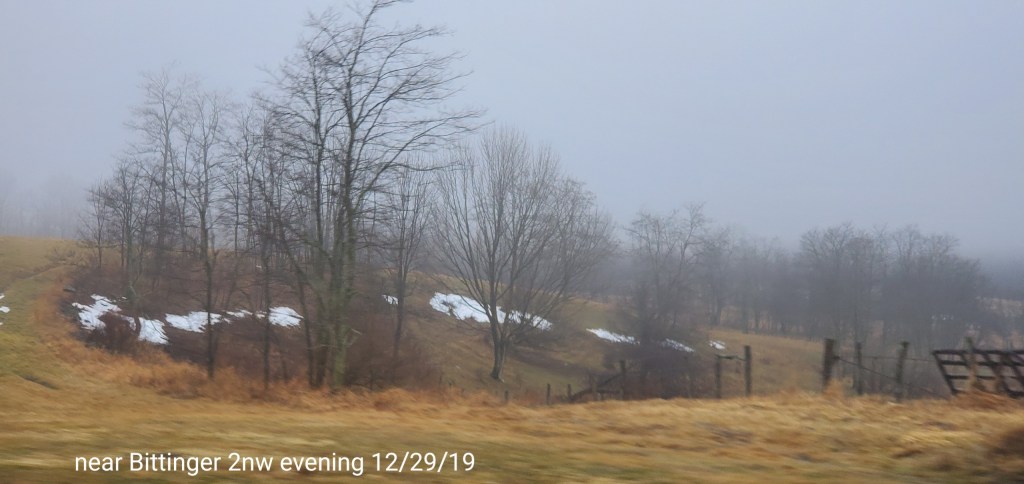
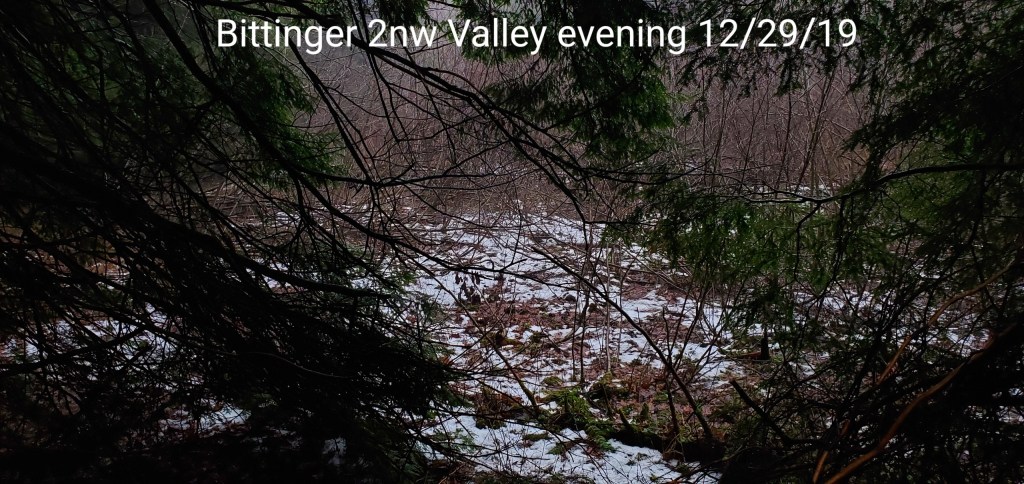
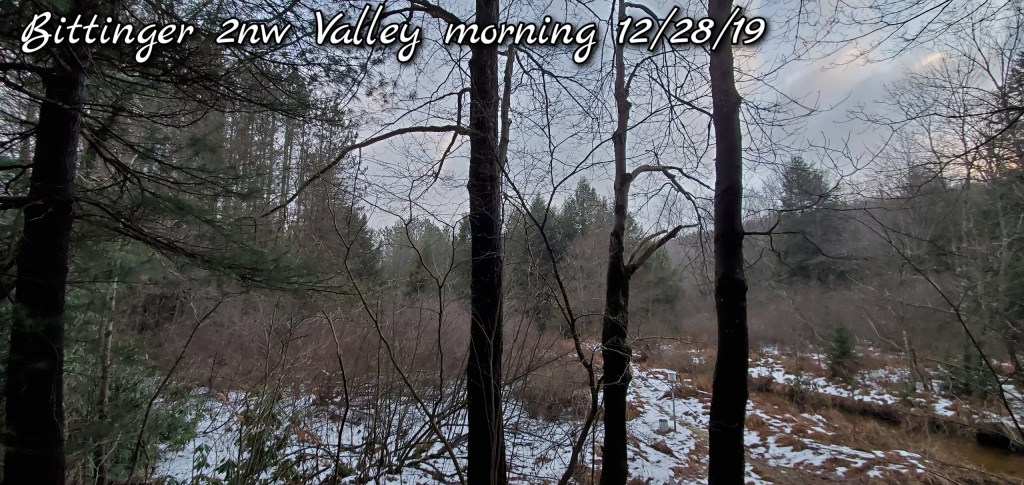
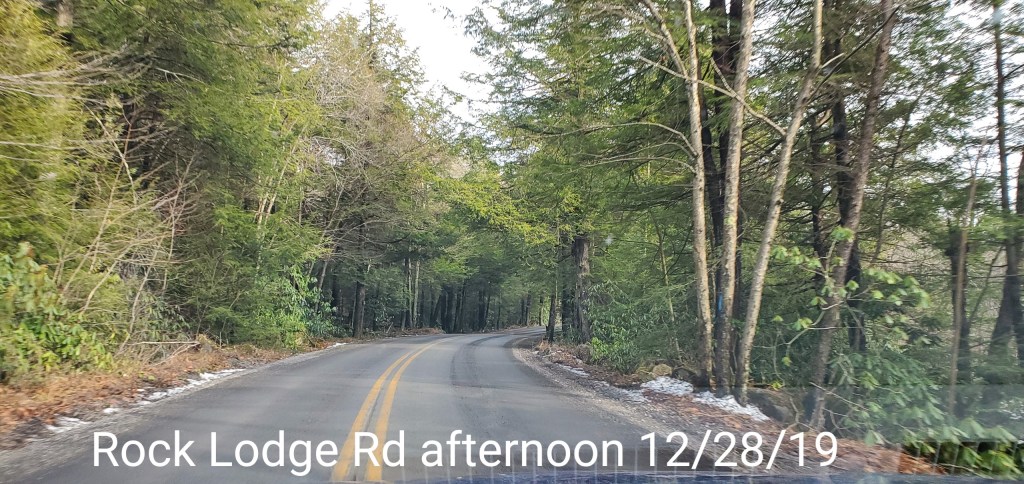
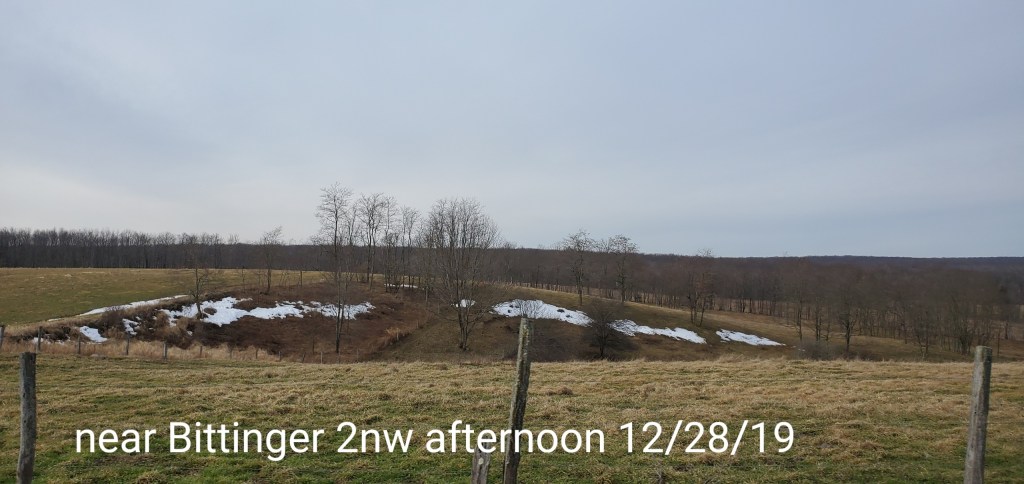
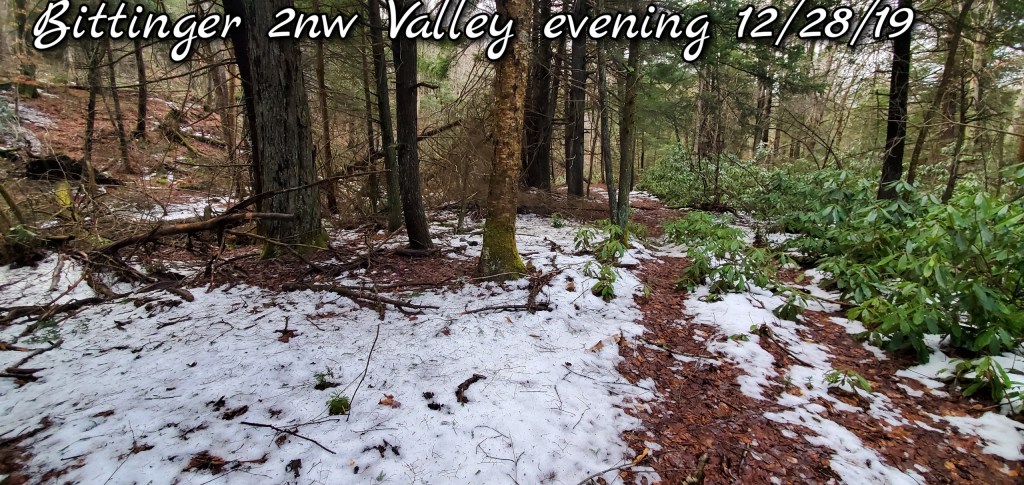
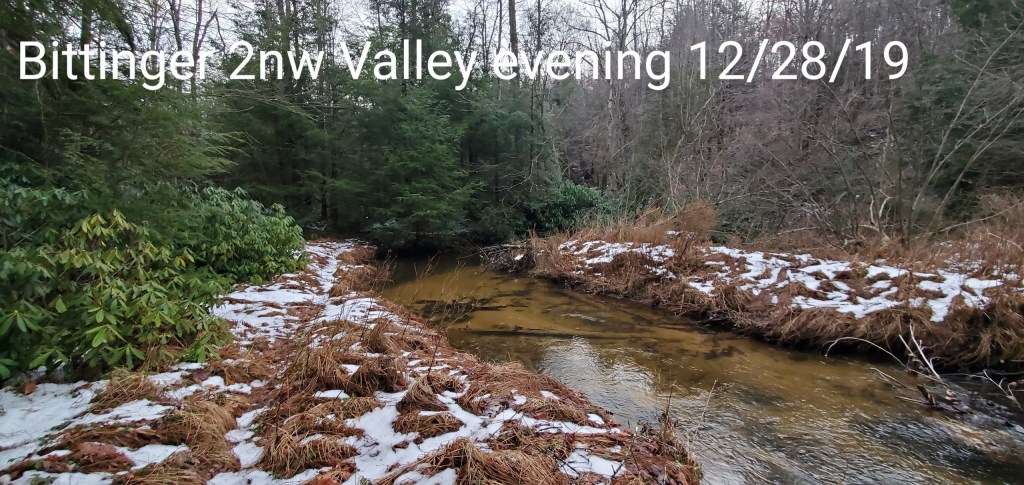
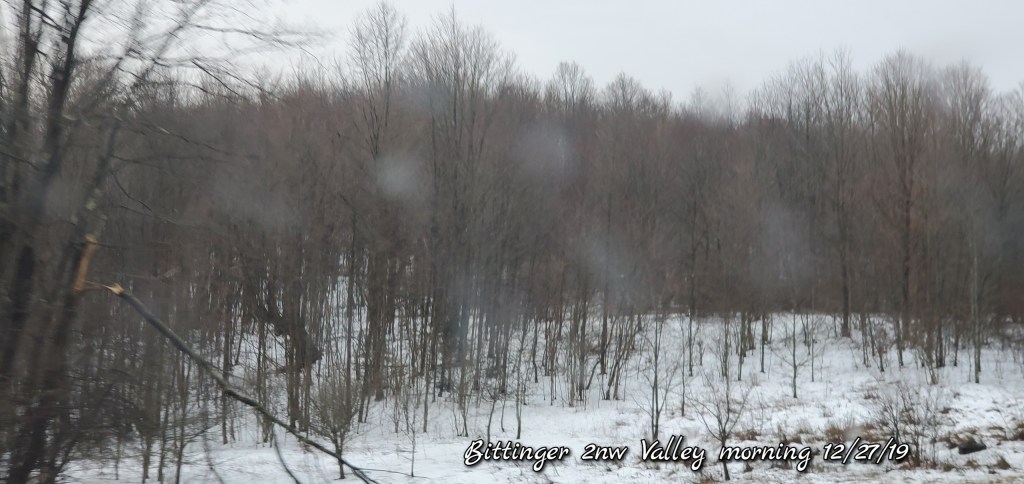
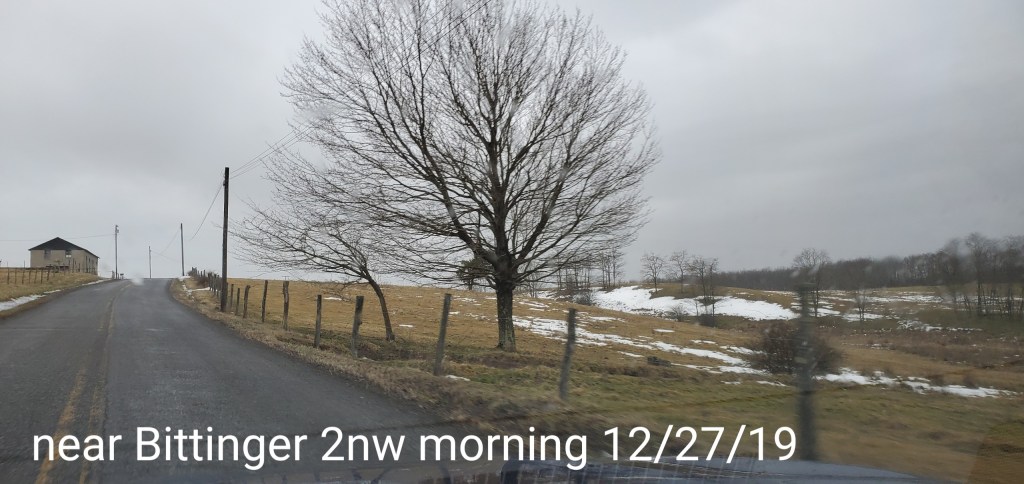
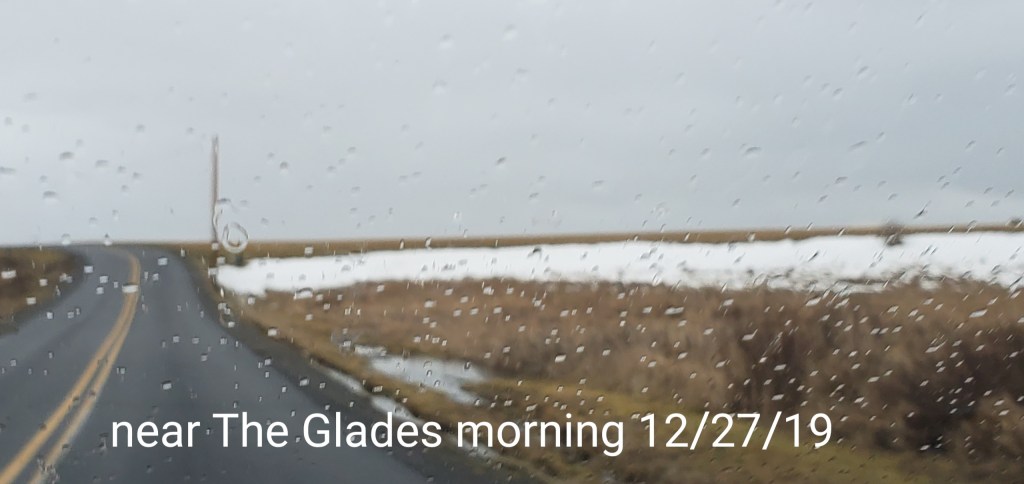
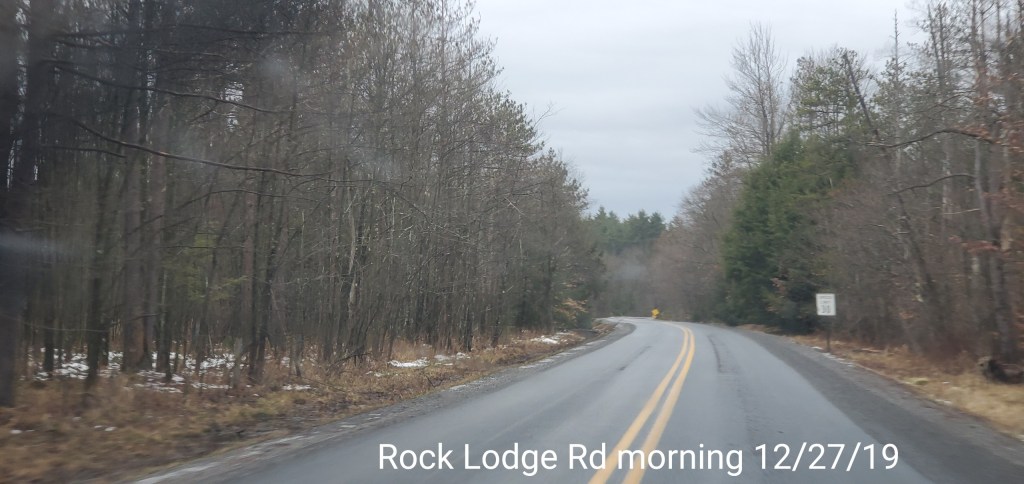
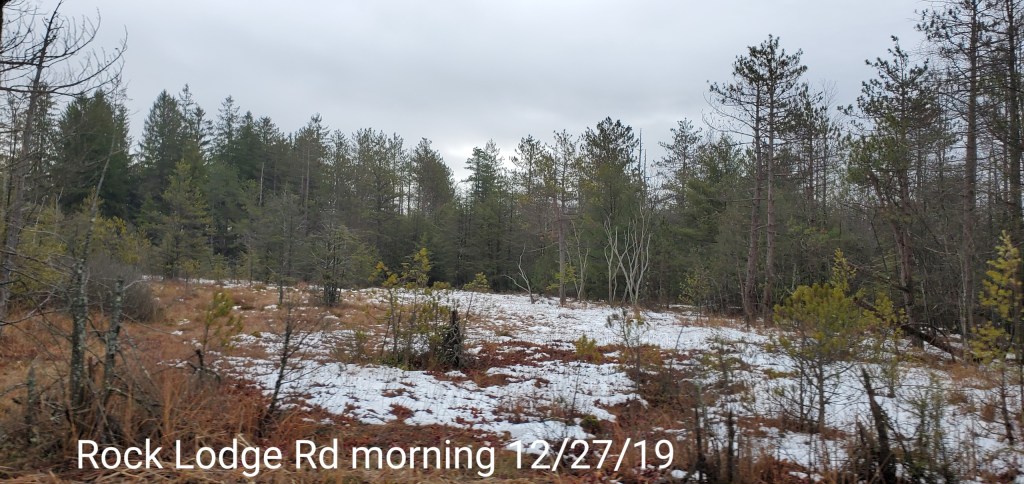
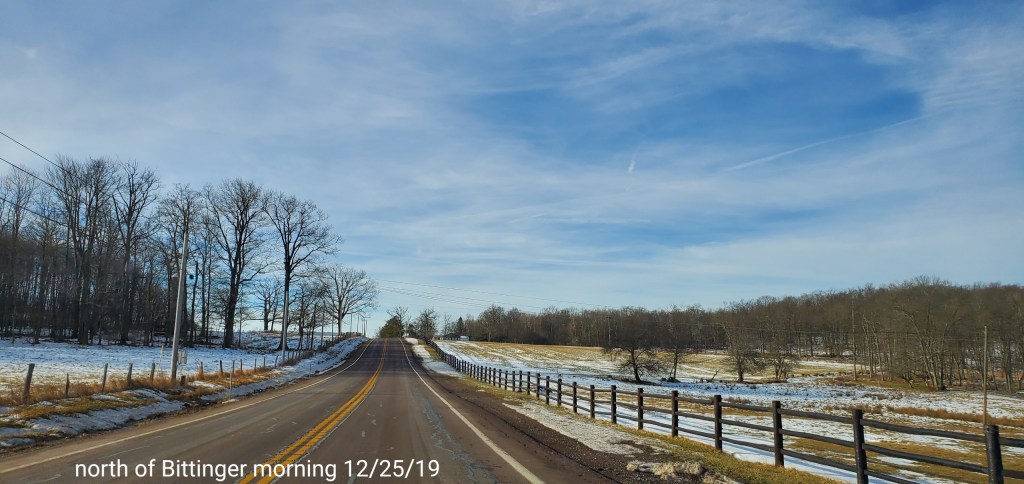
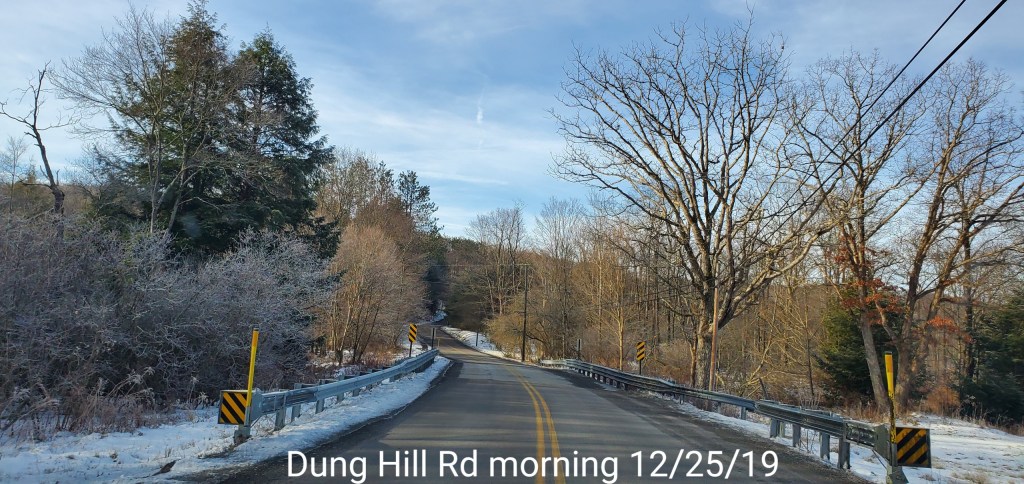
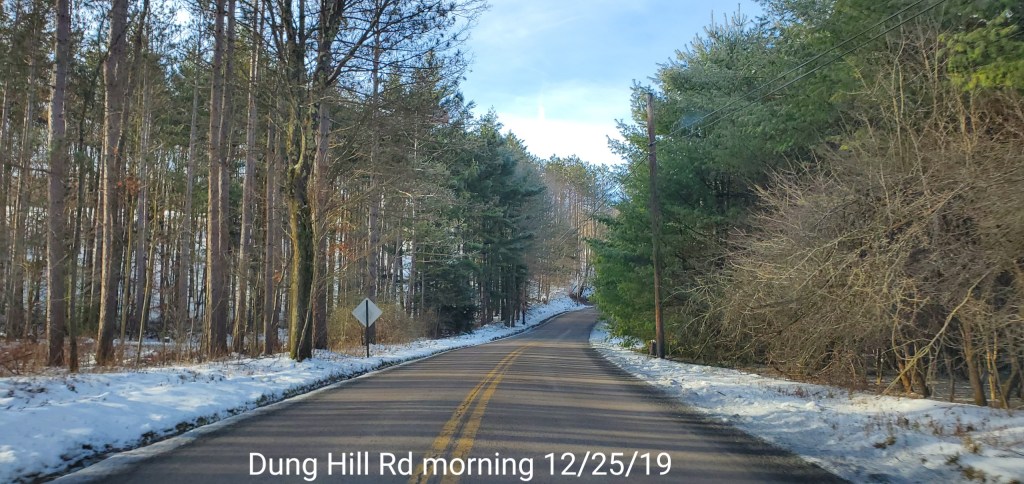
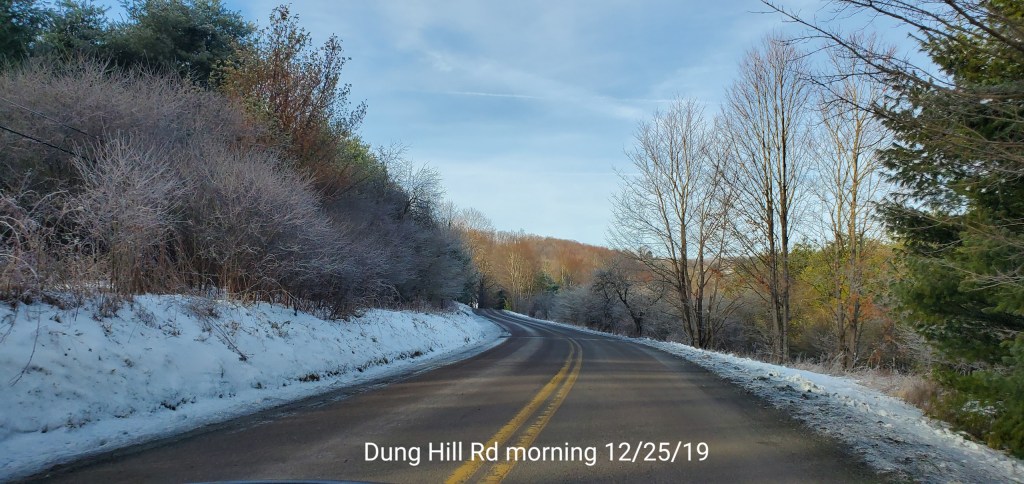
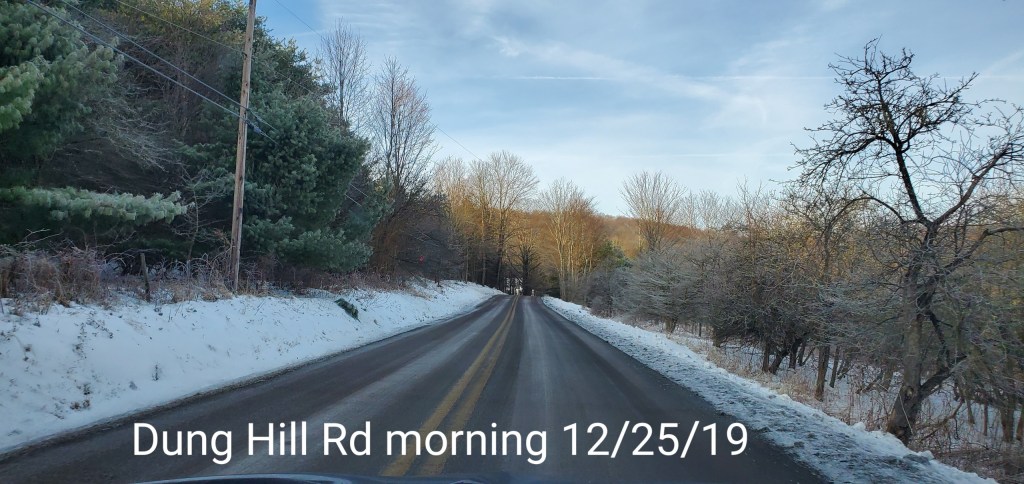
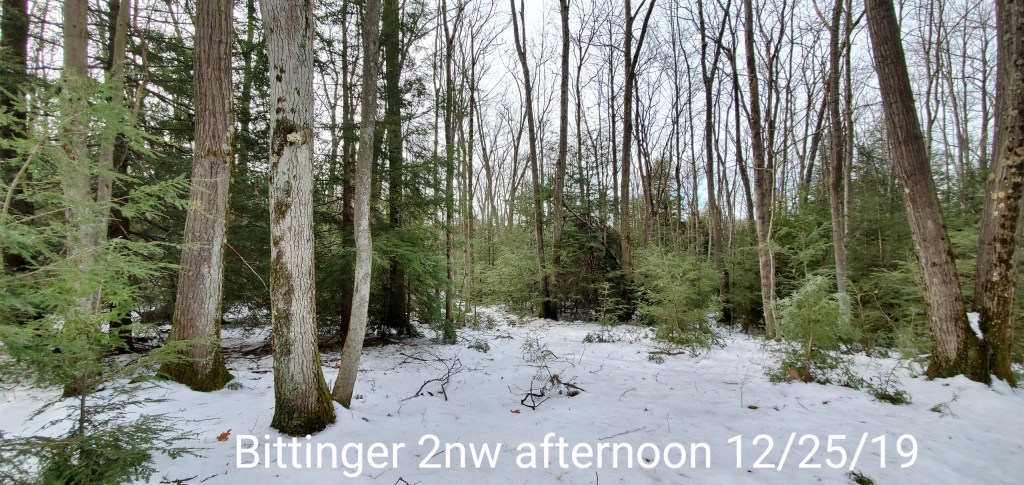
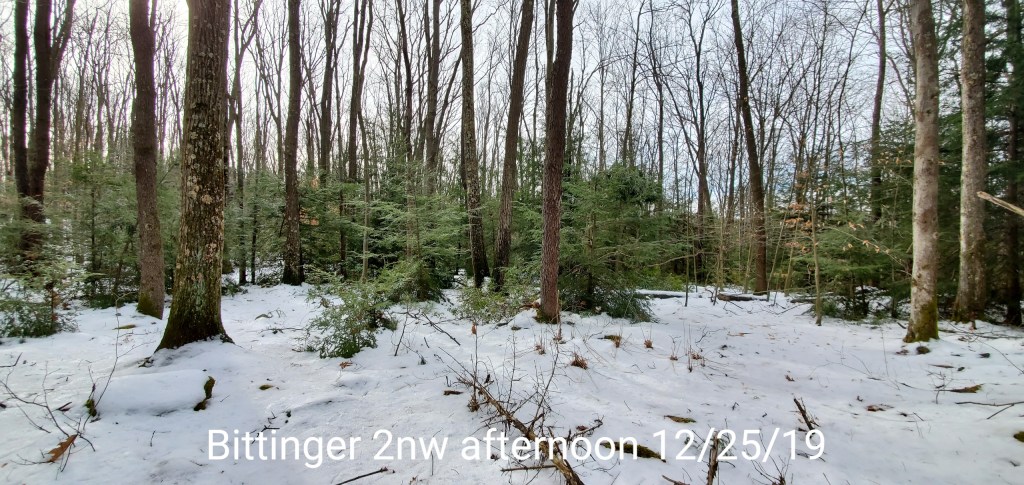
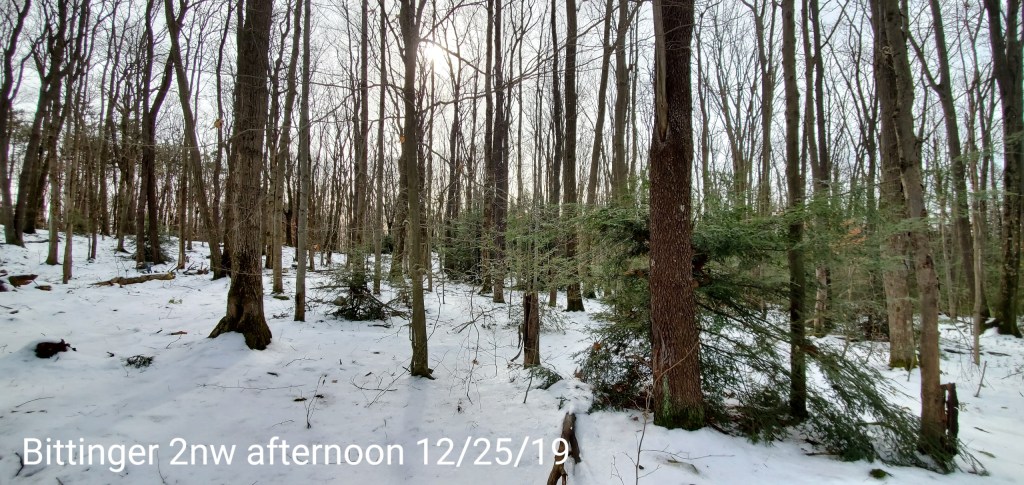
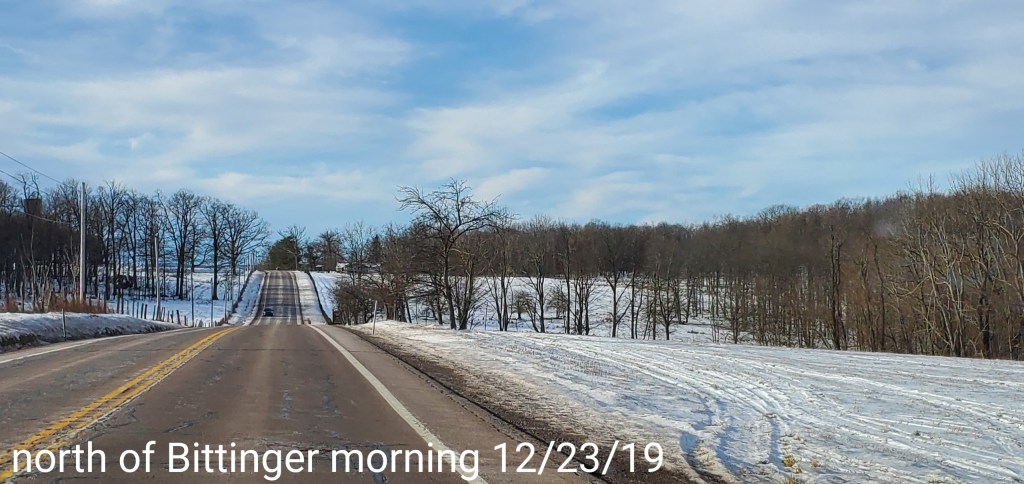
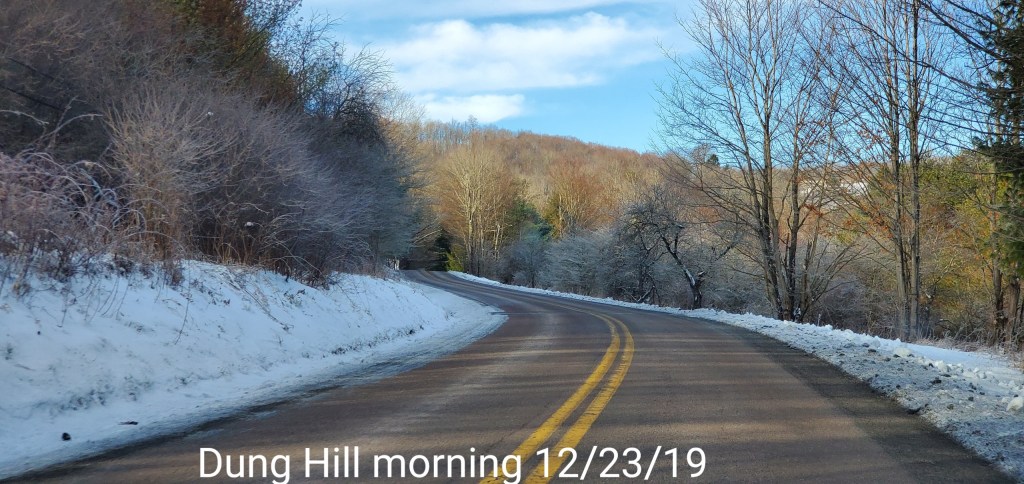
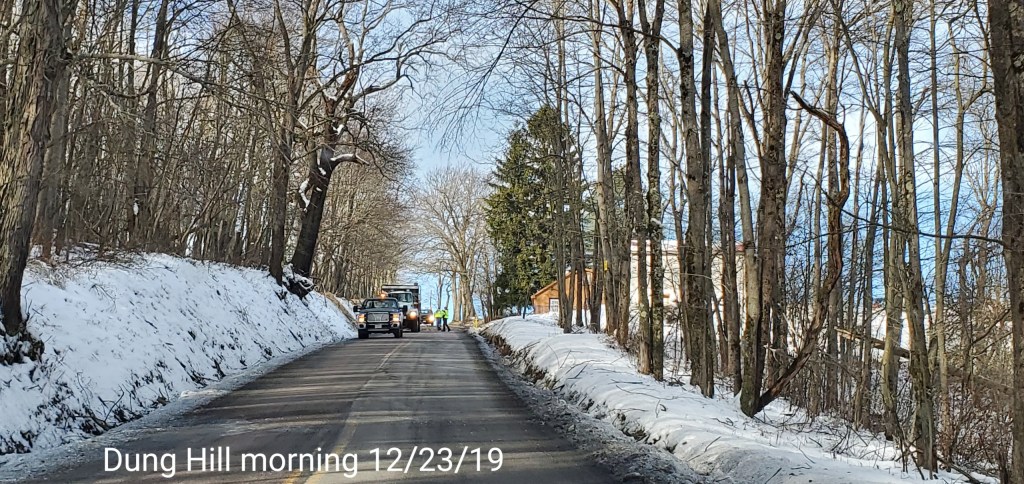
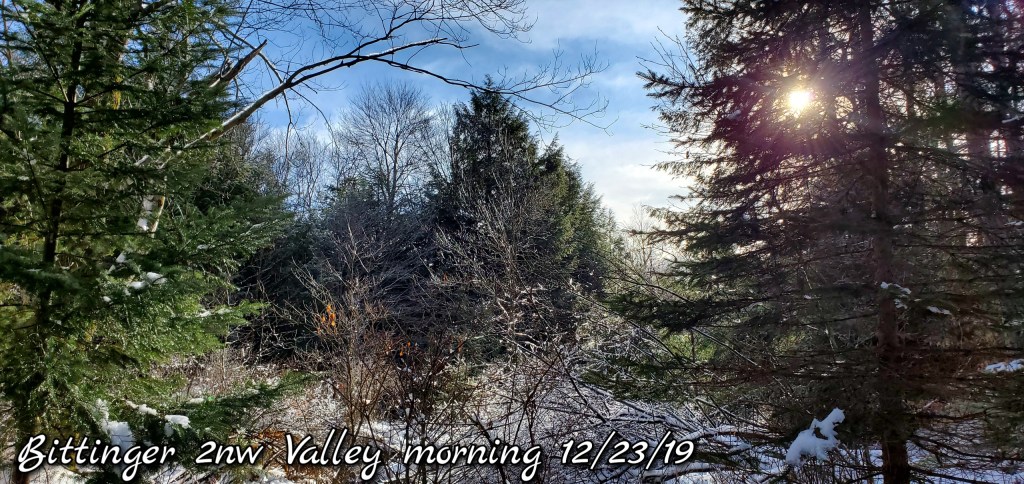
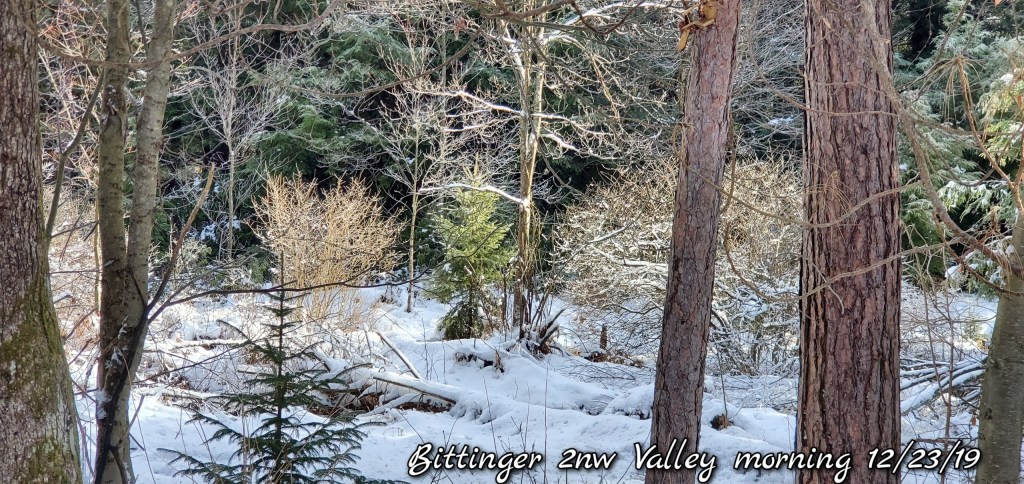
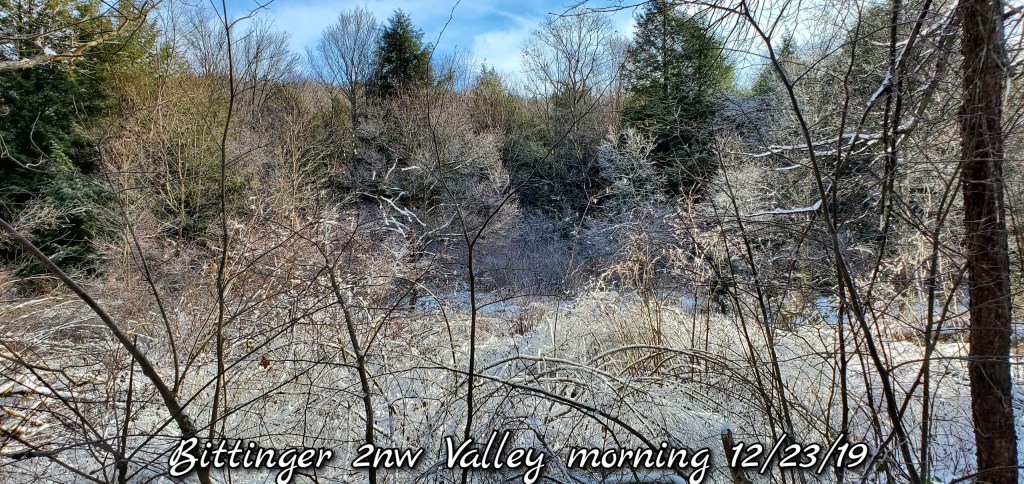
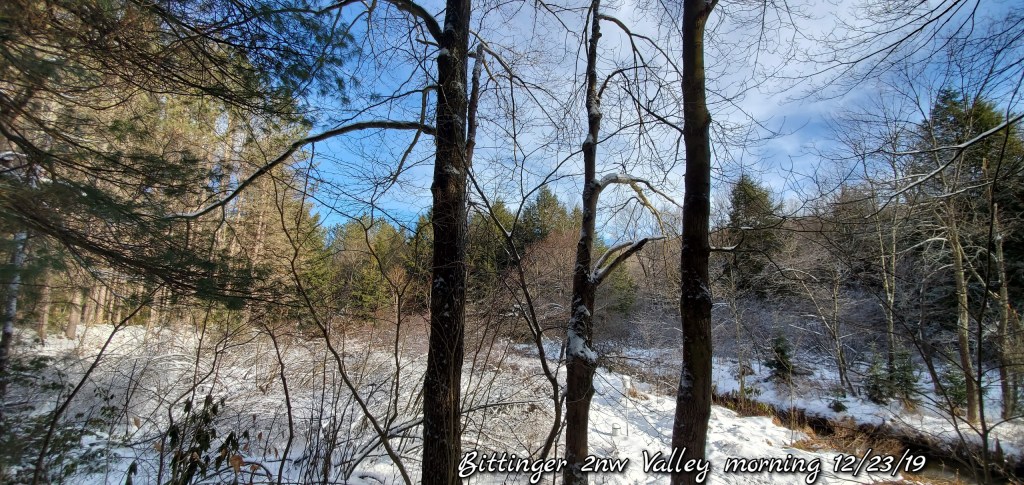
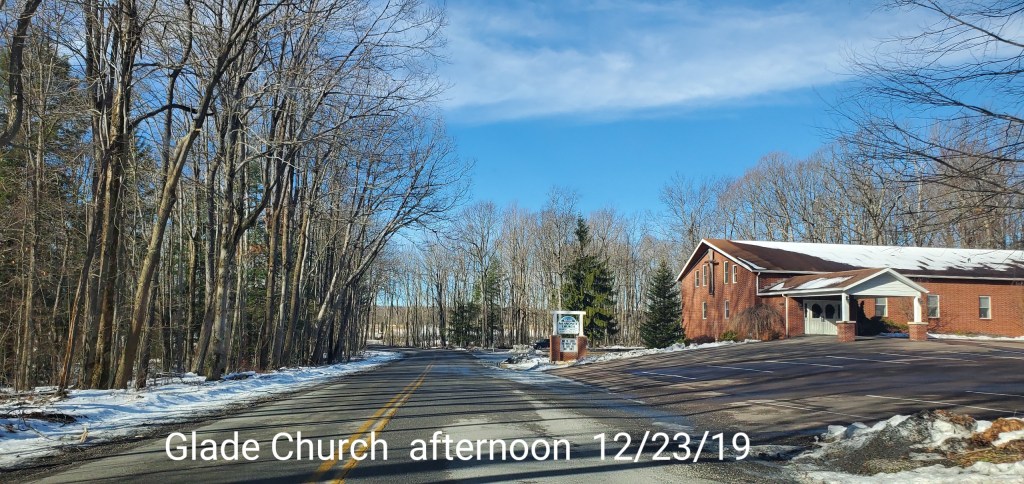
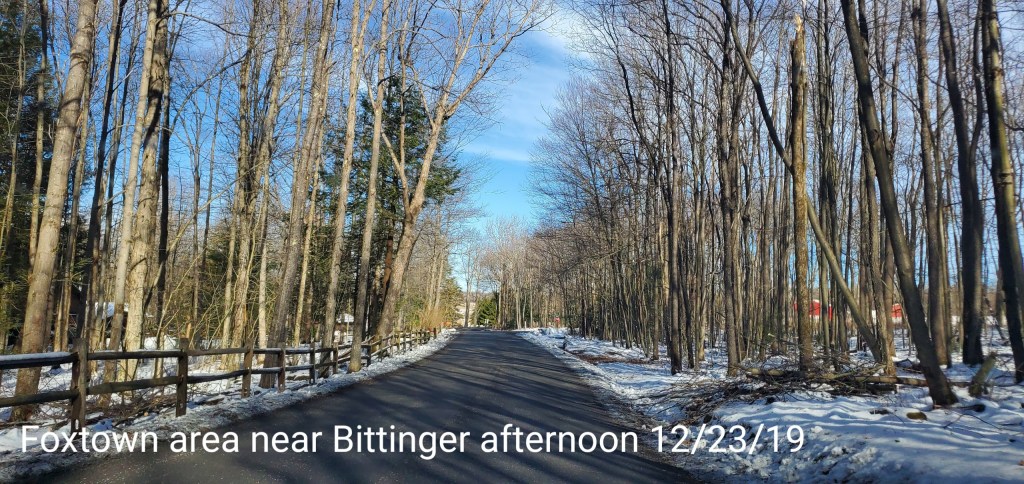
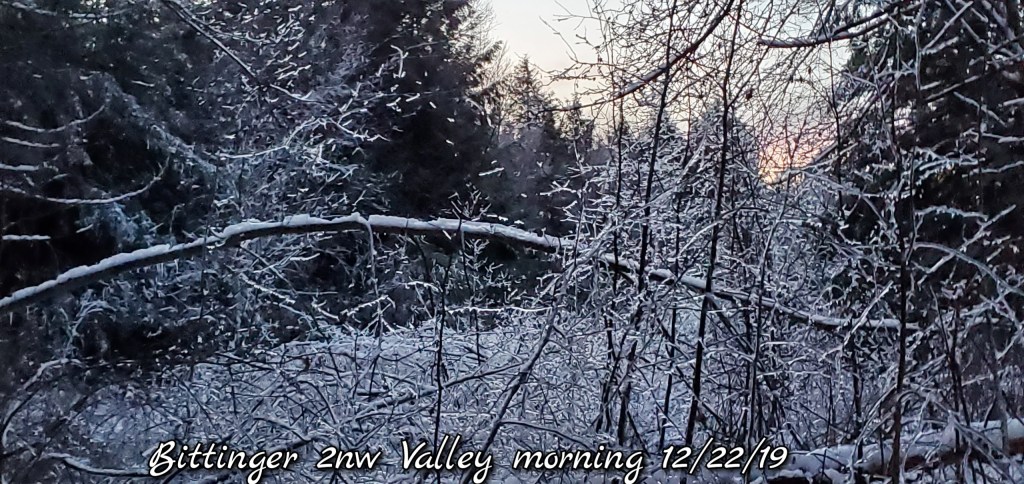
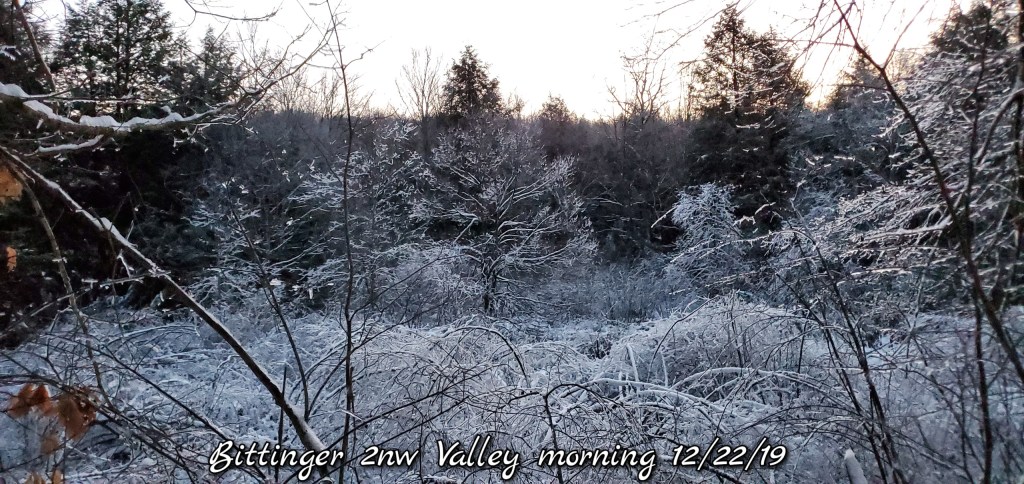
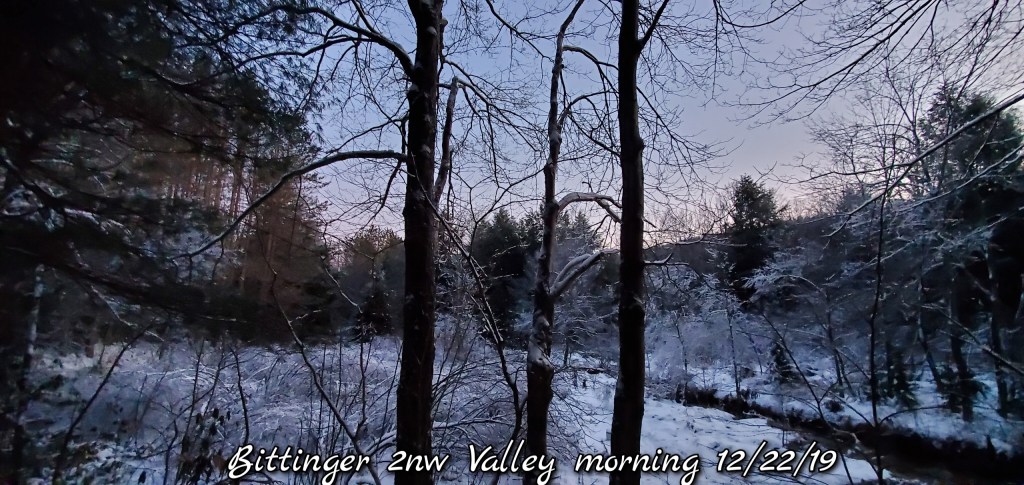
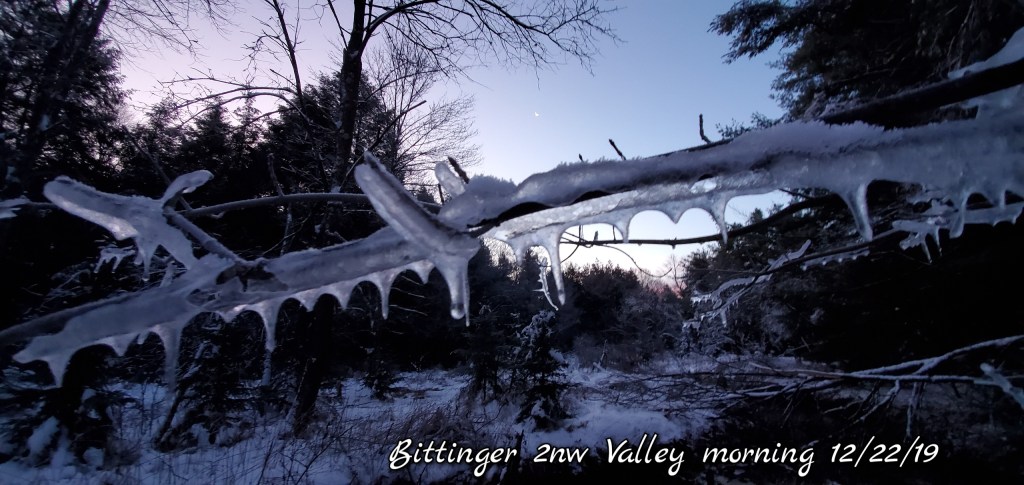
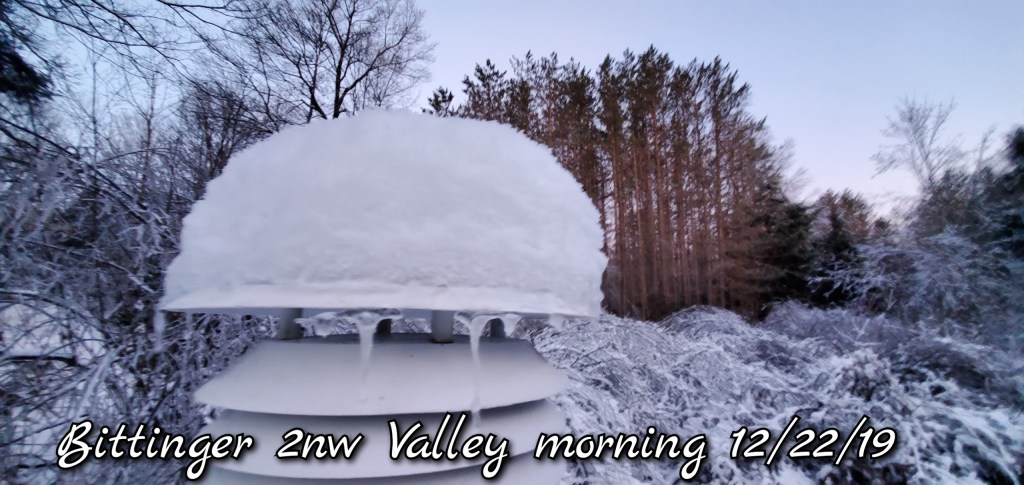
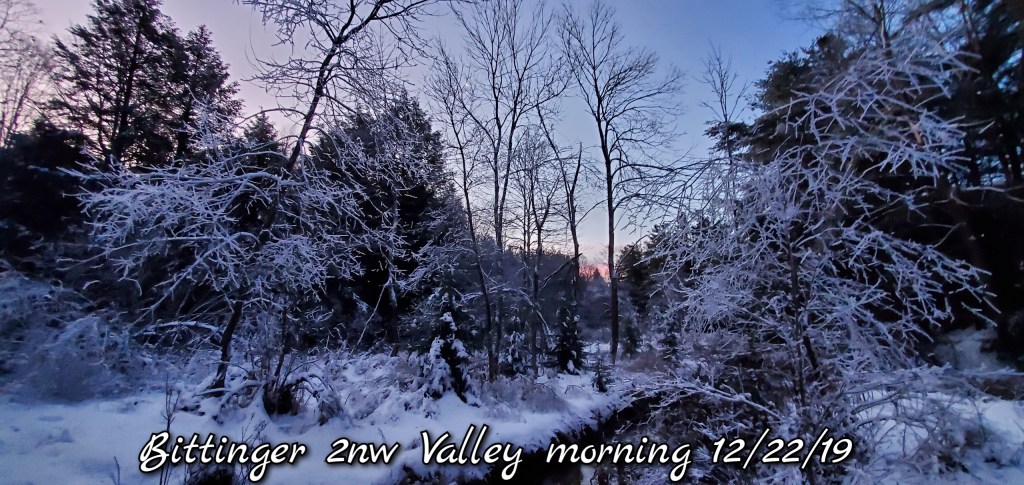
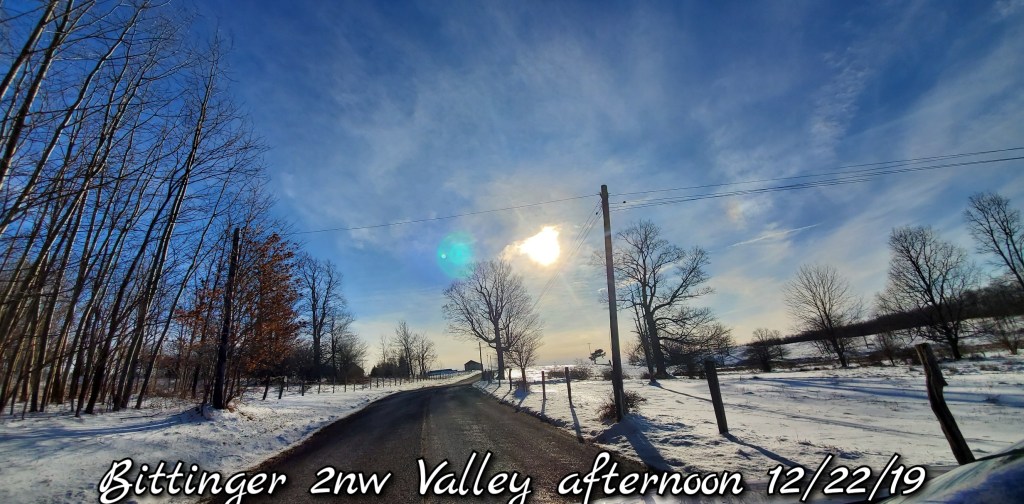
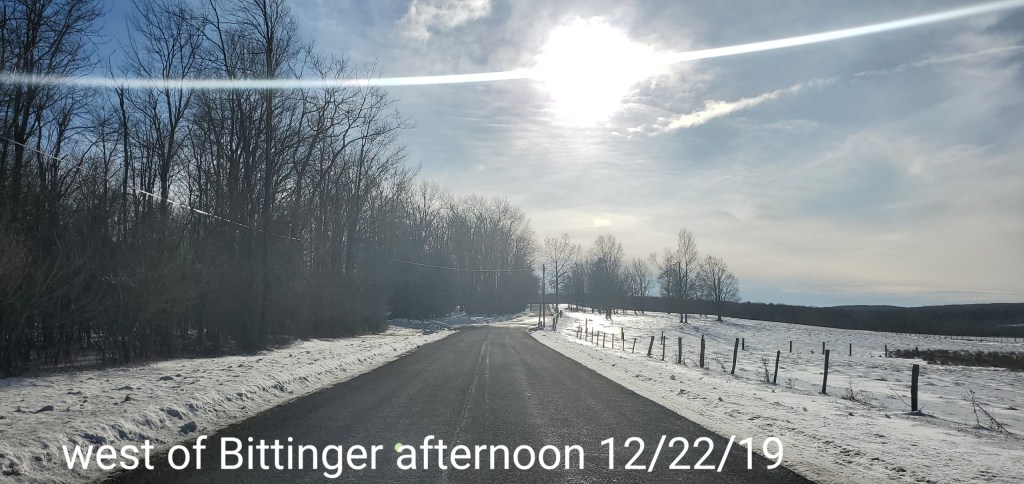
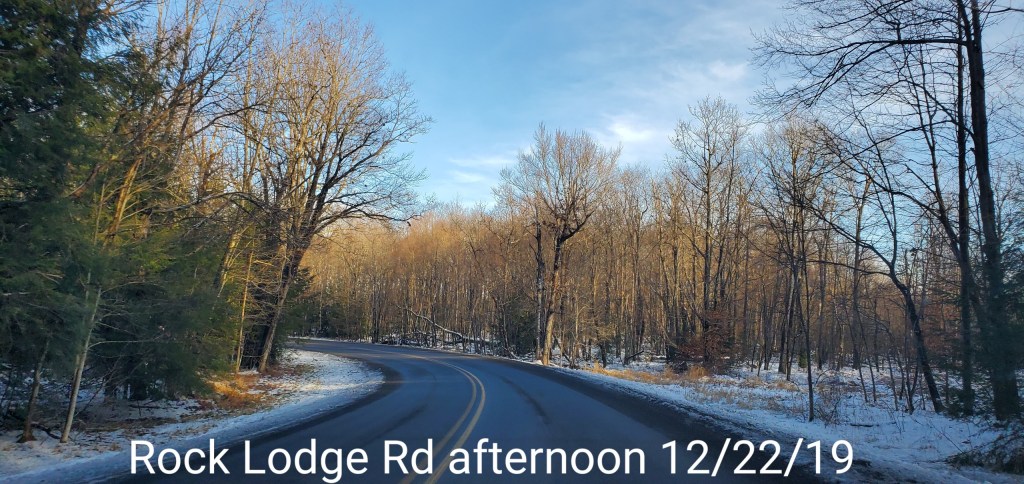
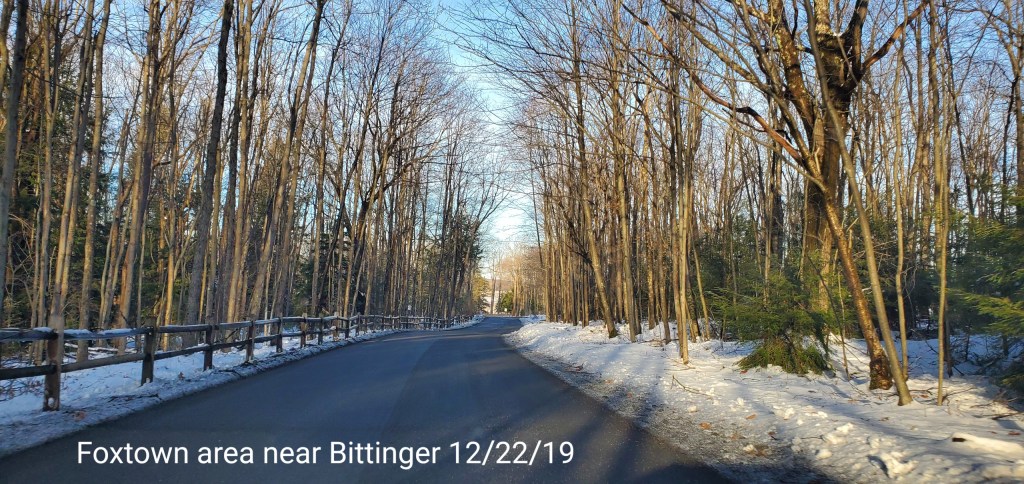
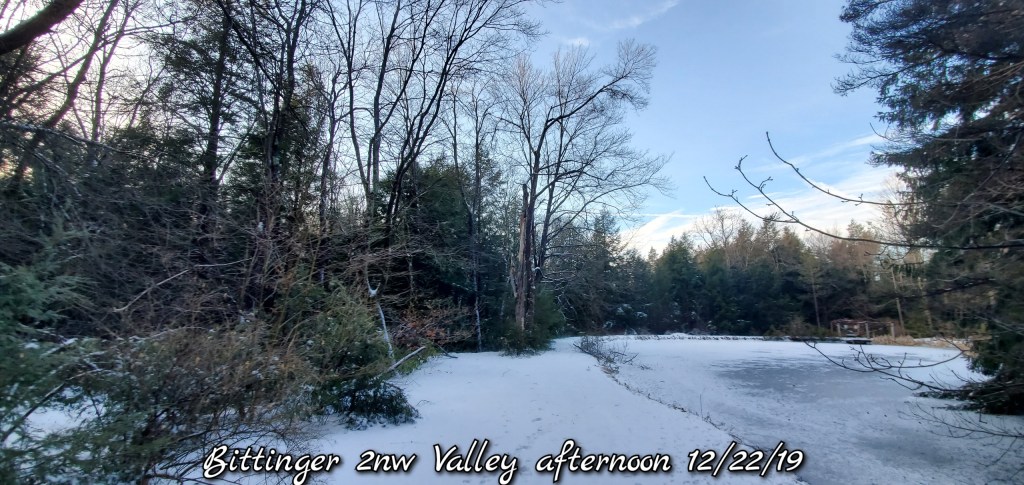
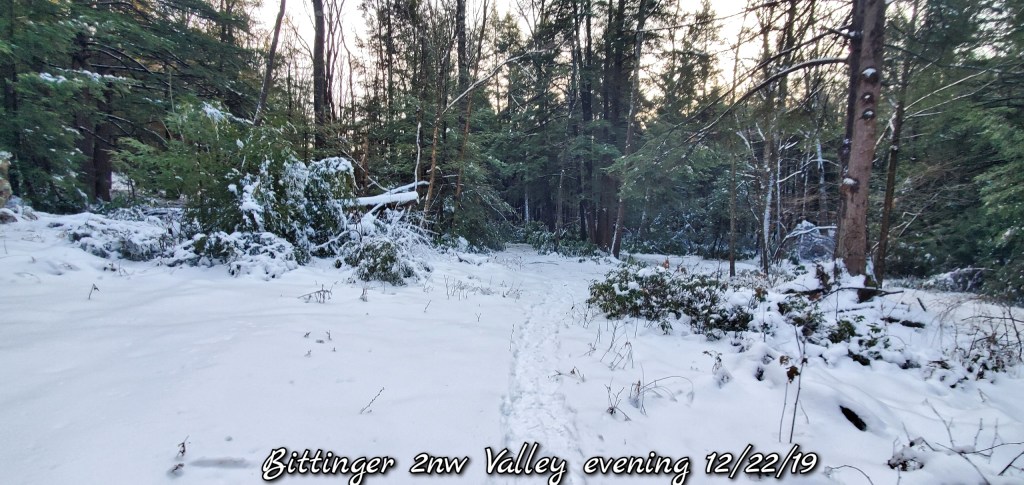
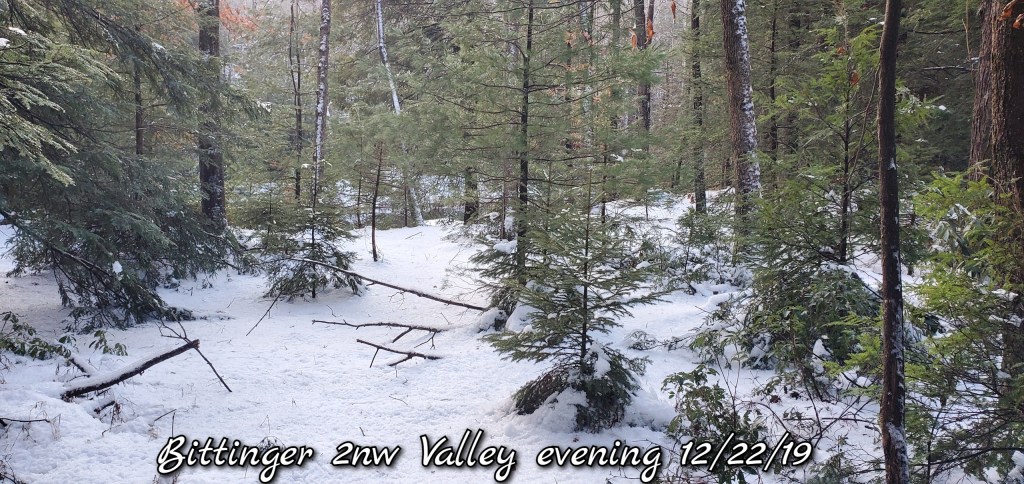
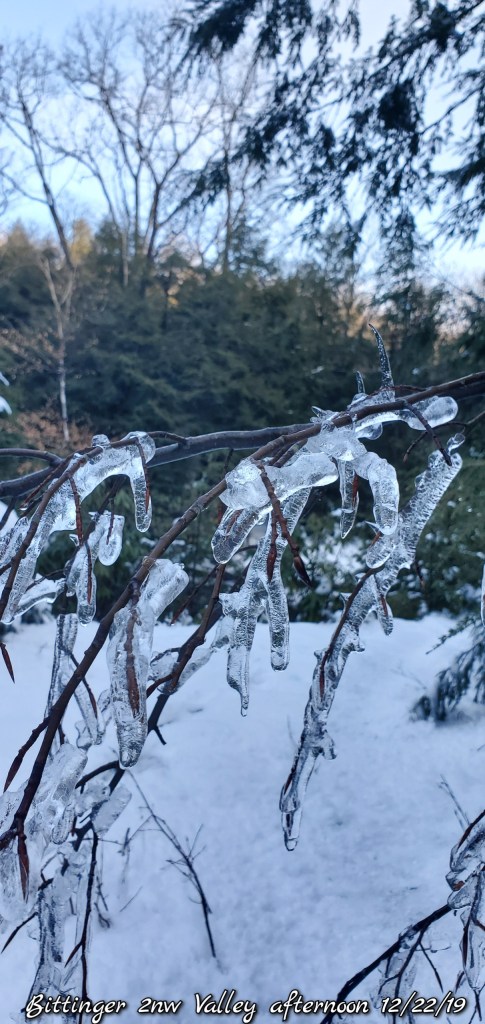
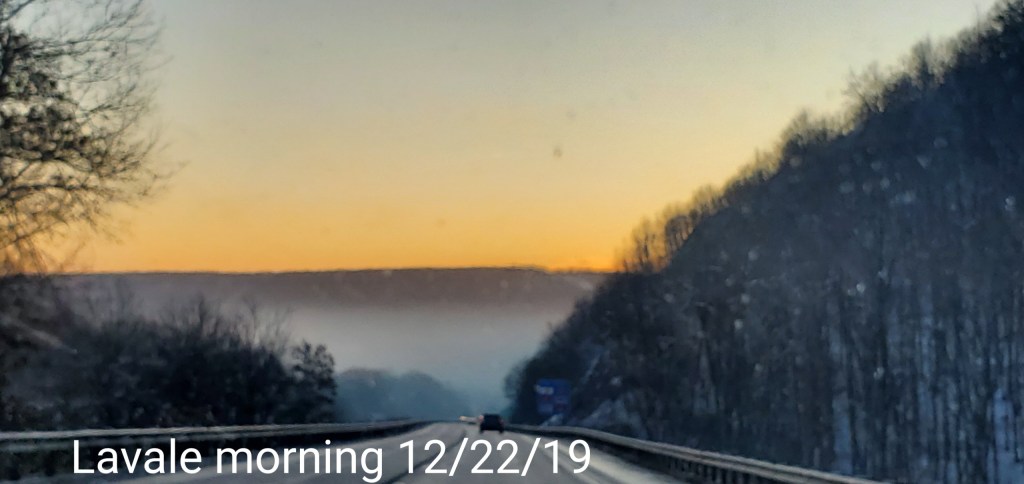
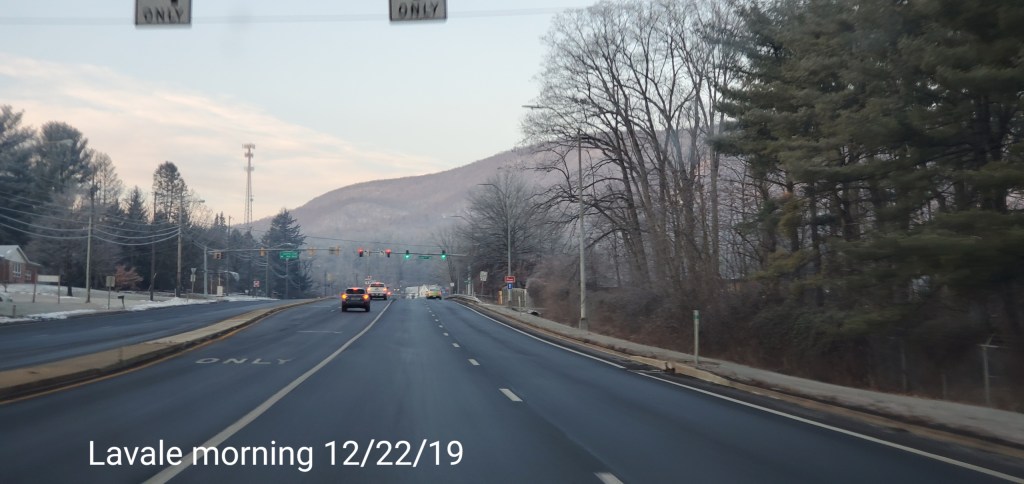
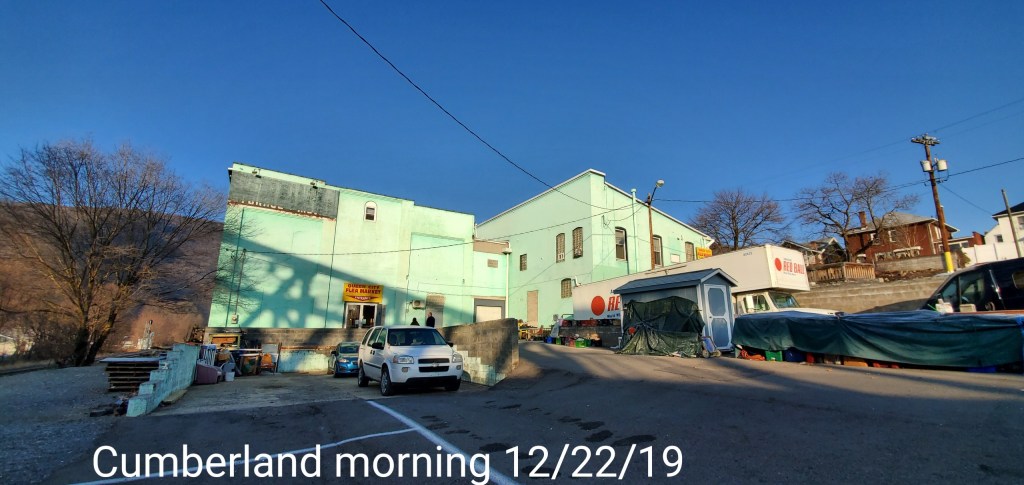
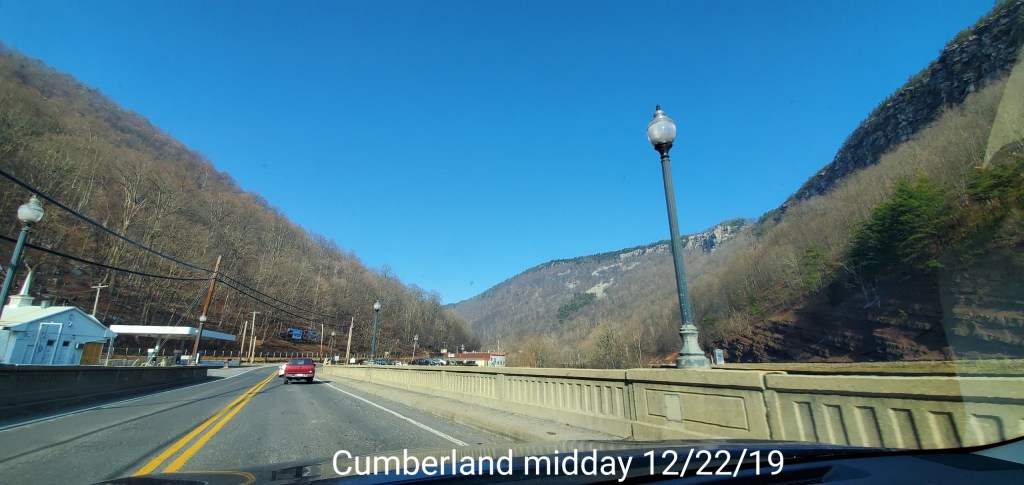
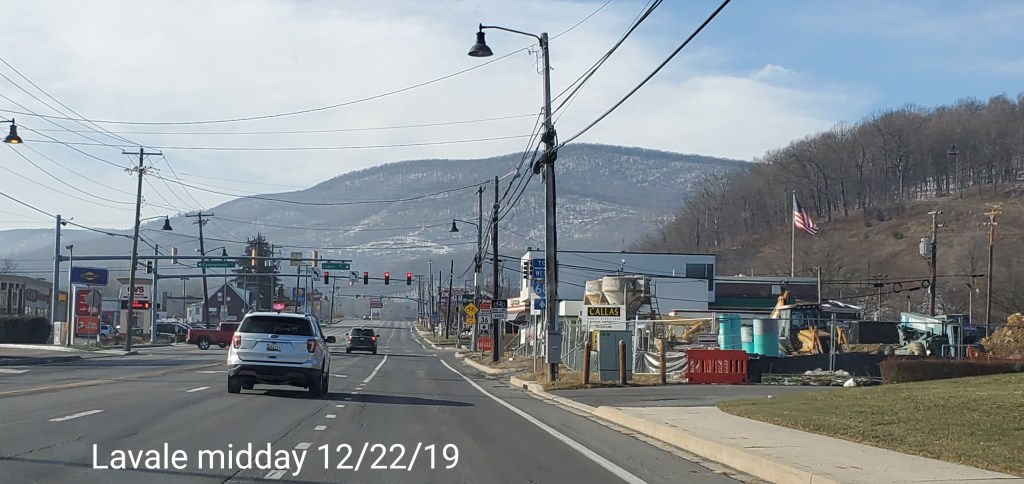
Pics today-
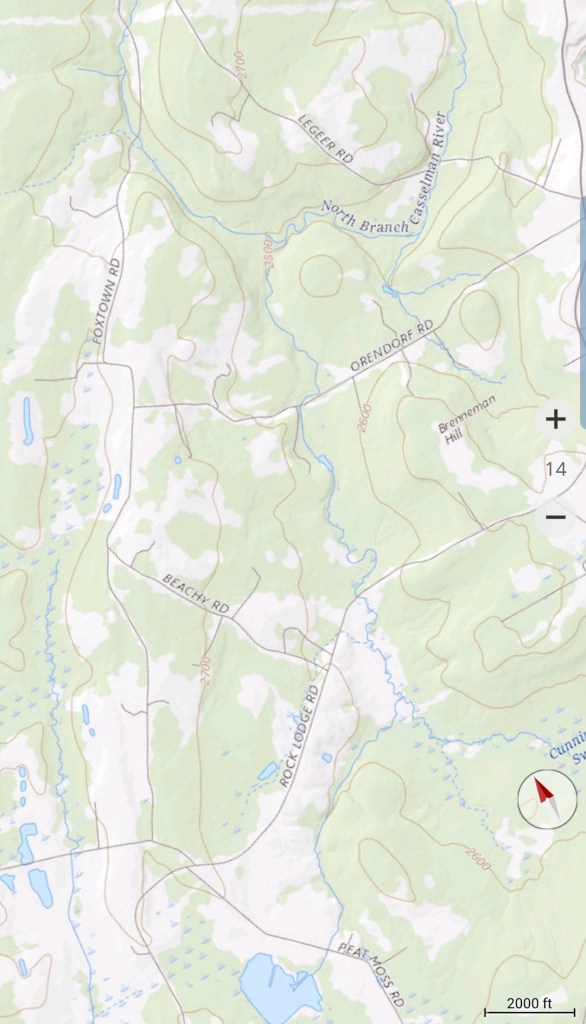
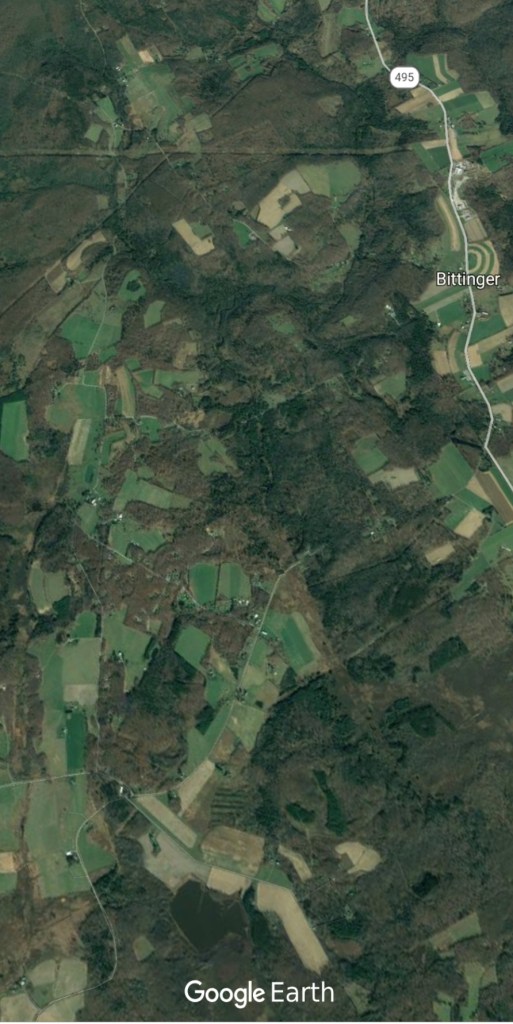
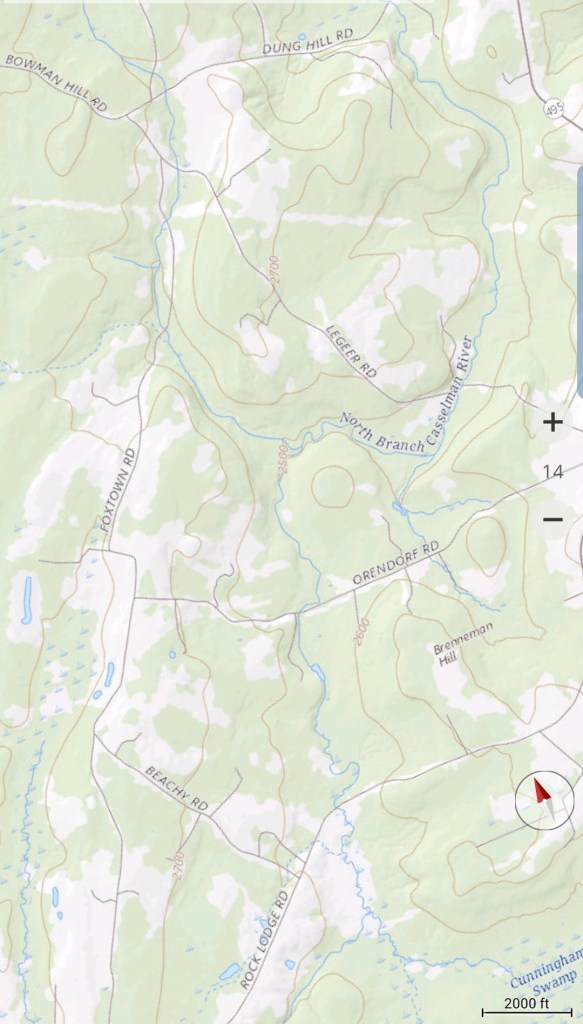
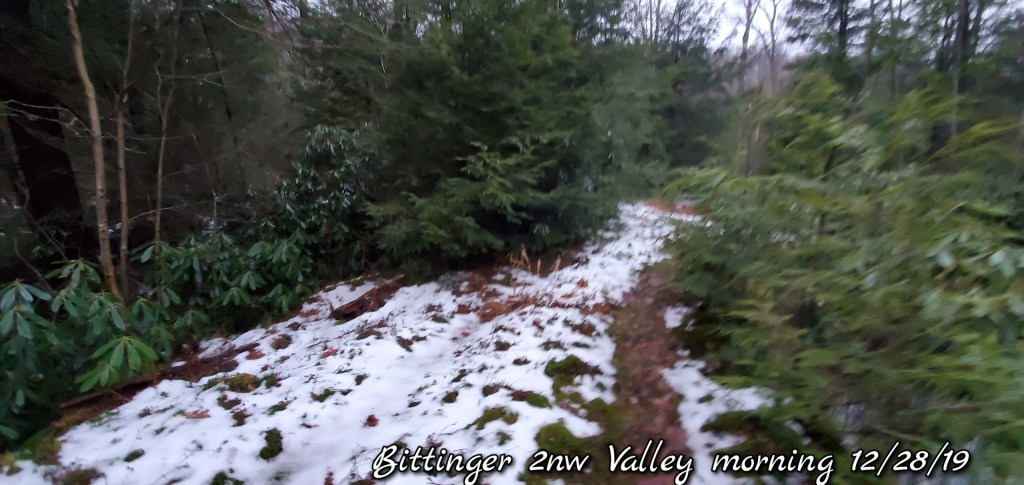
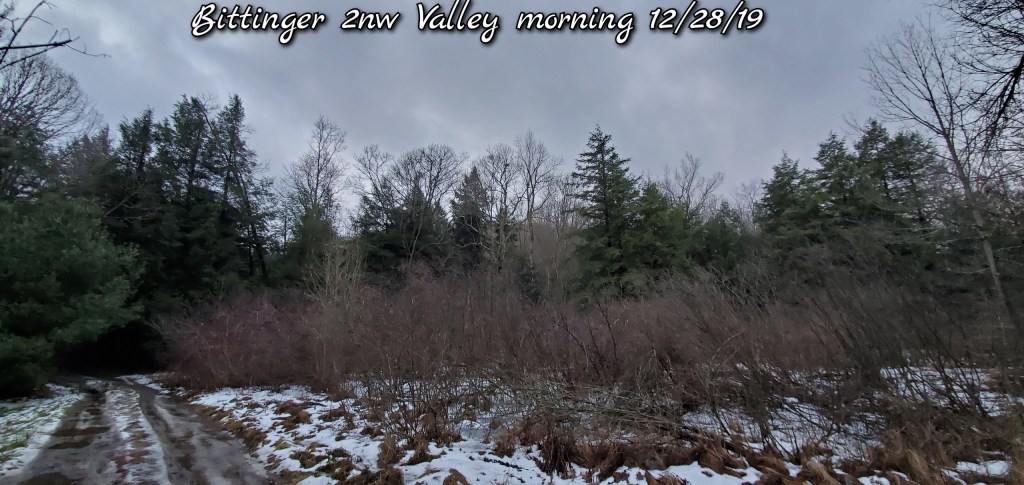
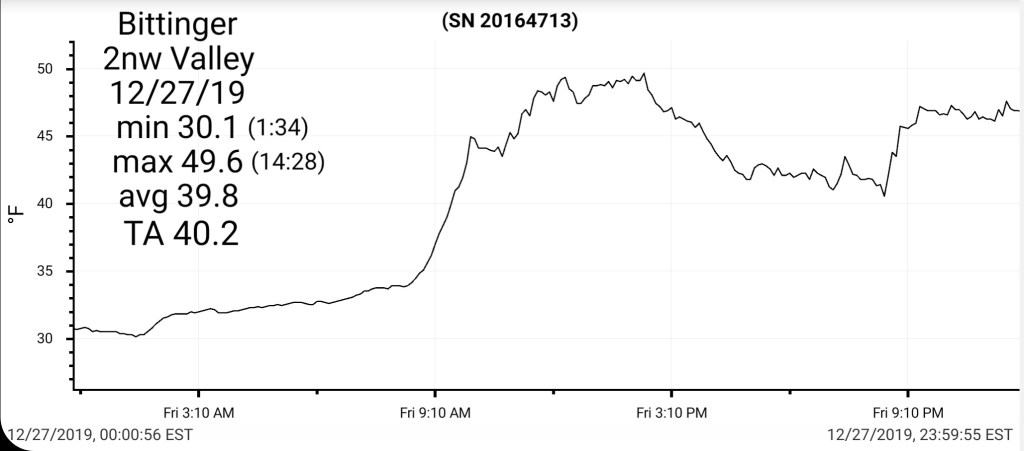
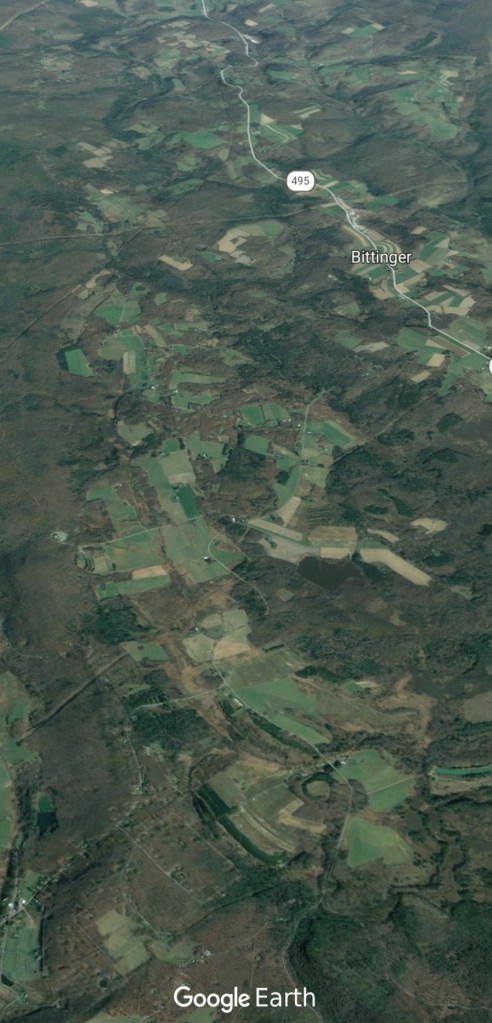
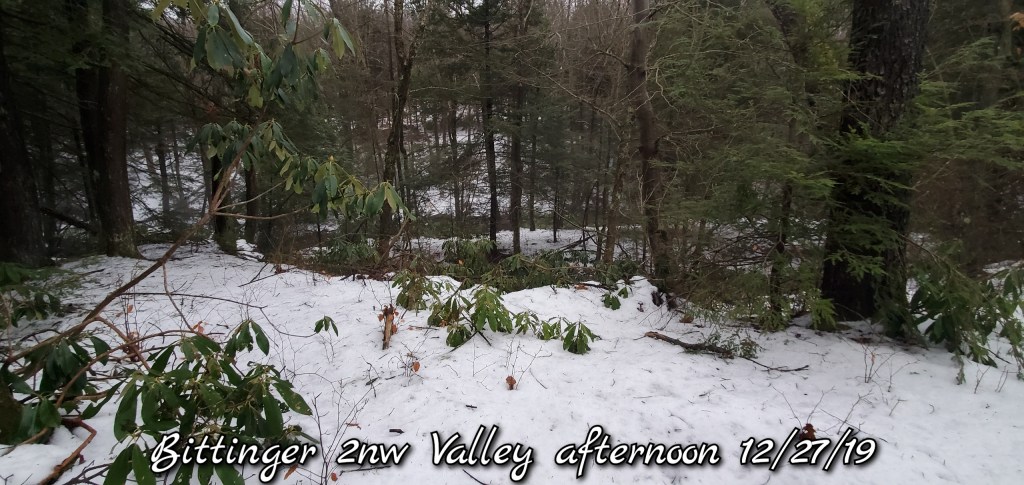
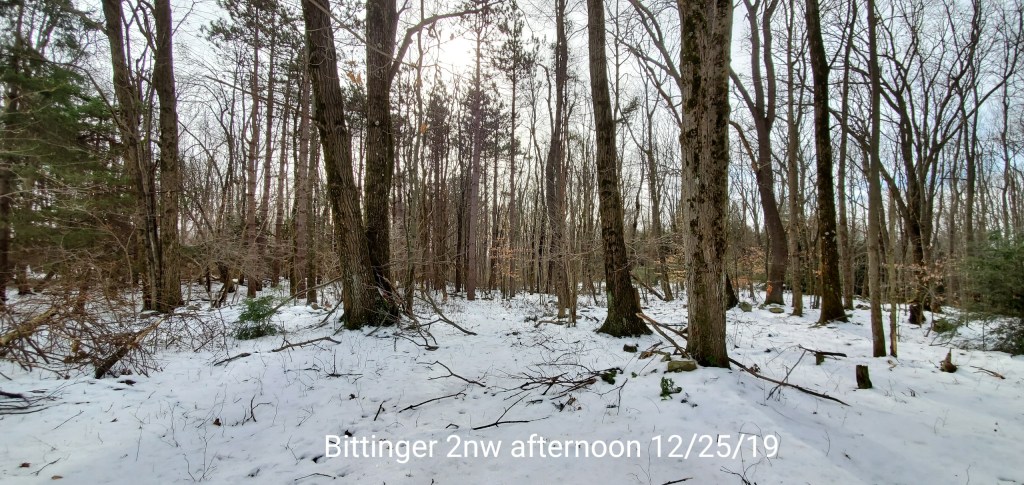
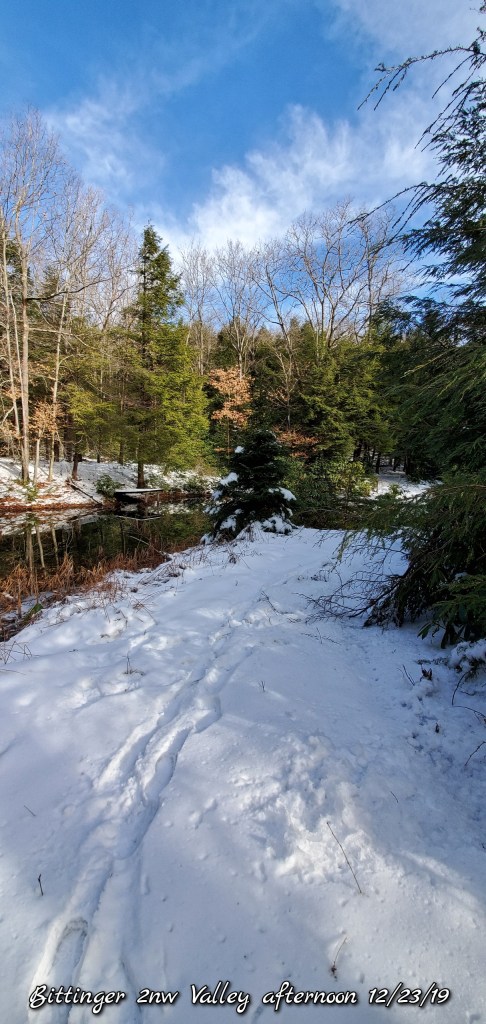
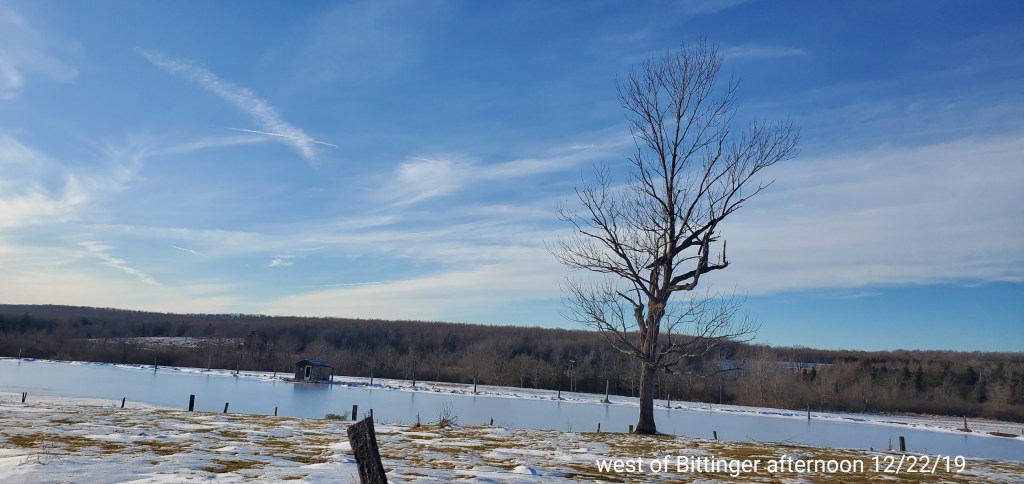
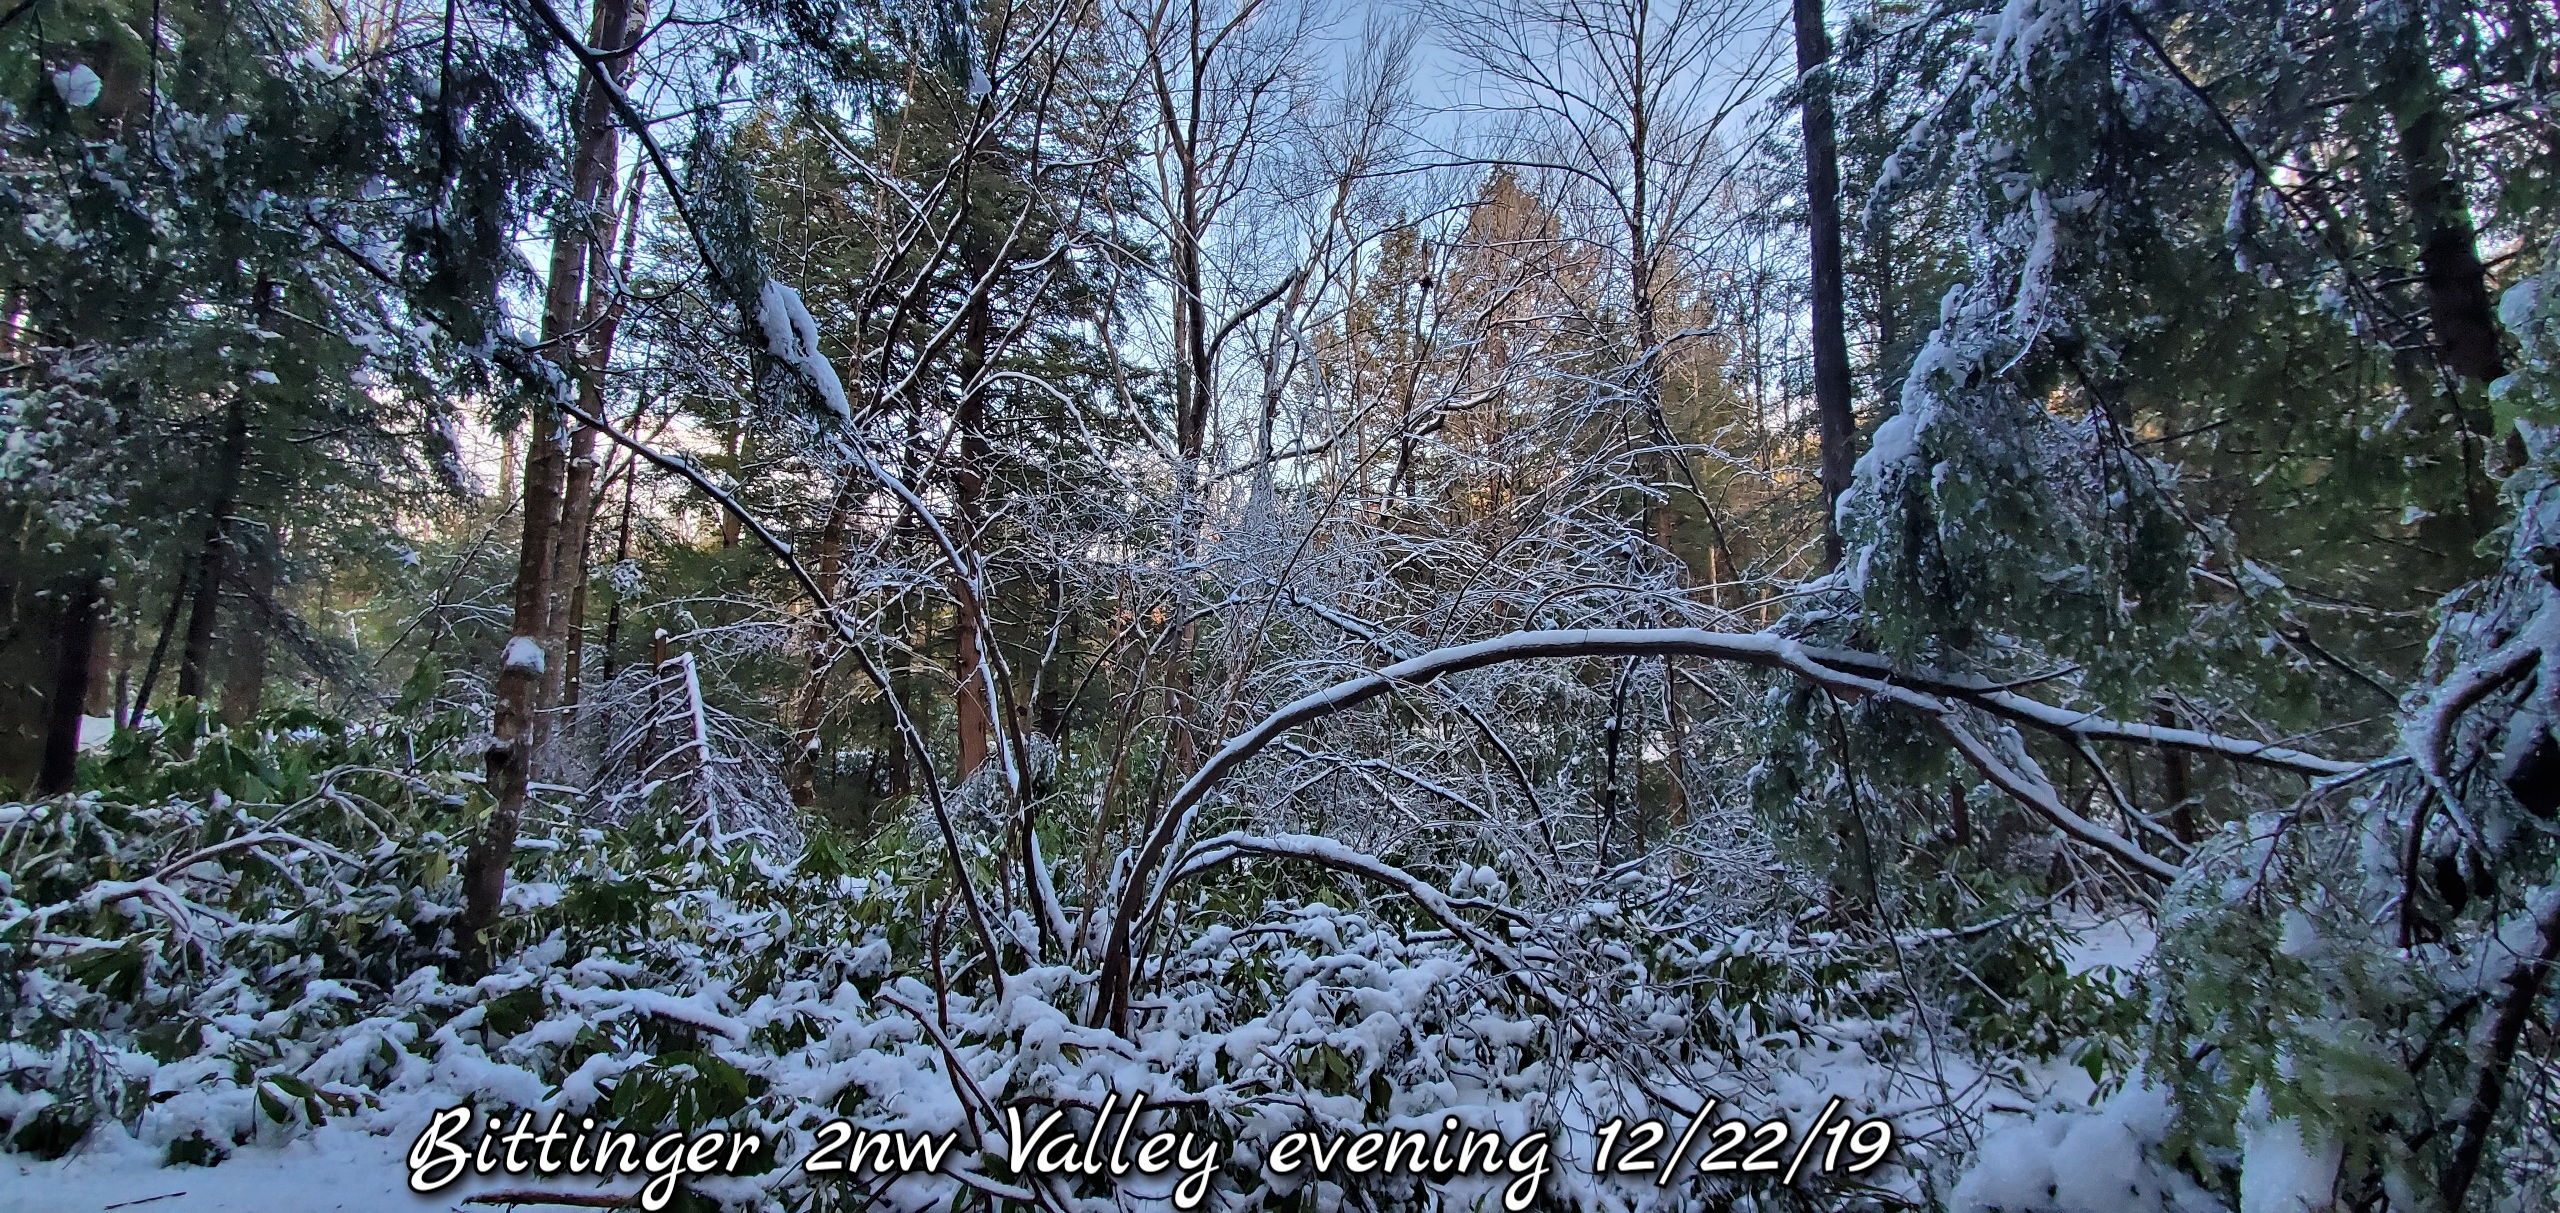
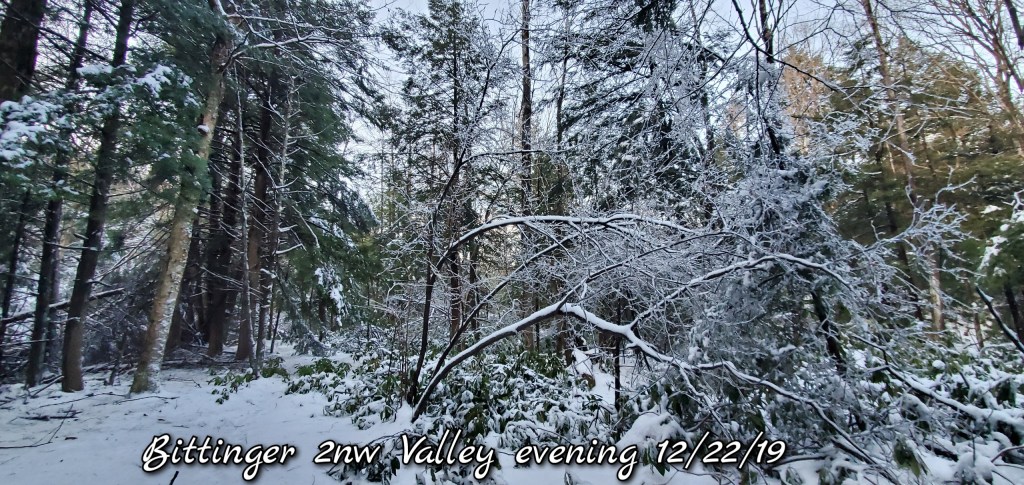
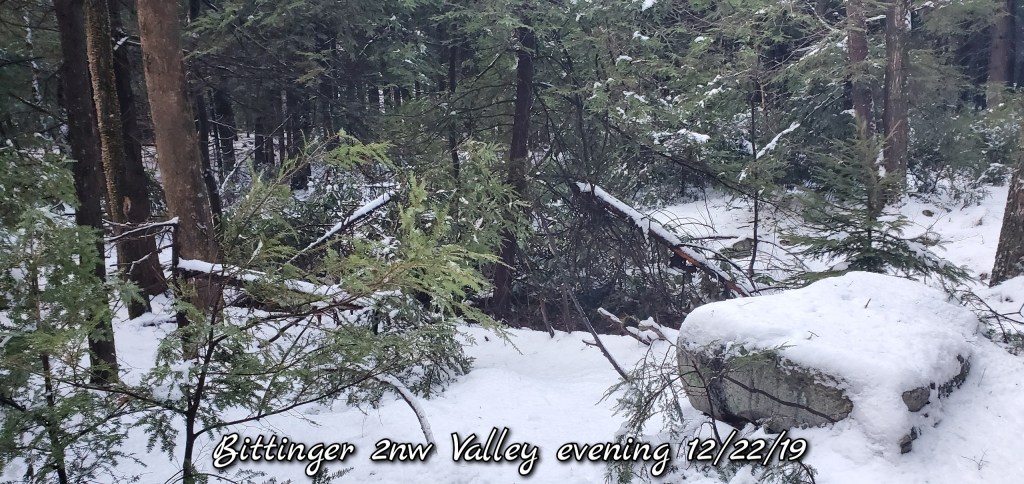
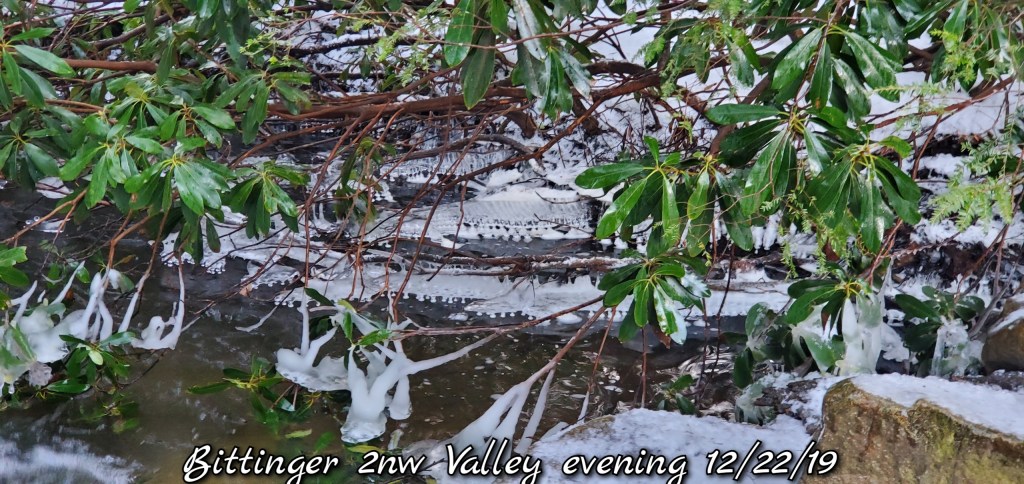
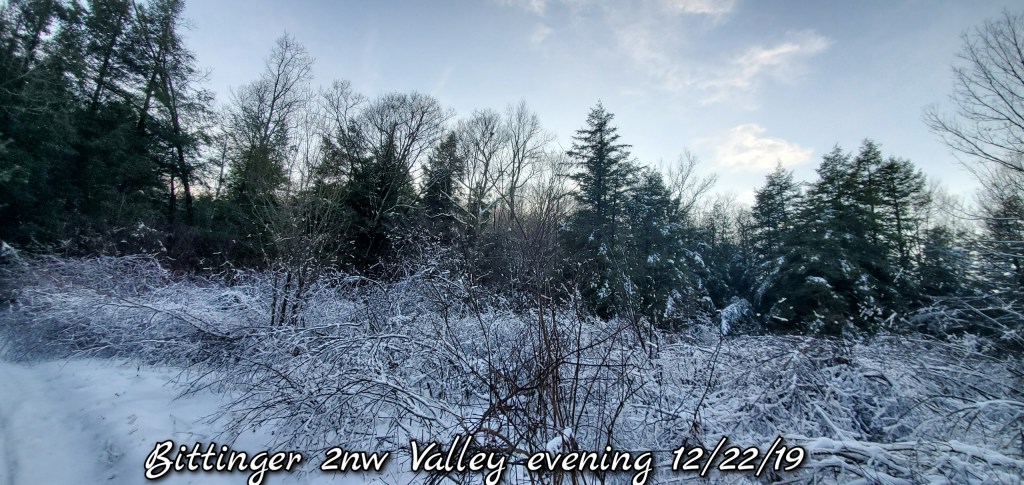
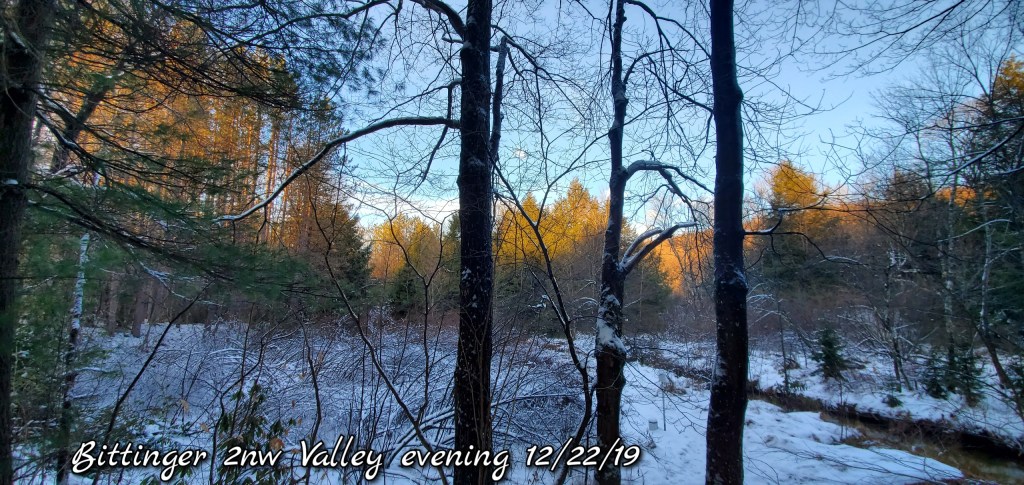
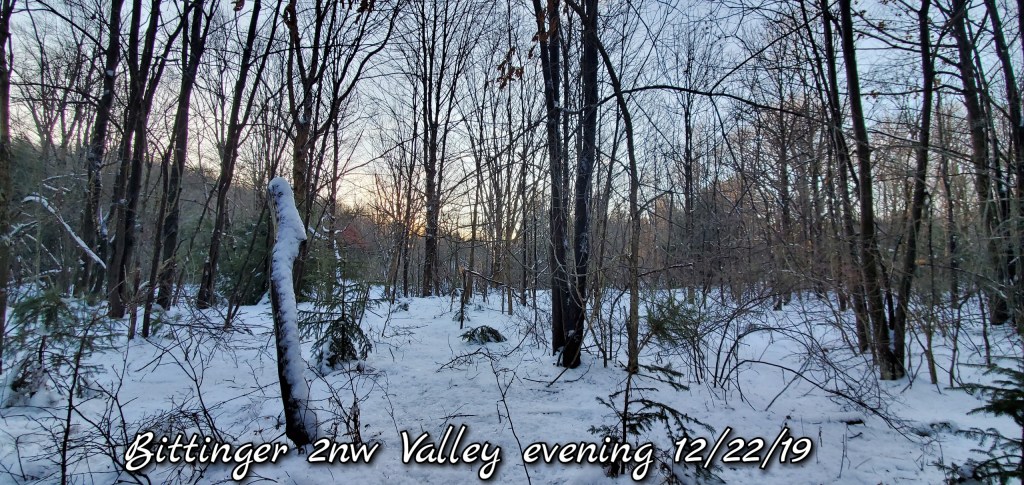
Bittinger area
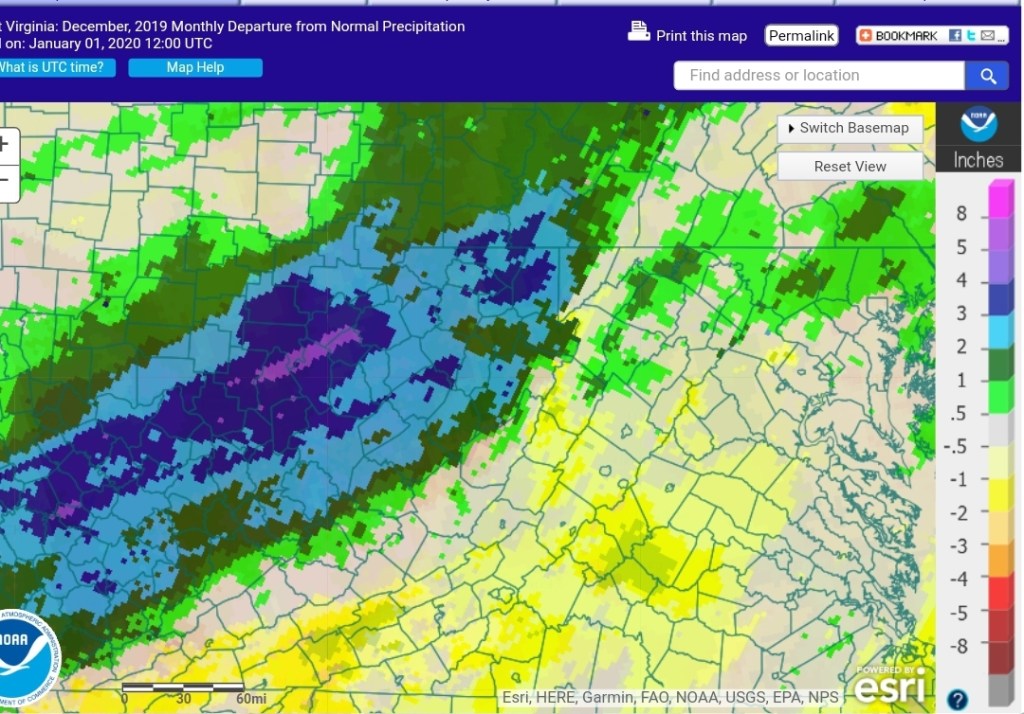
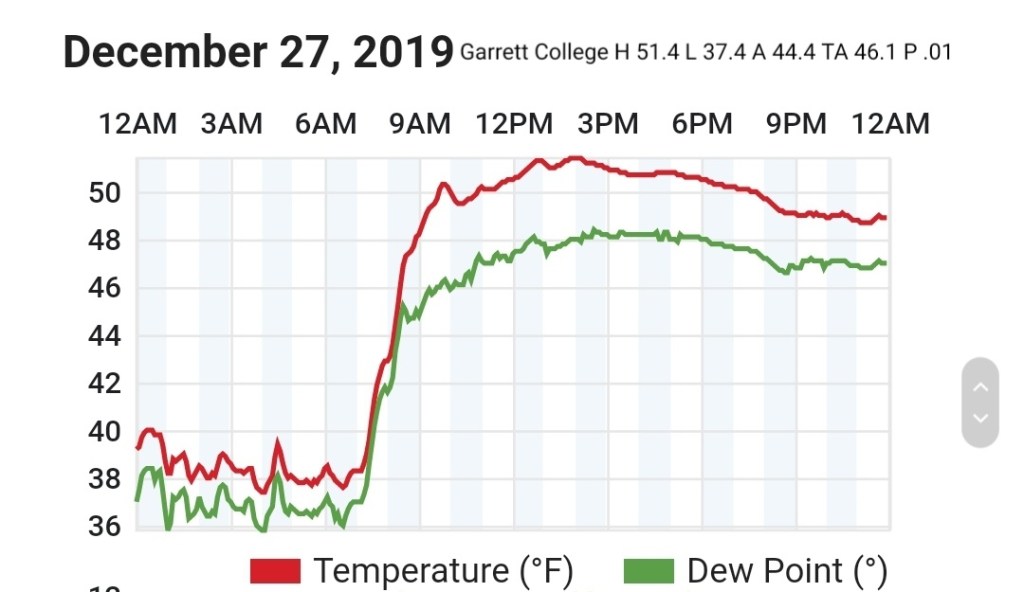
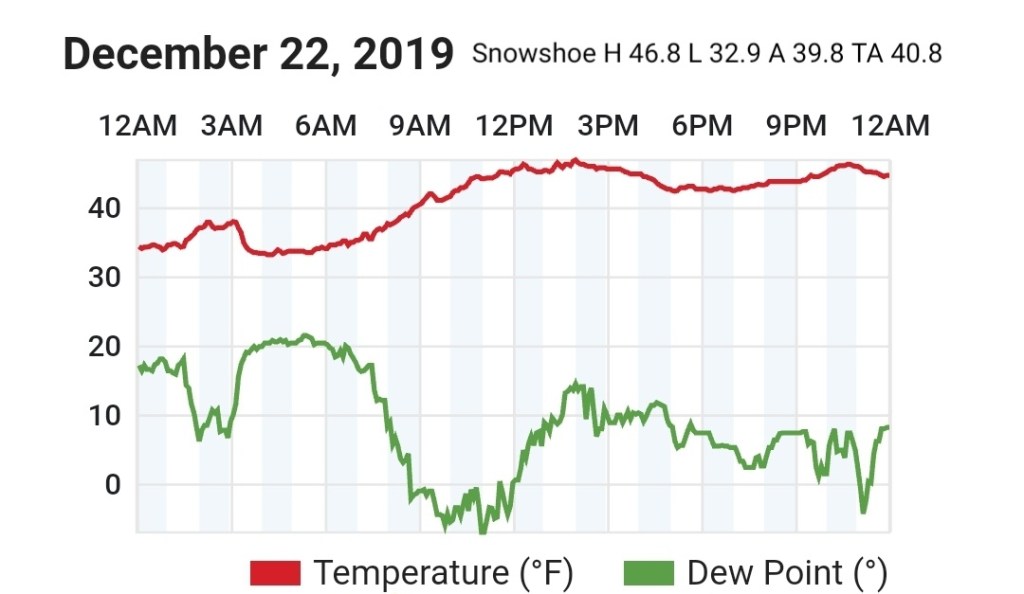
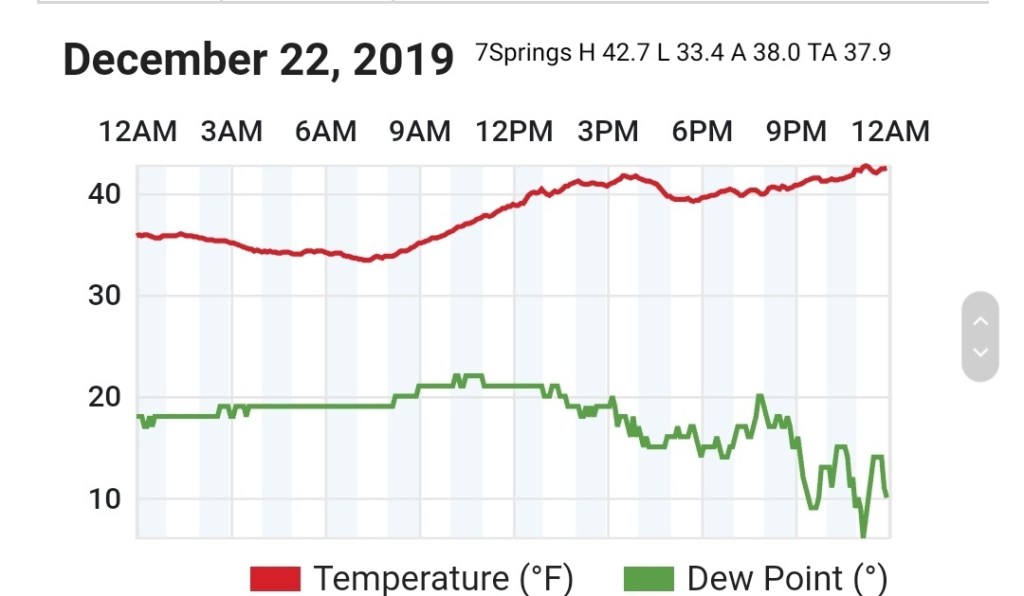
December 2019
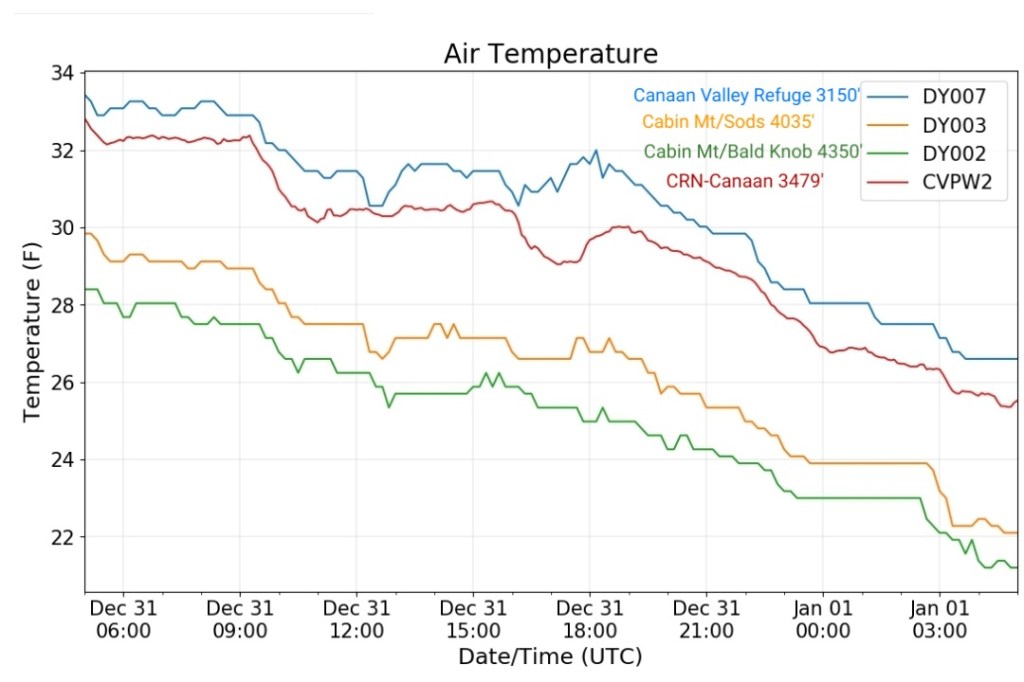
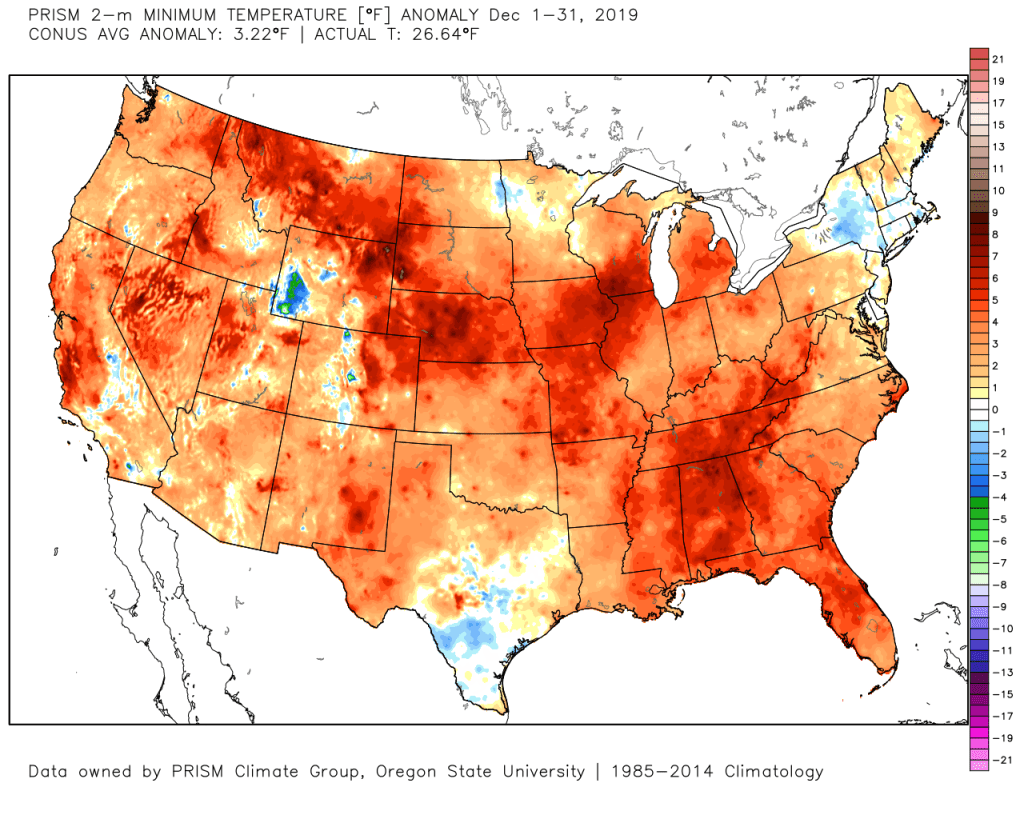
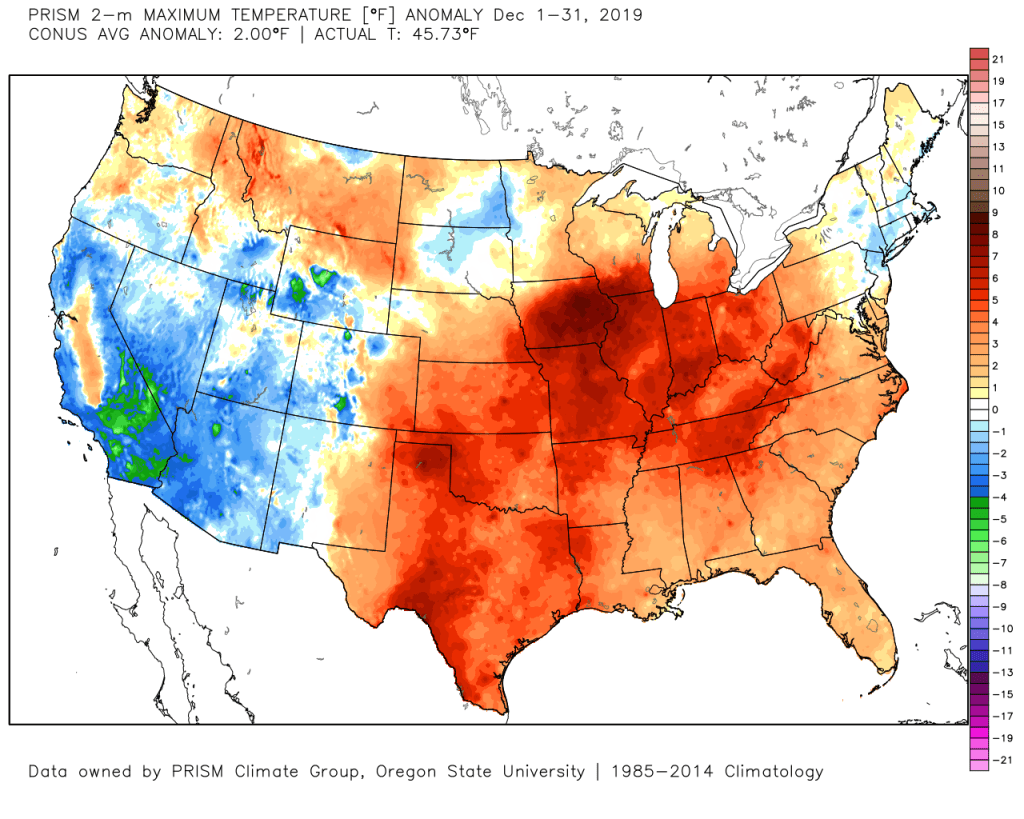
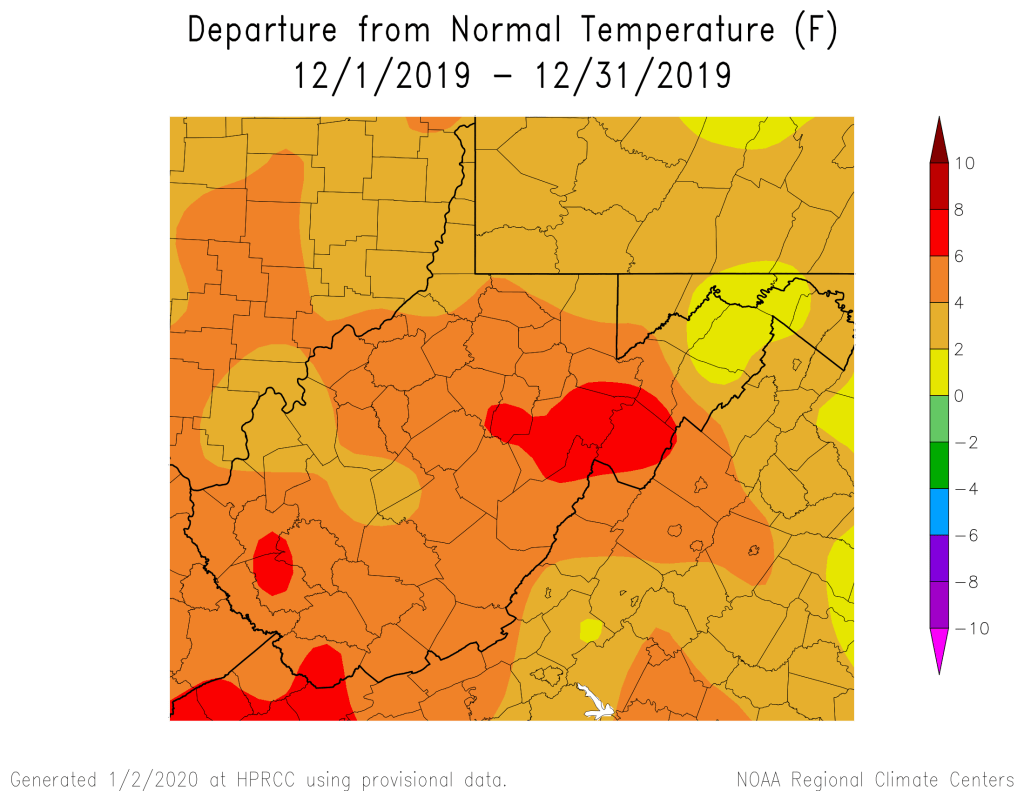
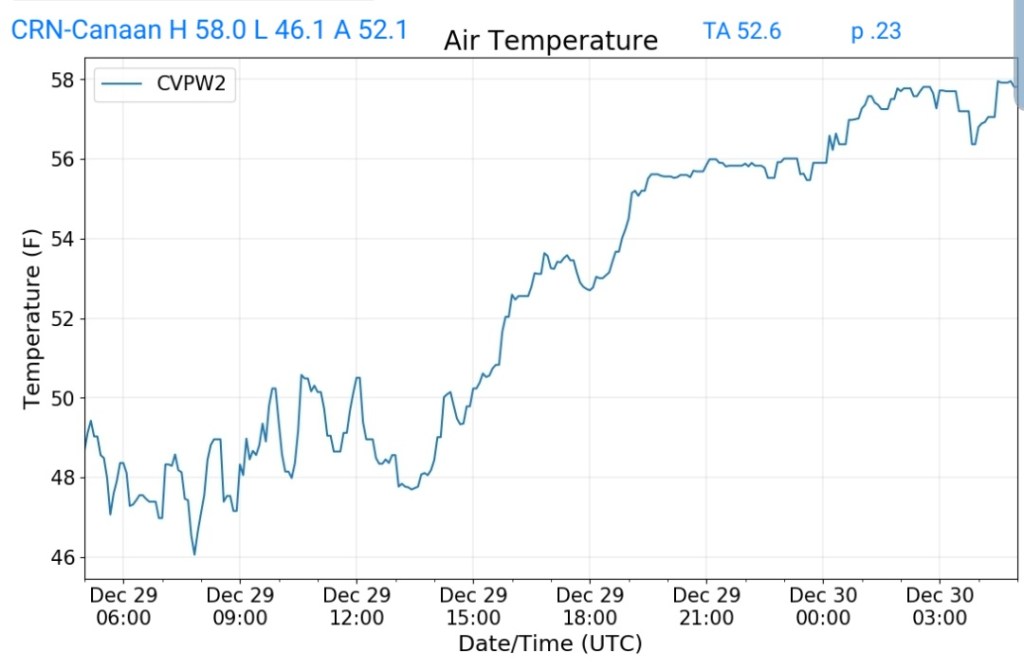
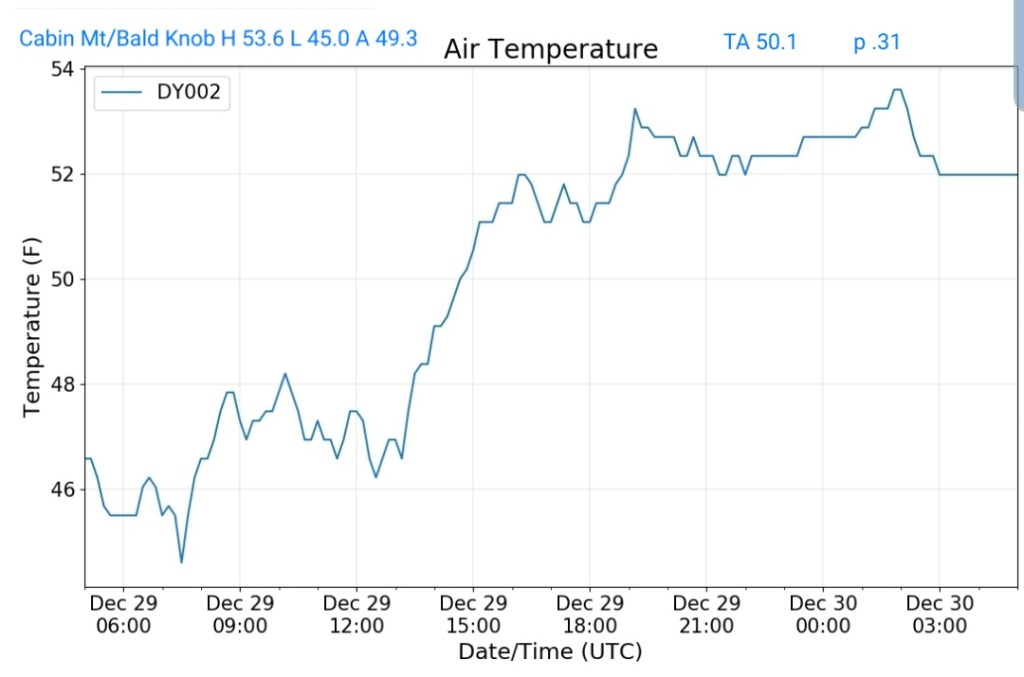
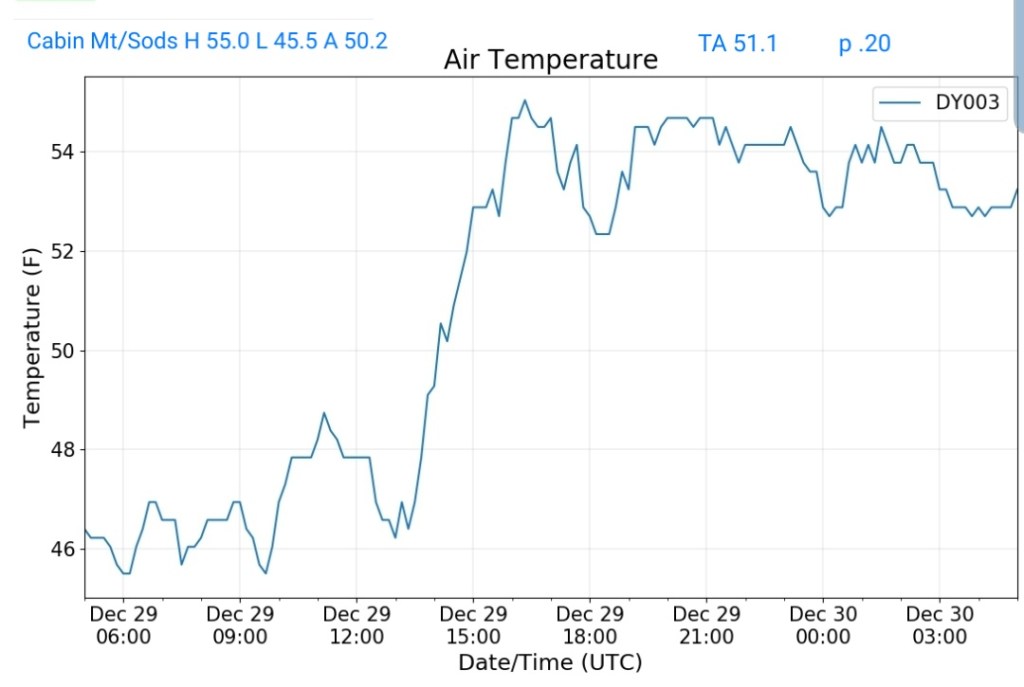
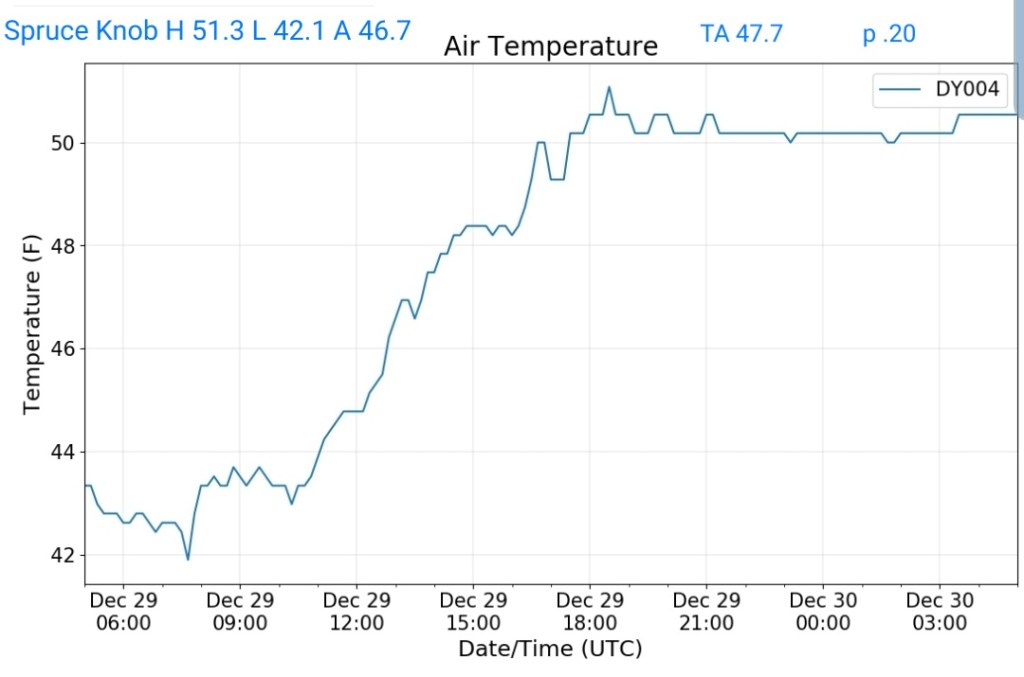
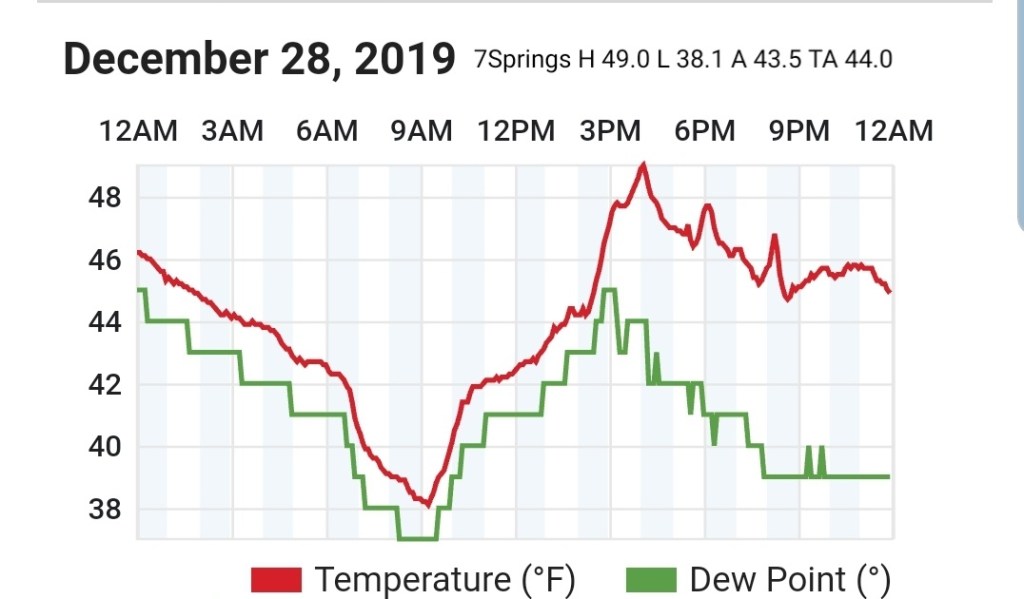
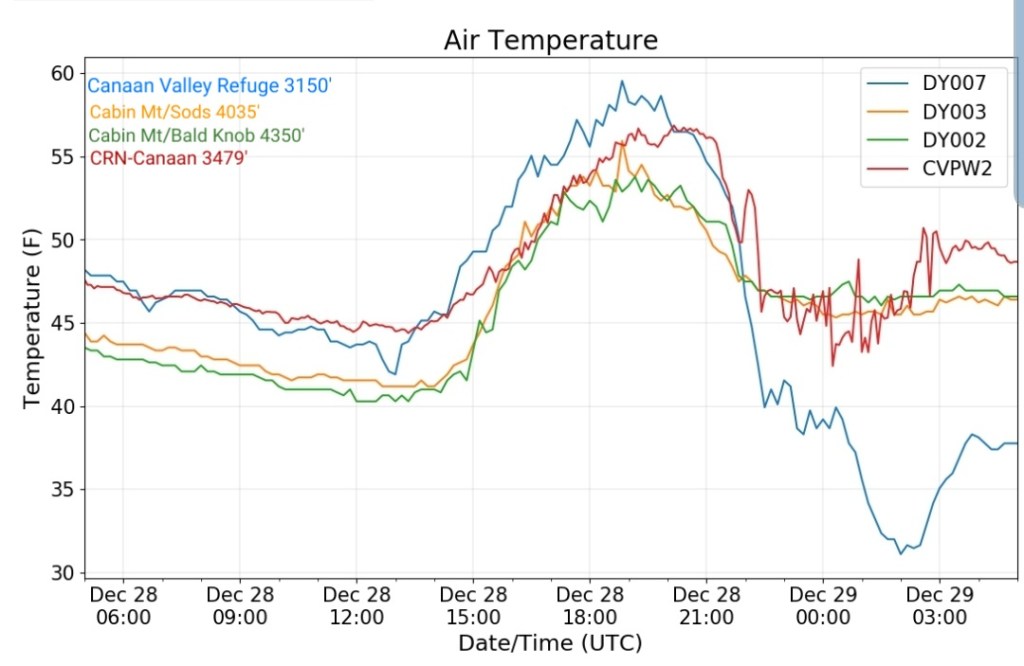
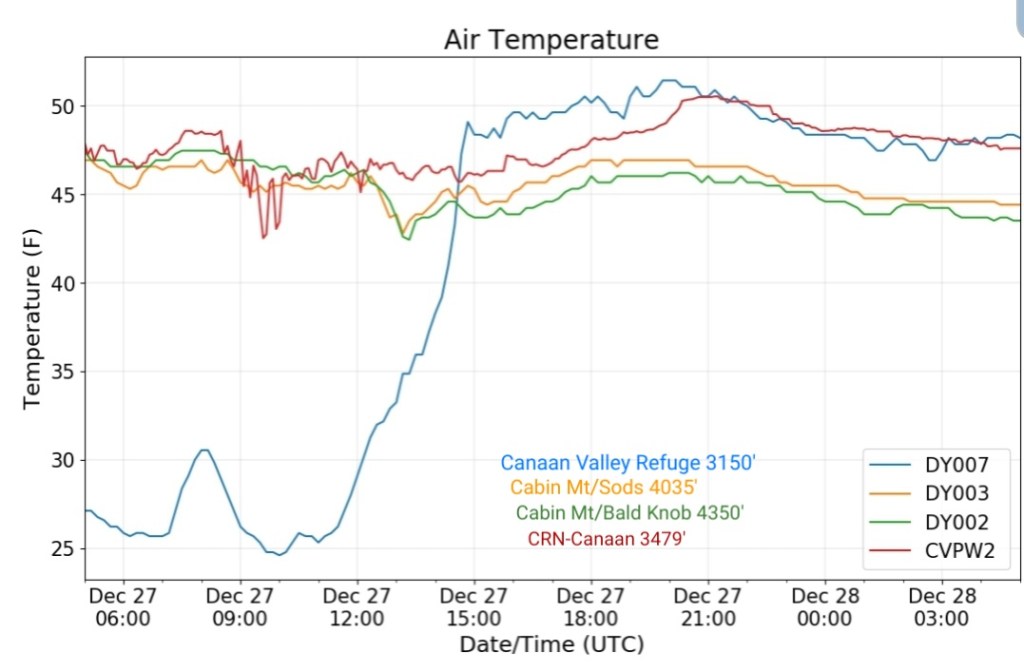
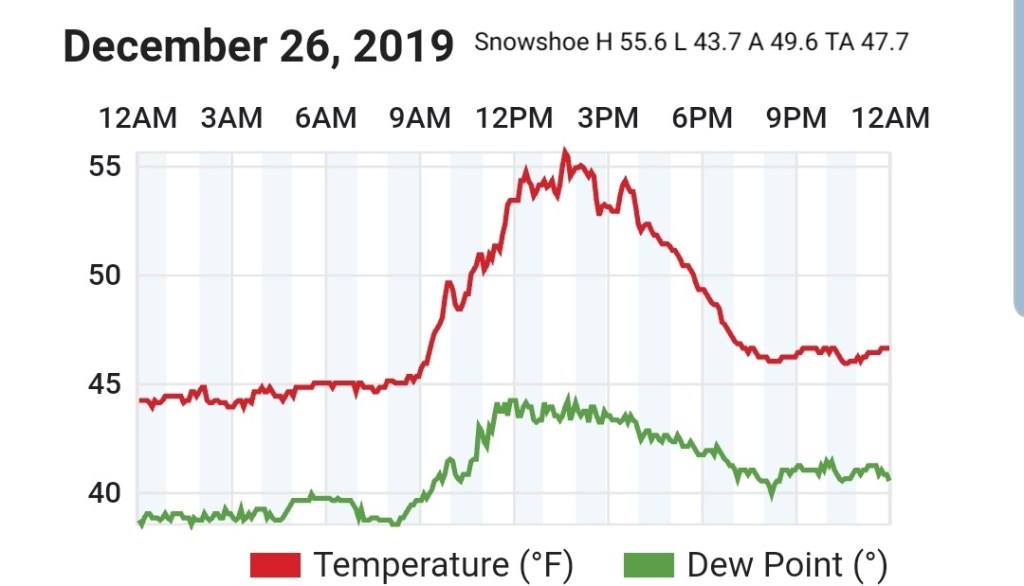
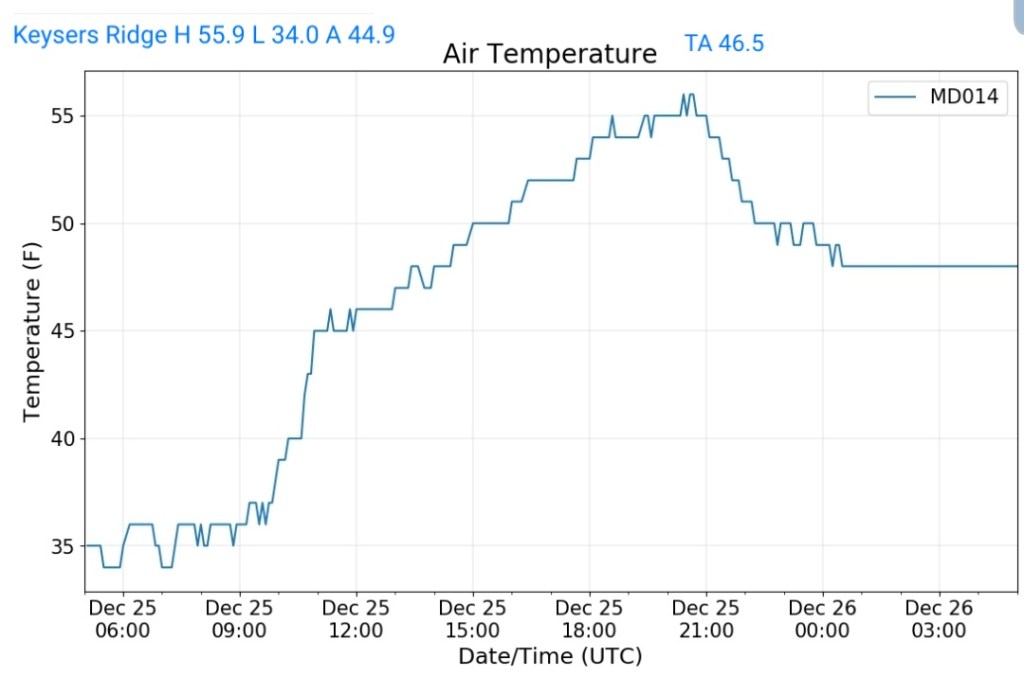
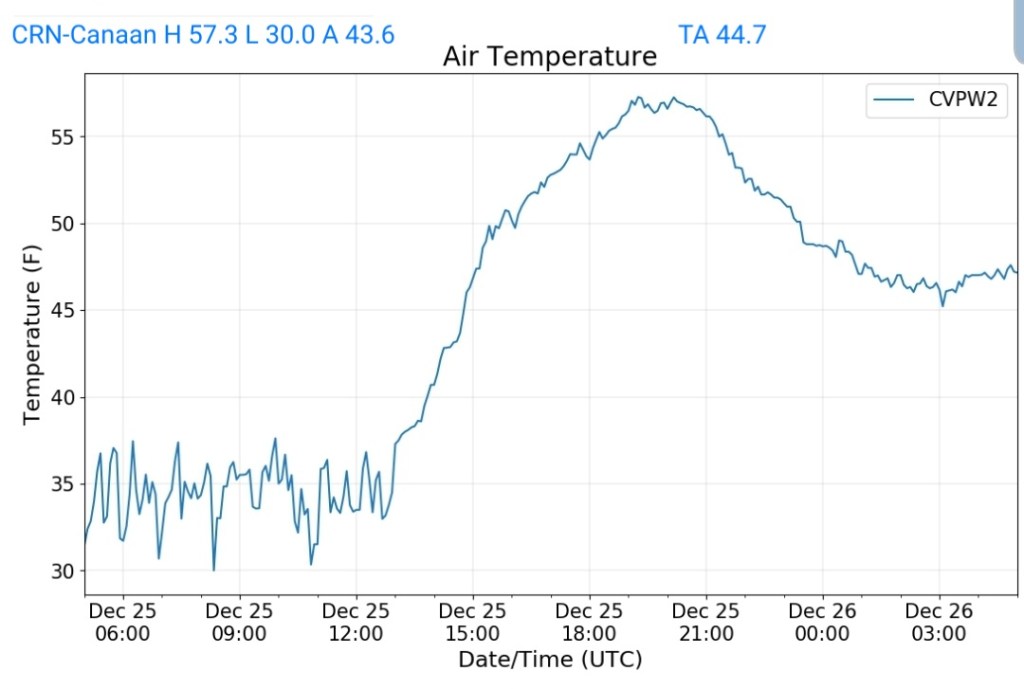
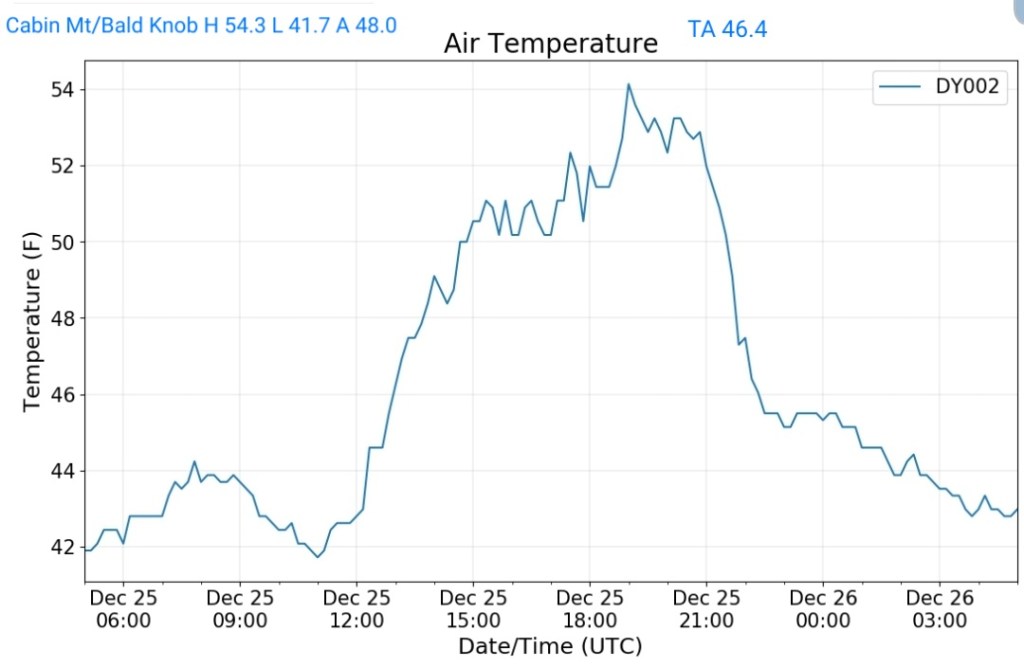
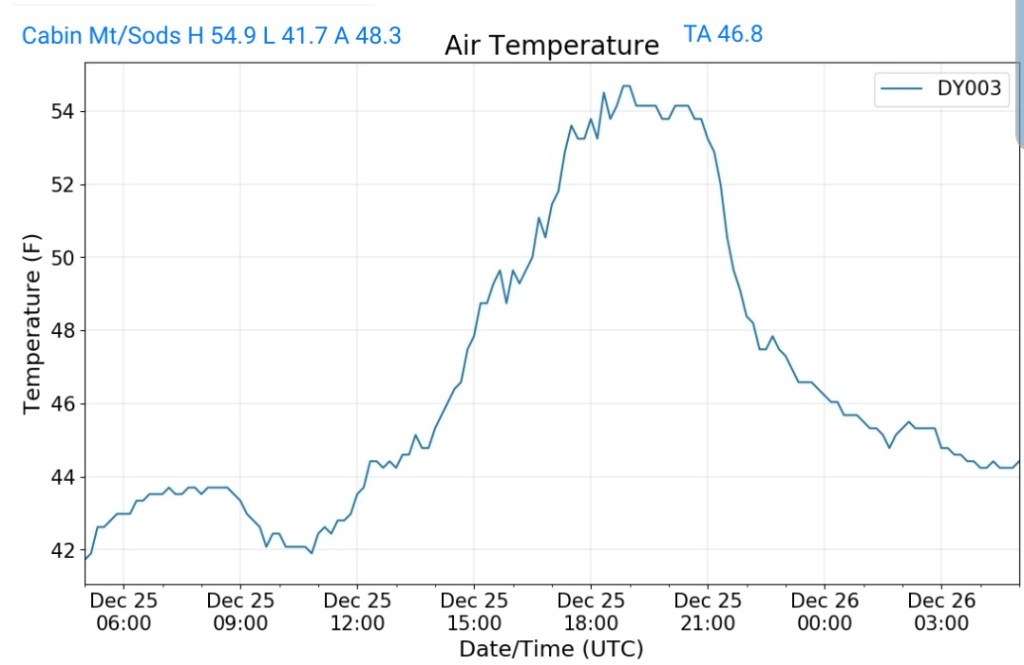
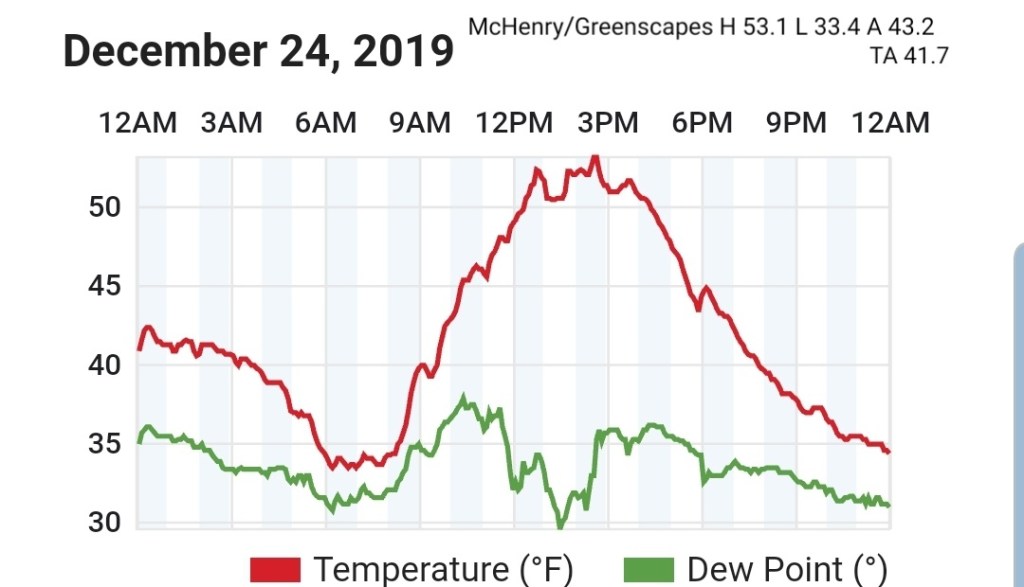
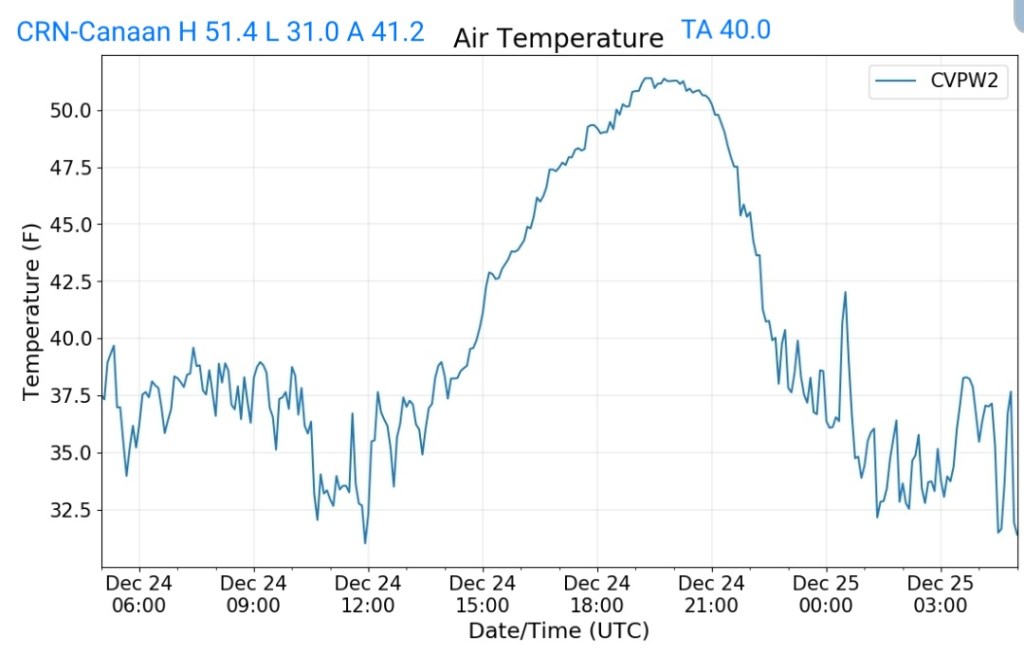
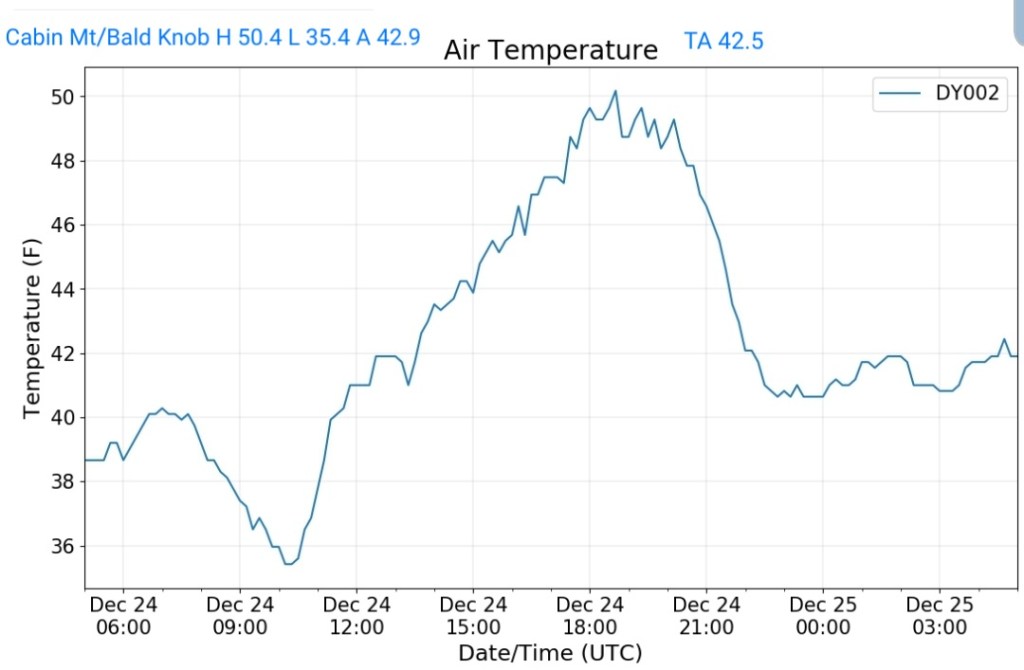
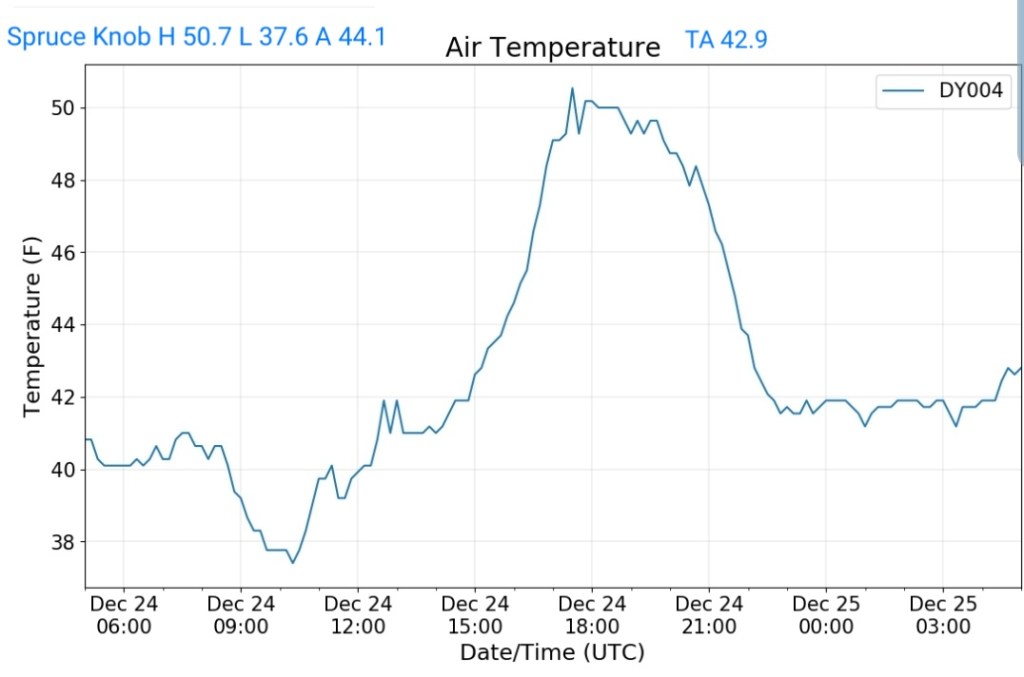
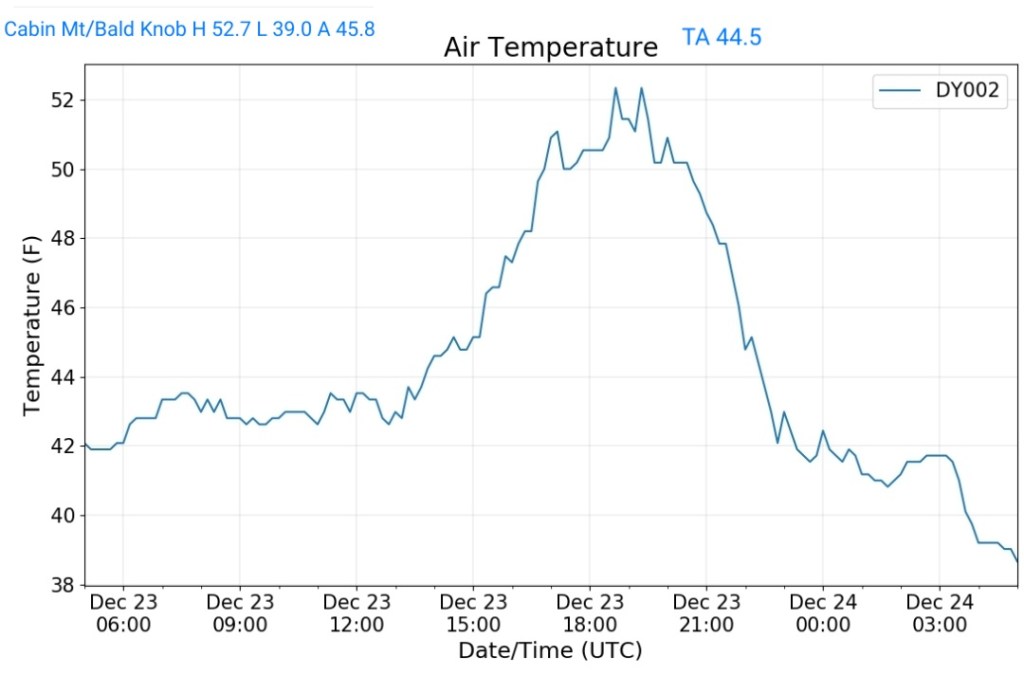
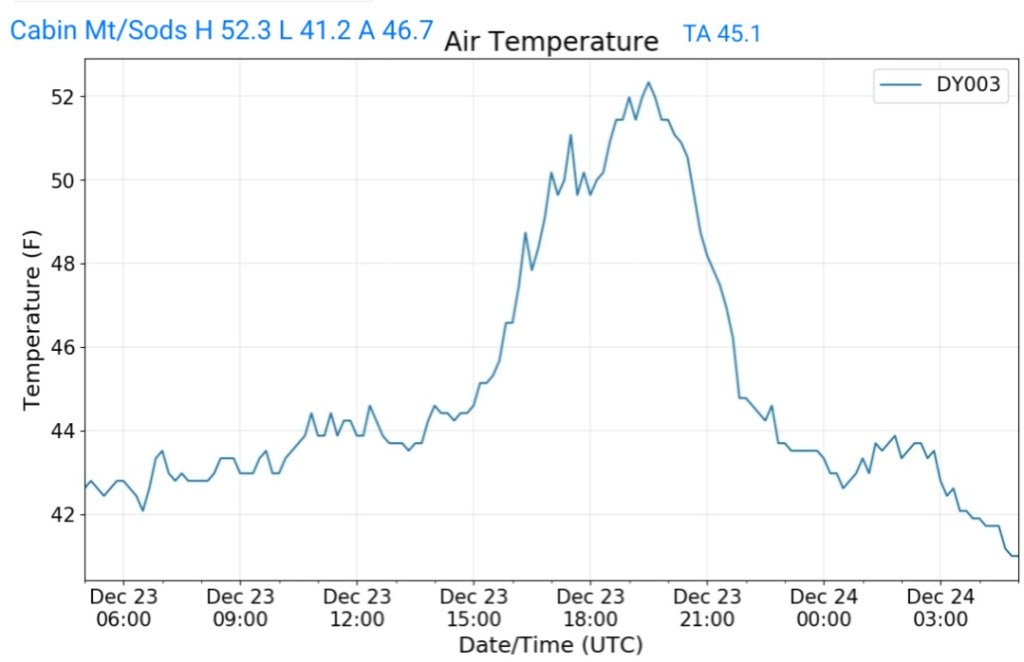
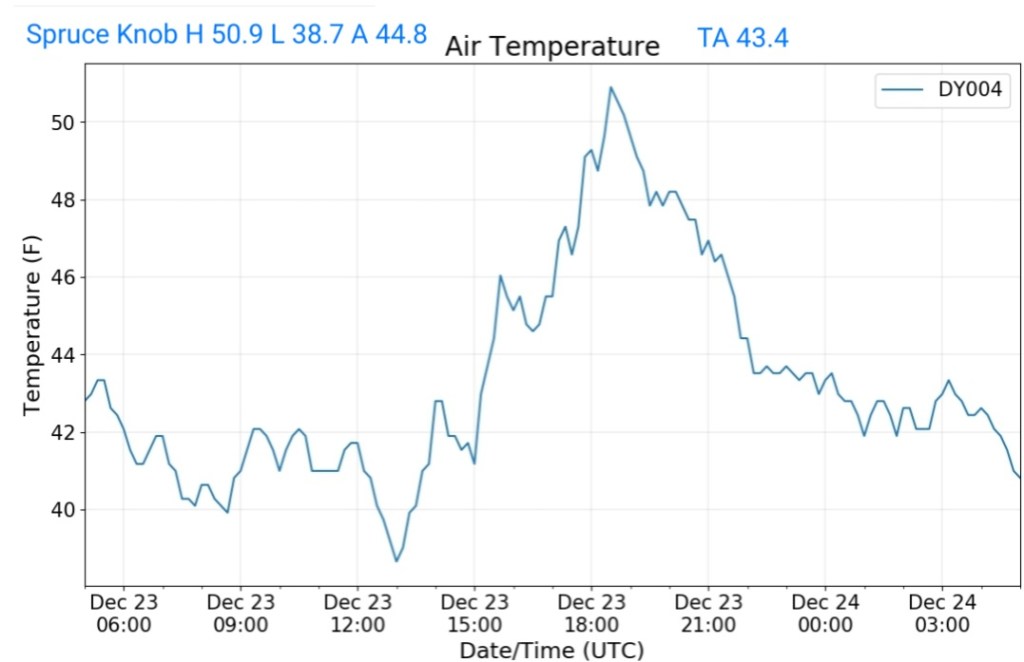
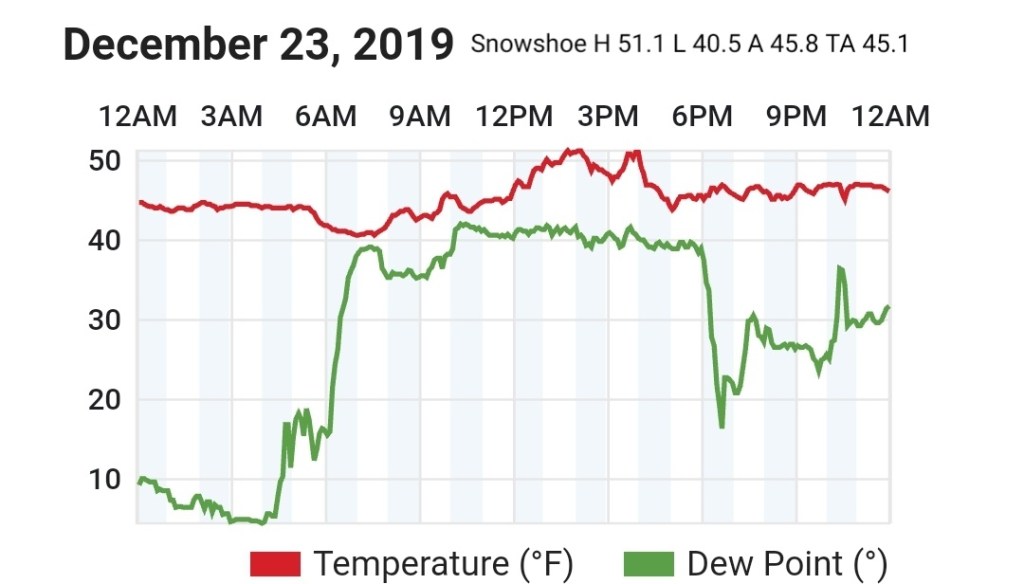
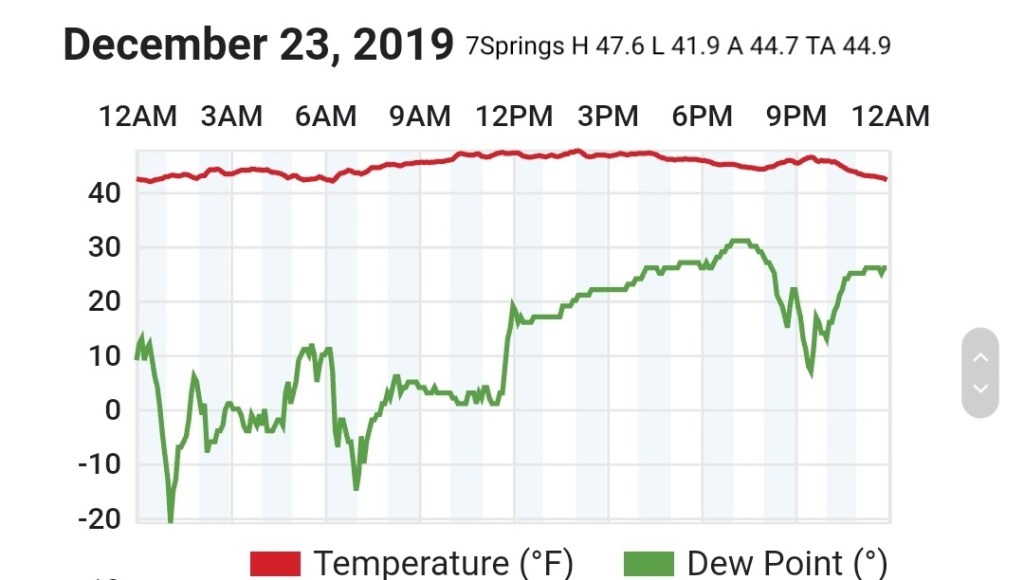
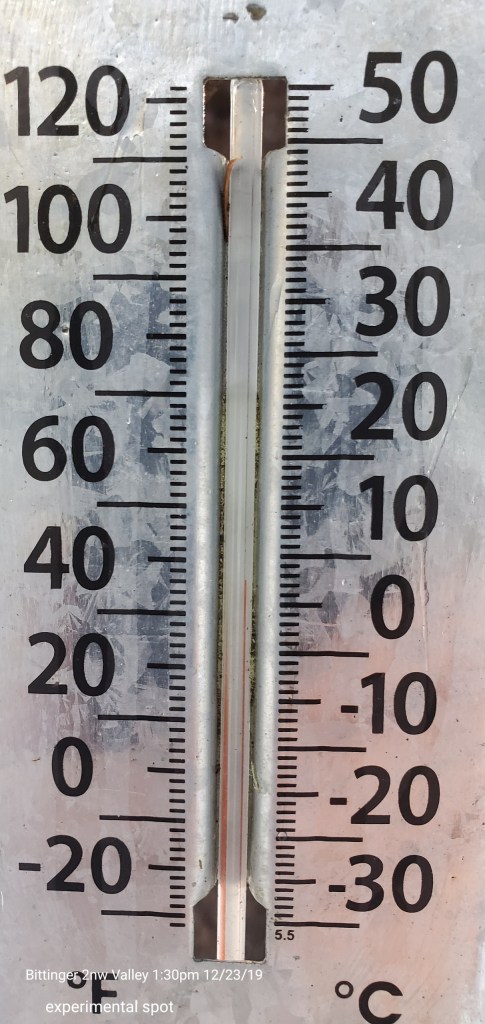
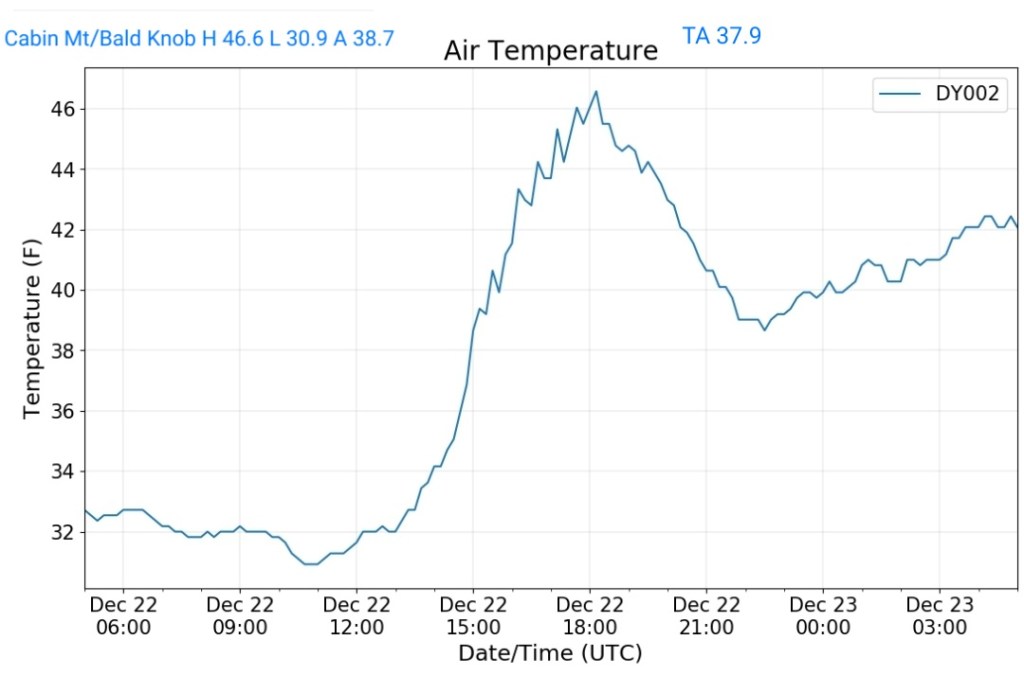
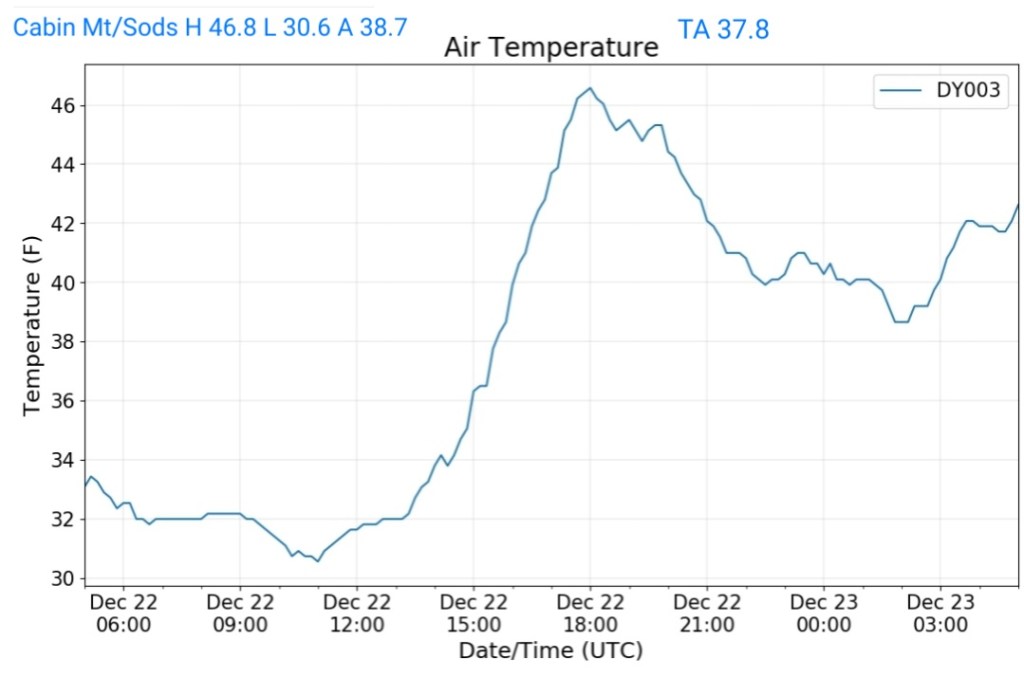
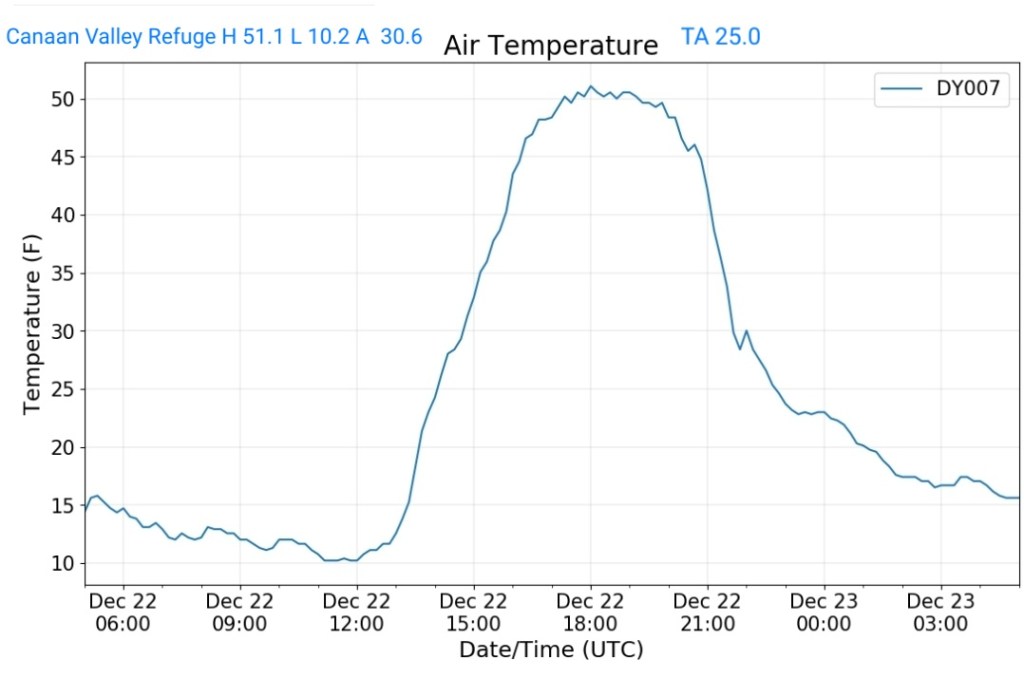
TEMPS
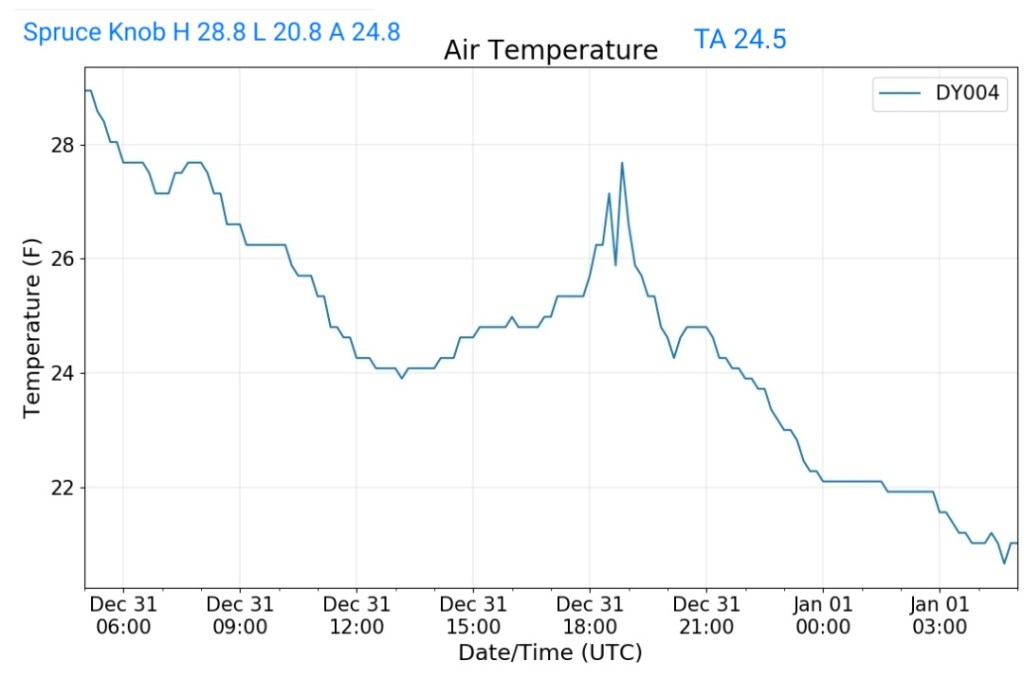
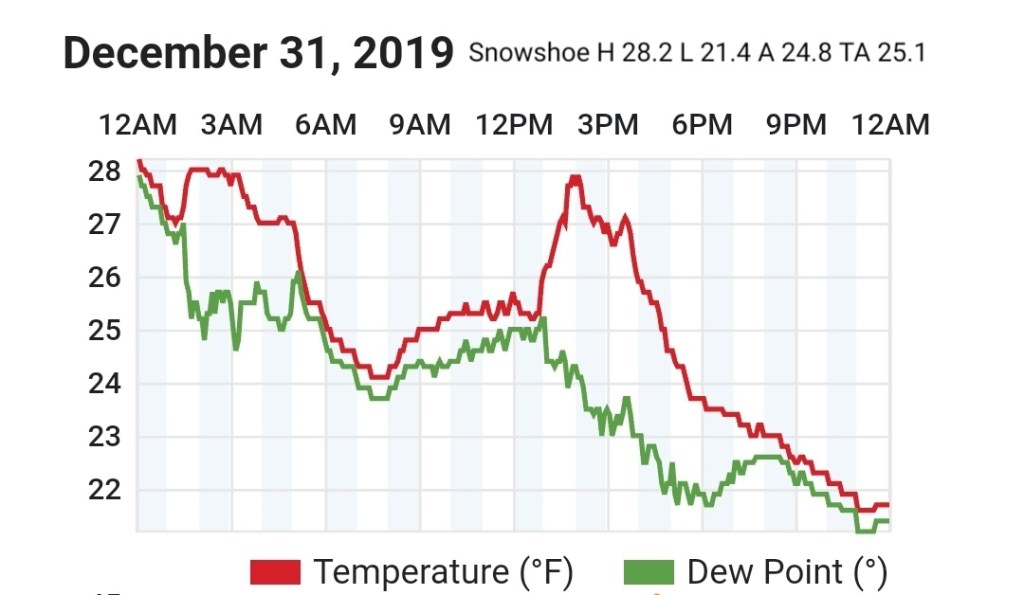
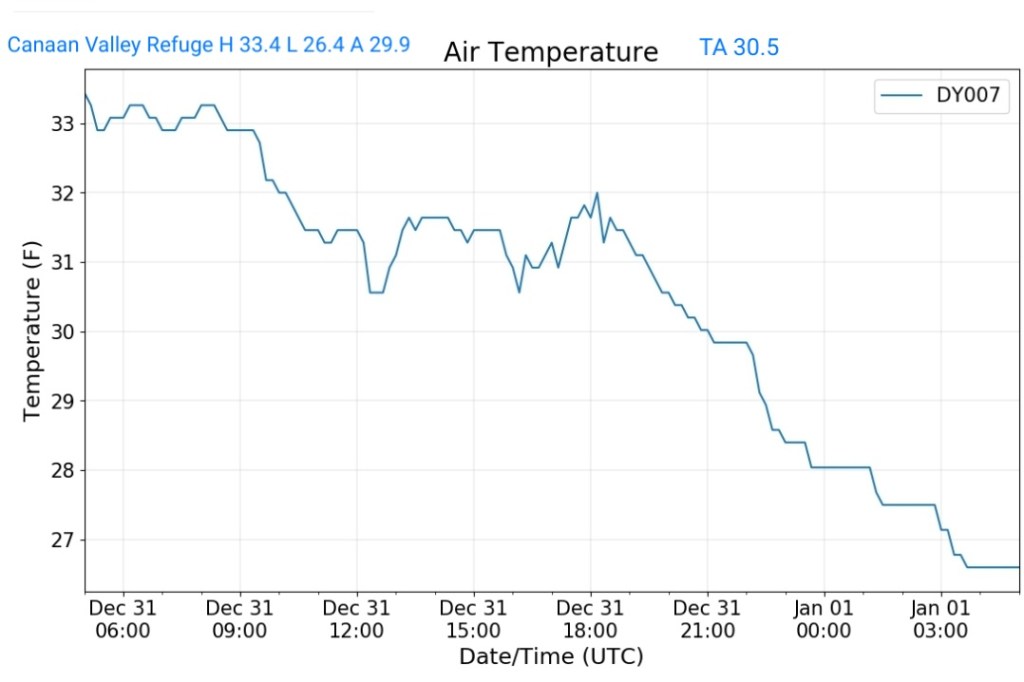
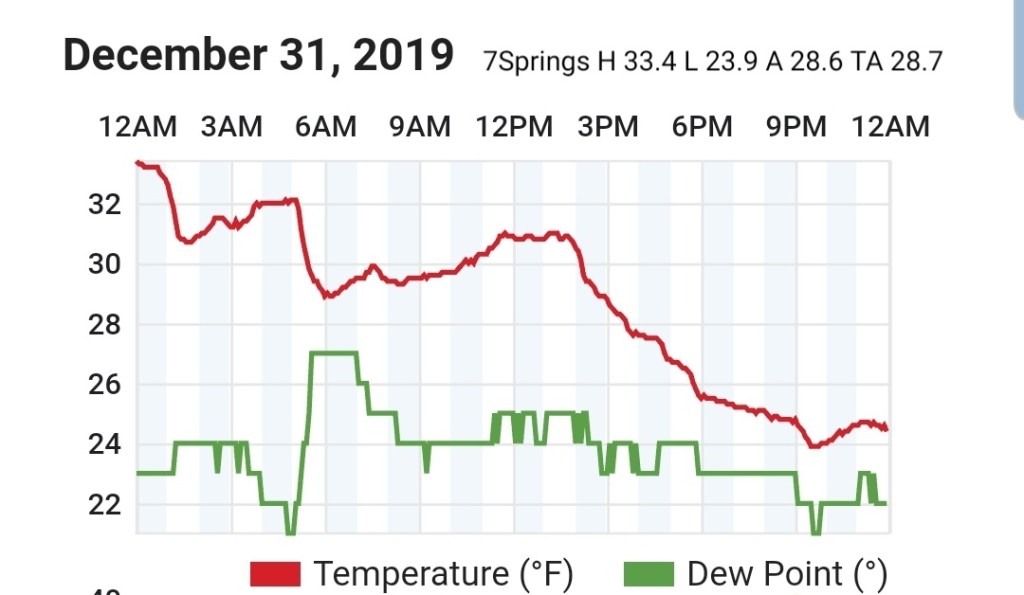
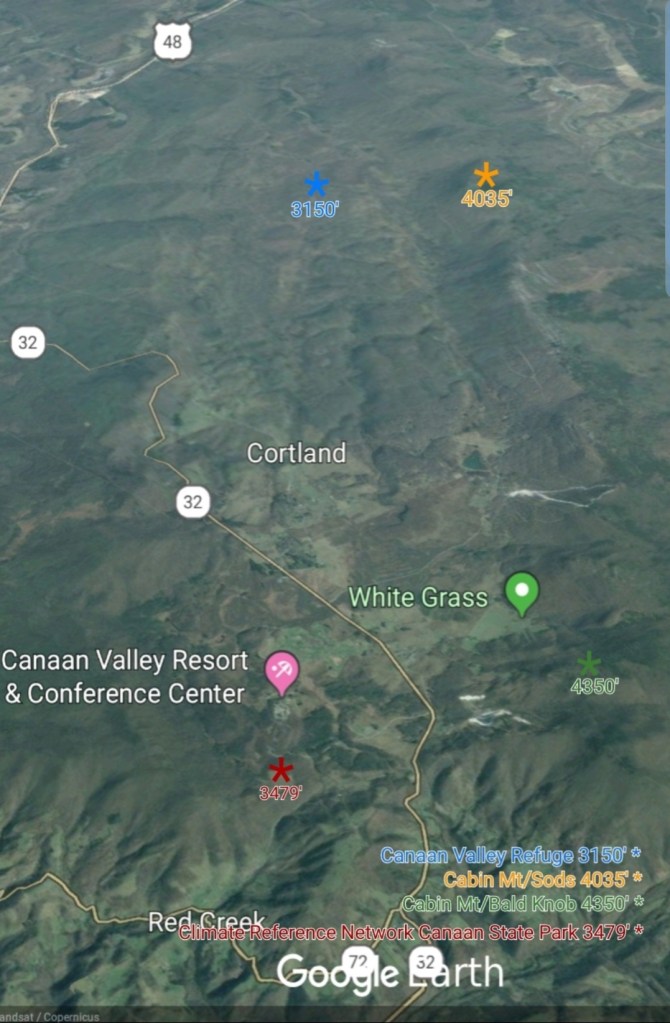
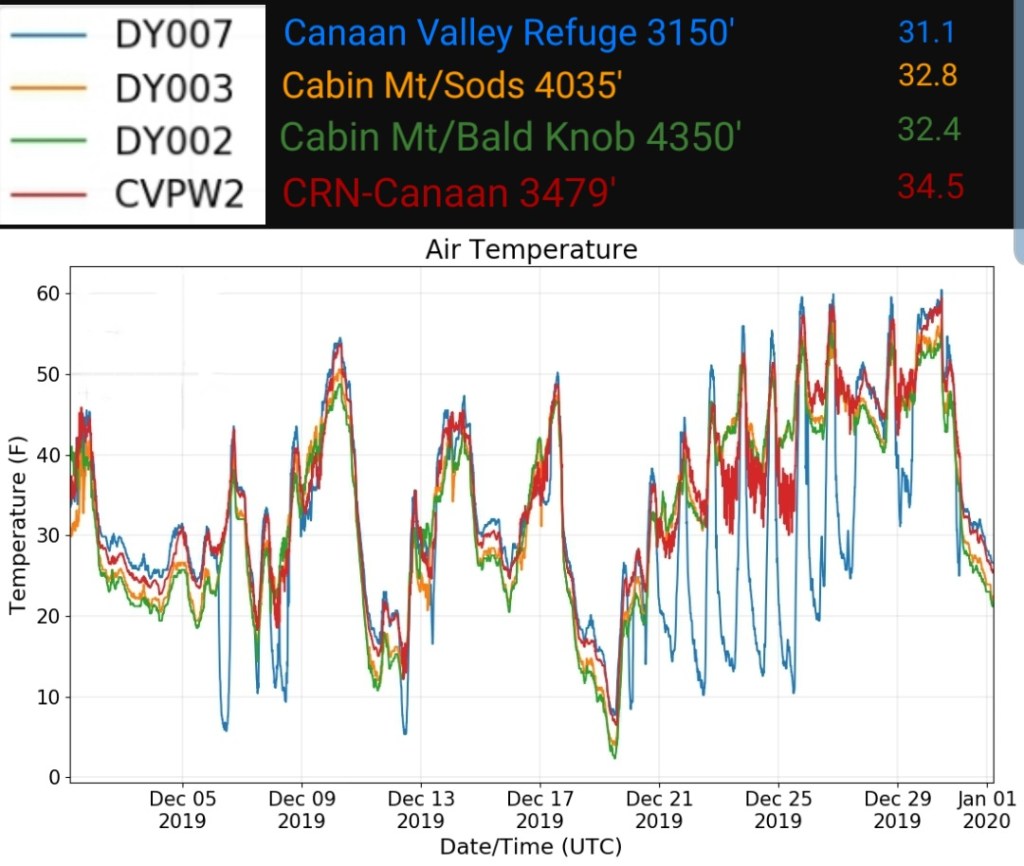
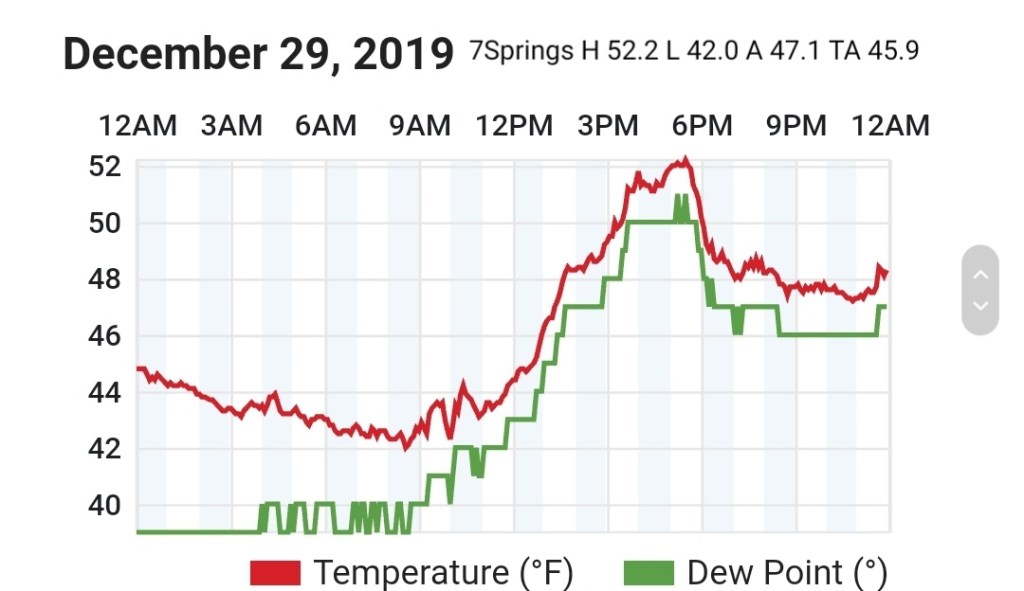
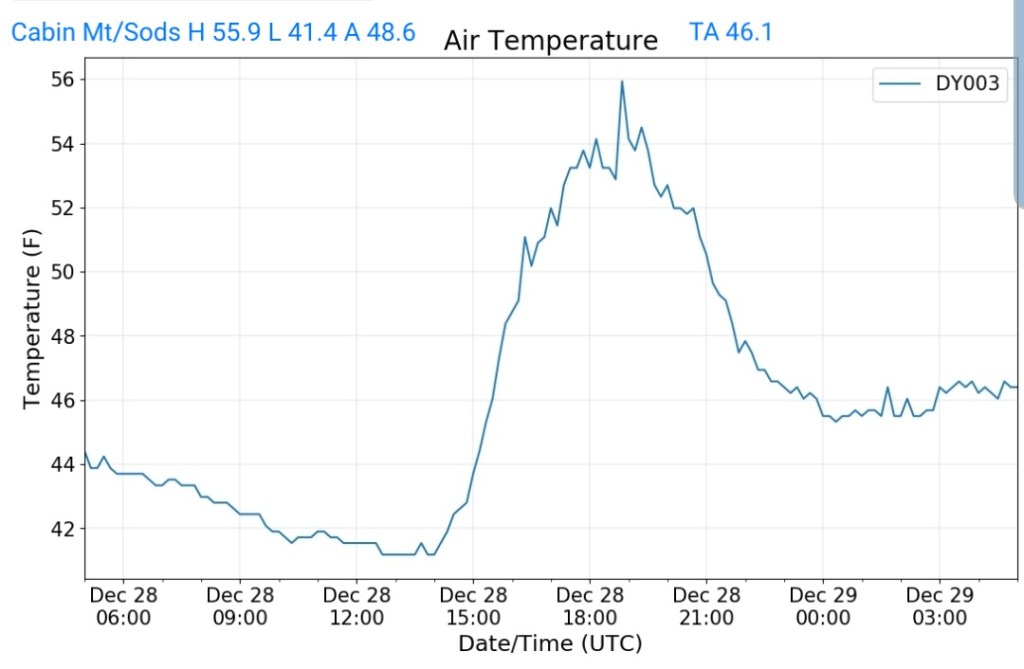
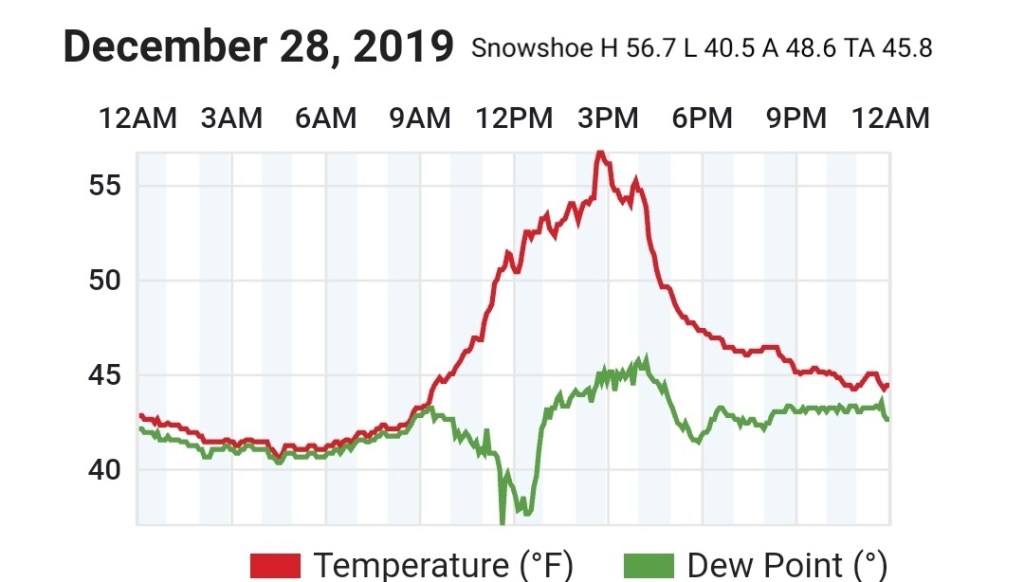
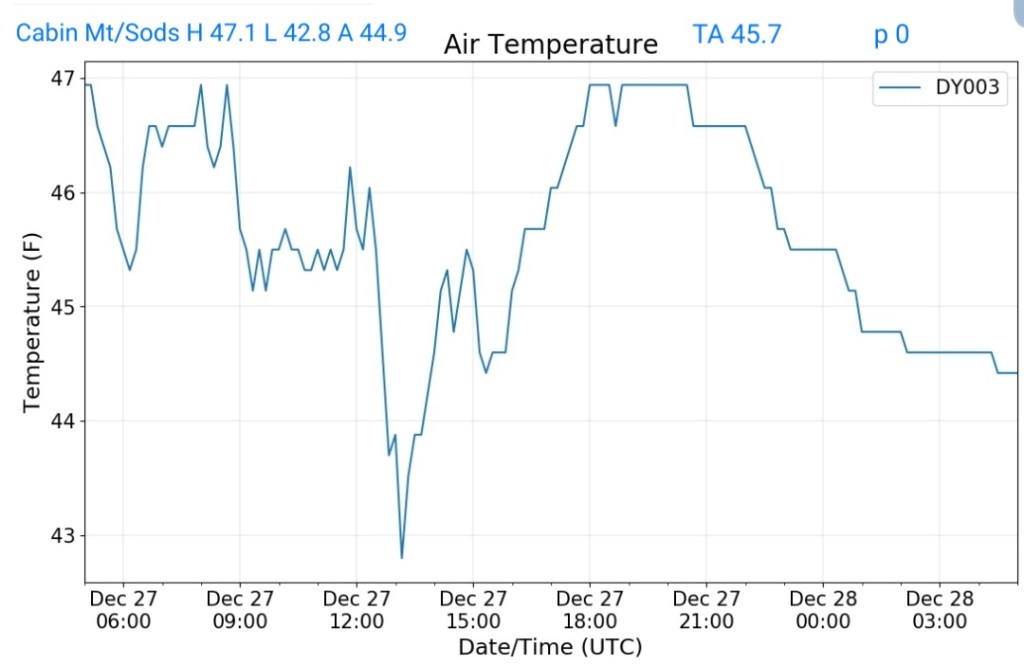
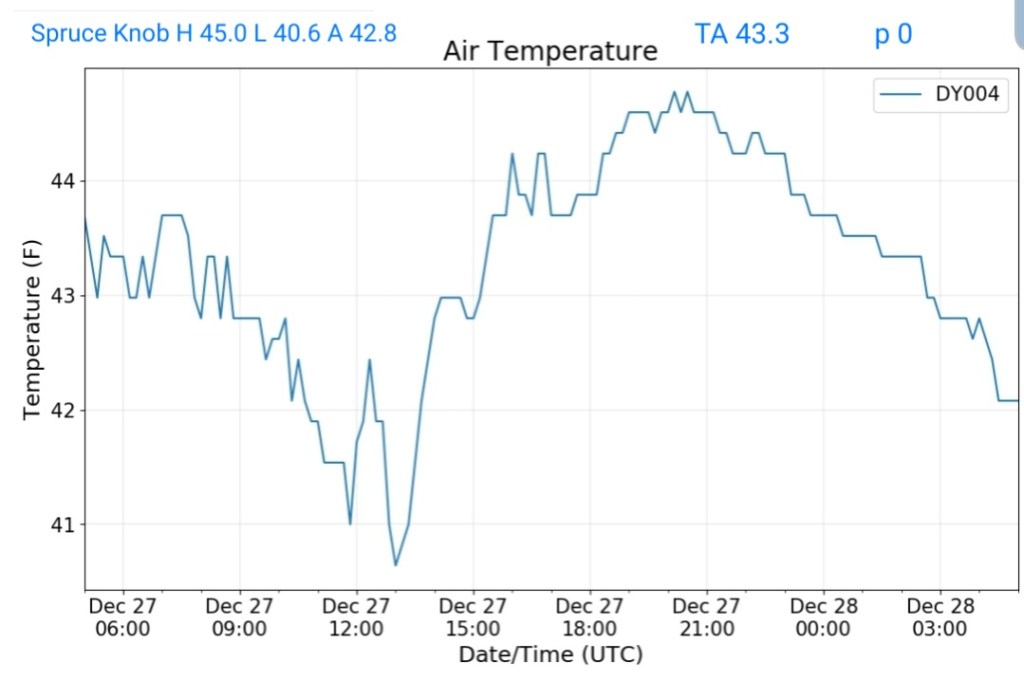
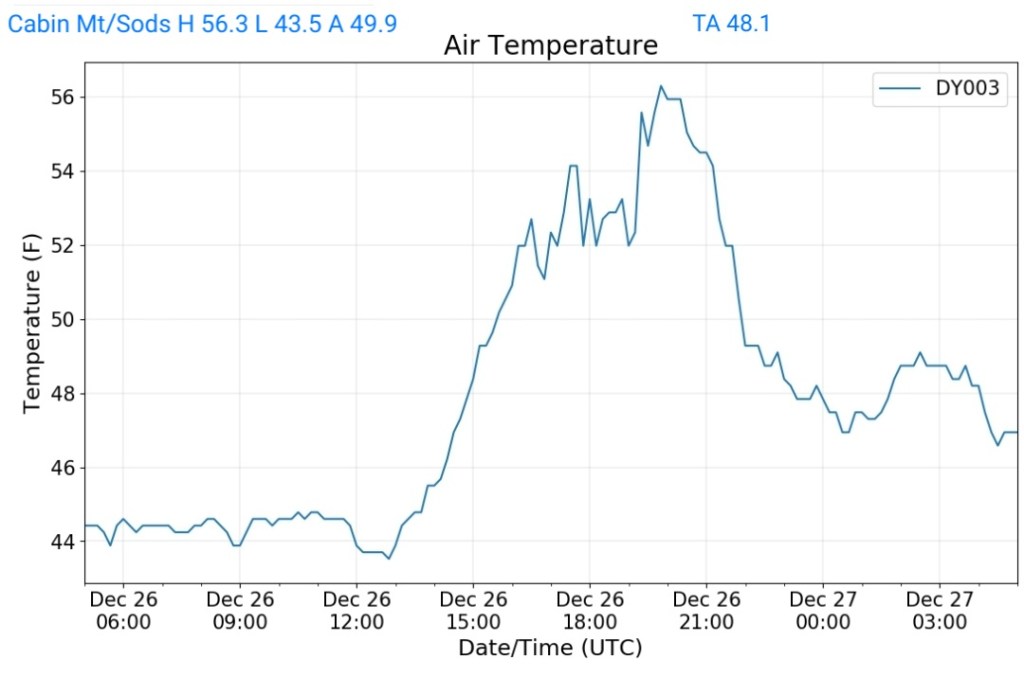
some of the sites
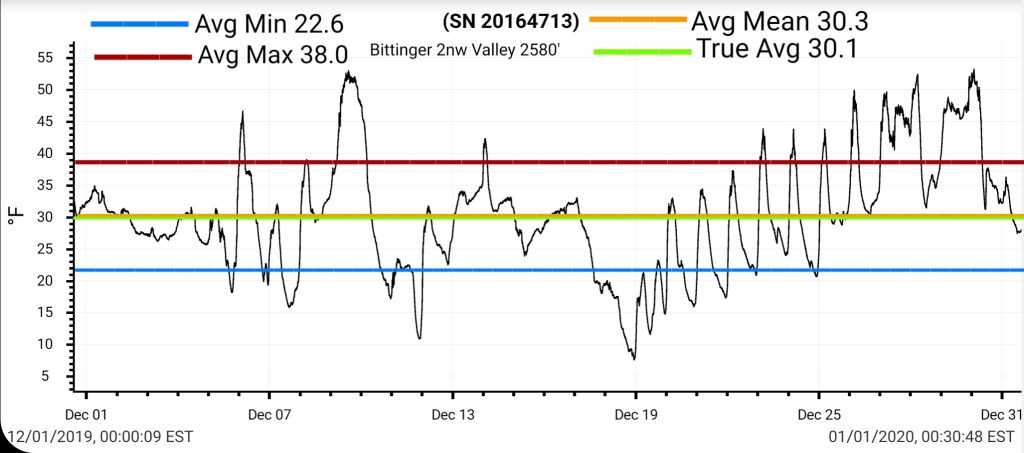
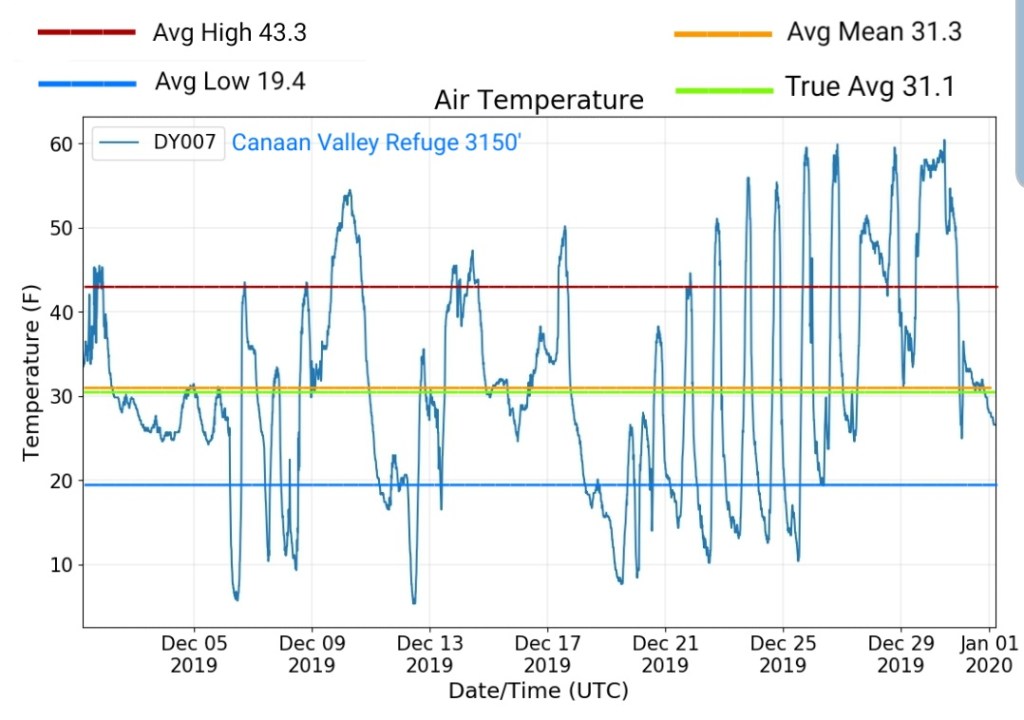
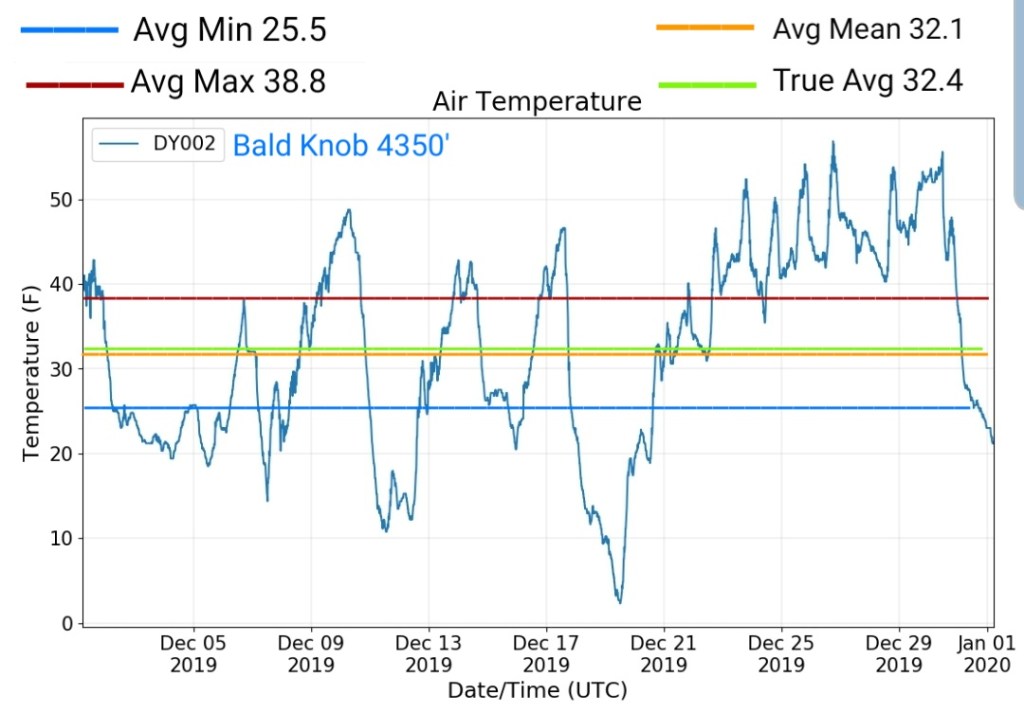
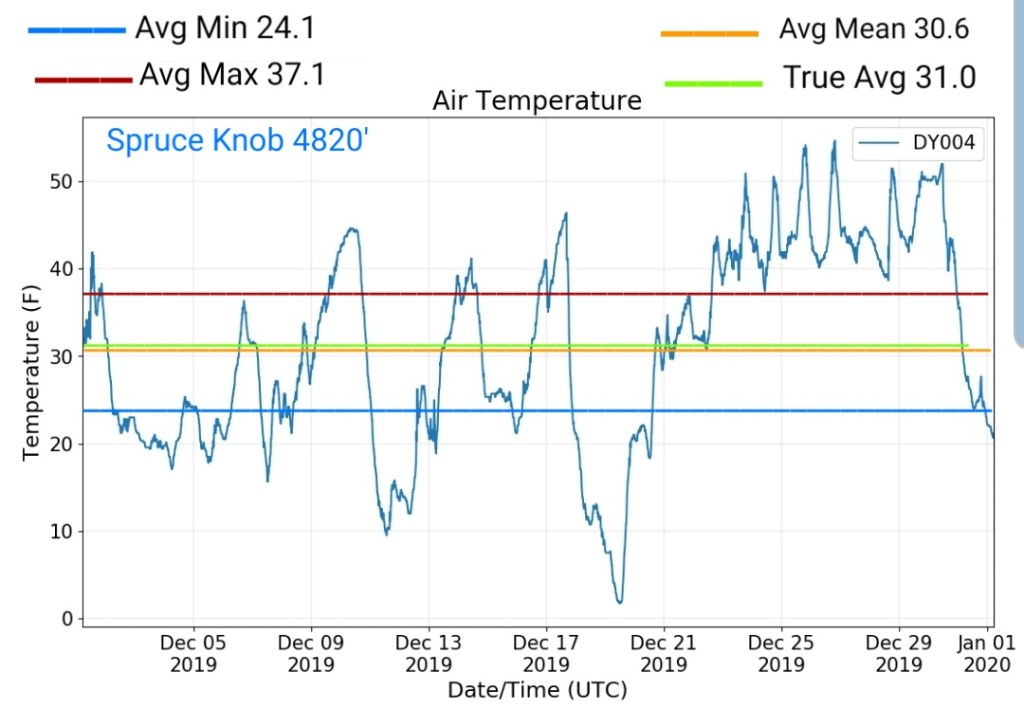
Overall monthly true average(all readings divided by the number of readings)
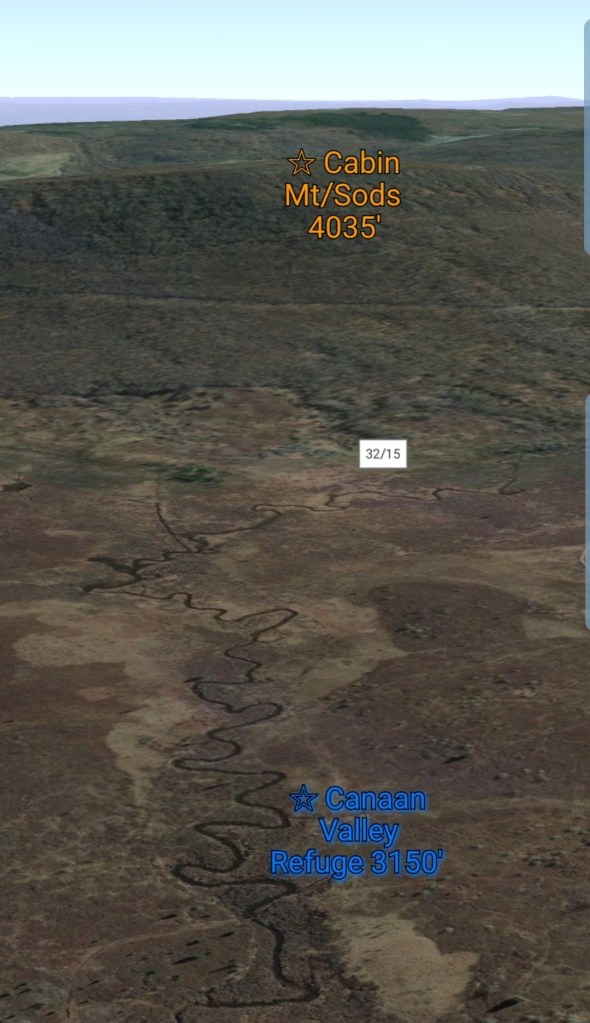
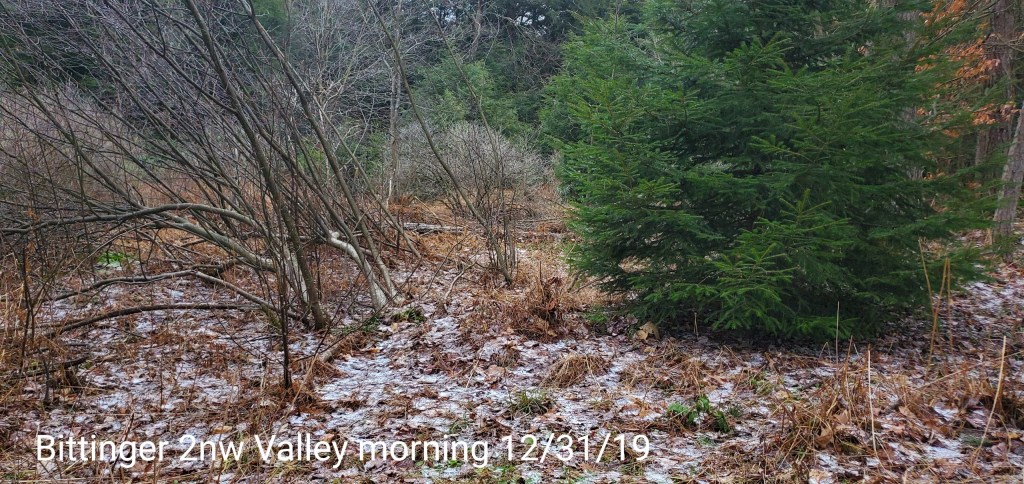
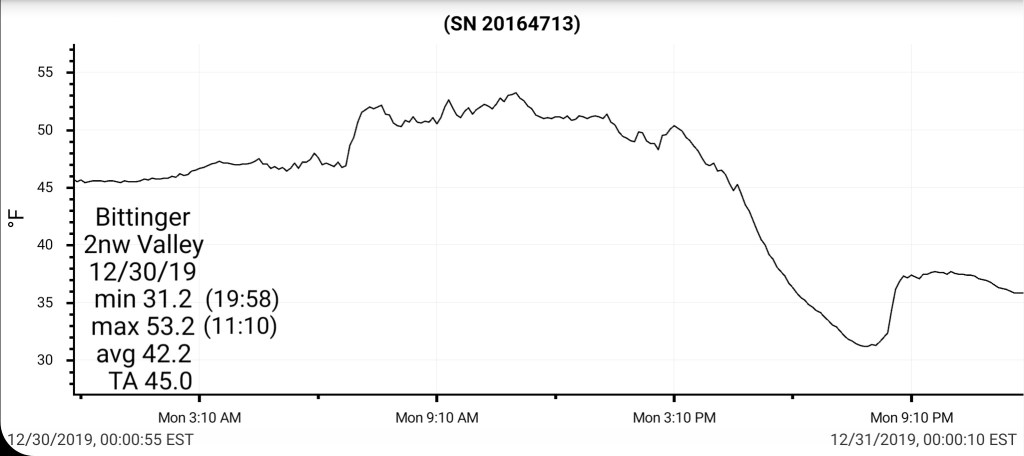
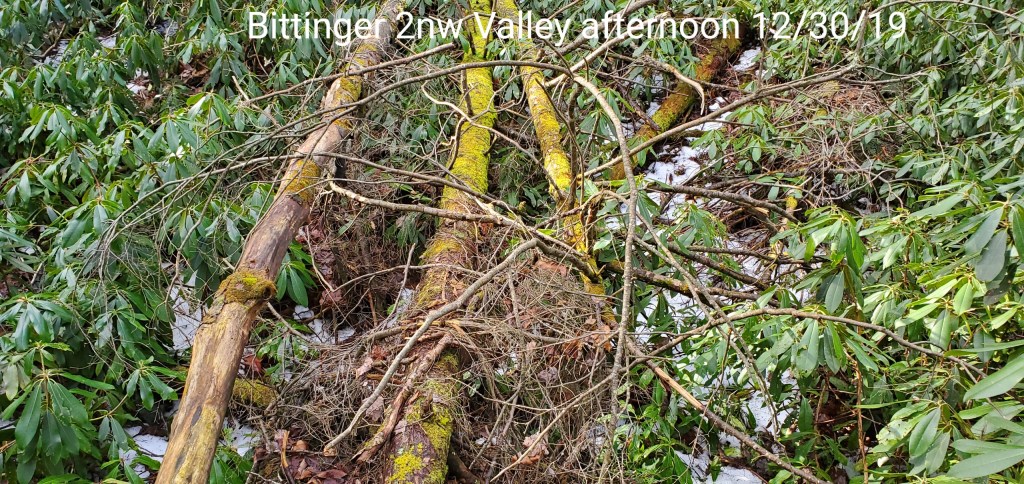
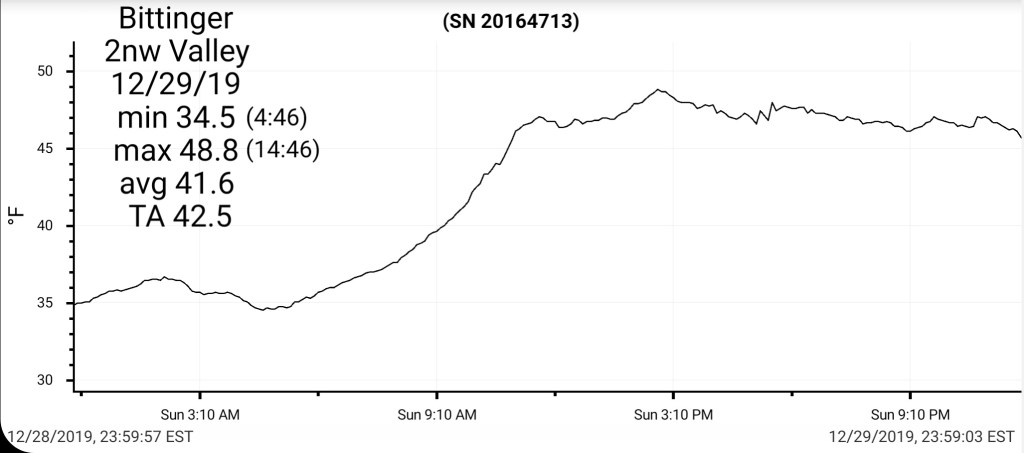
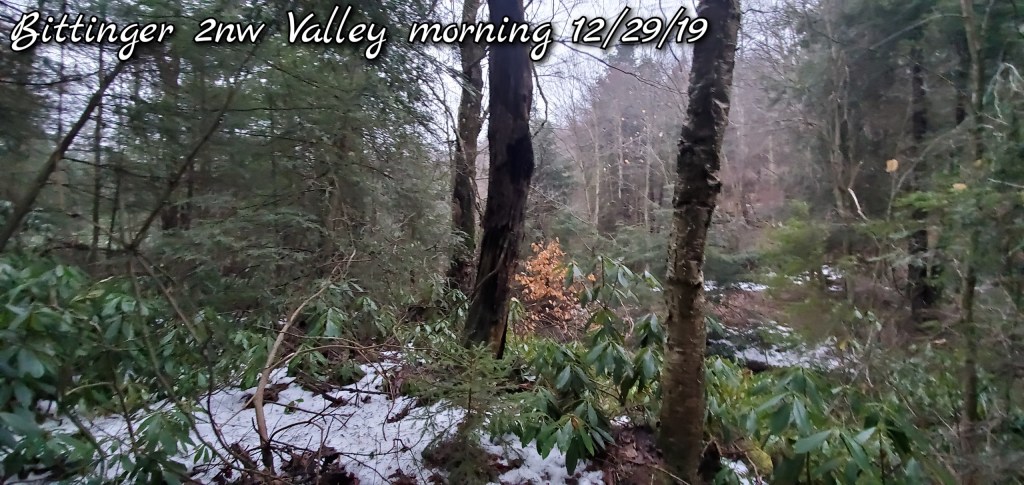
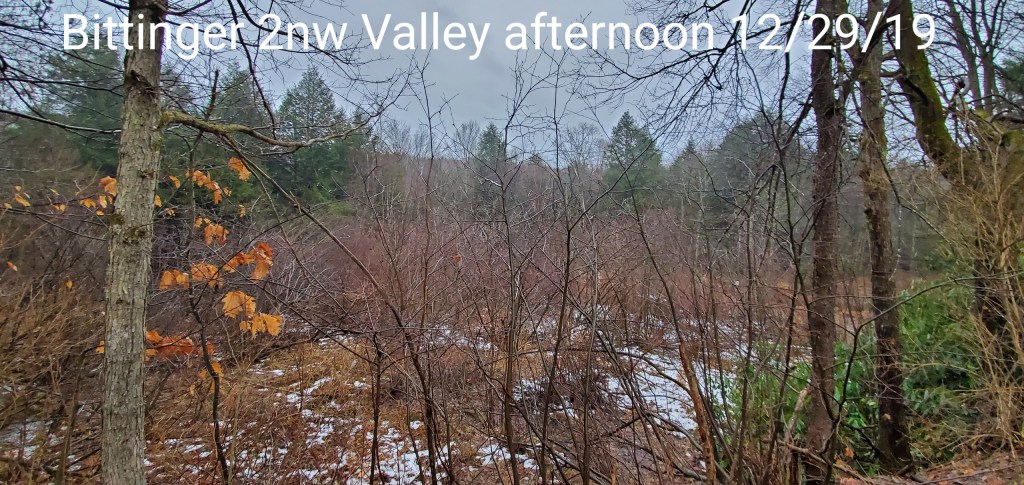
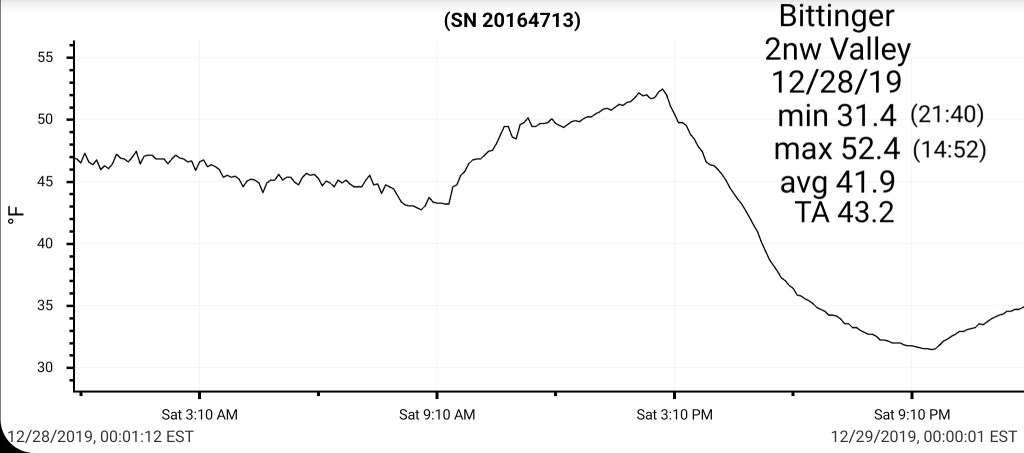
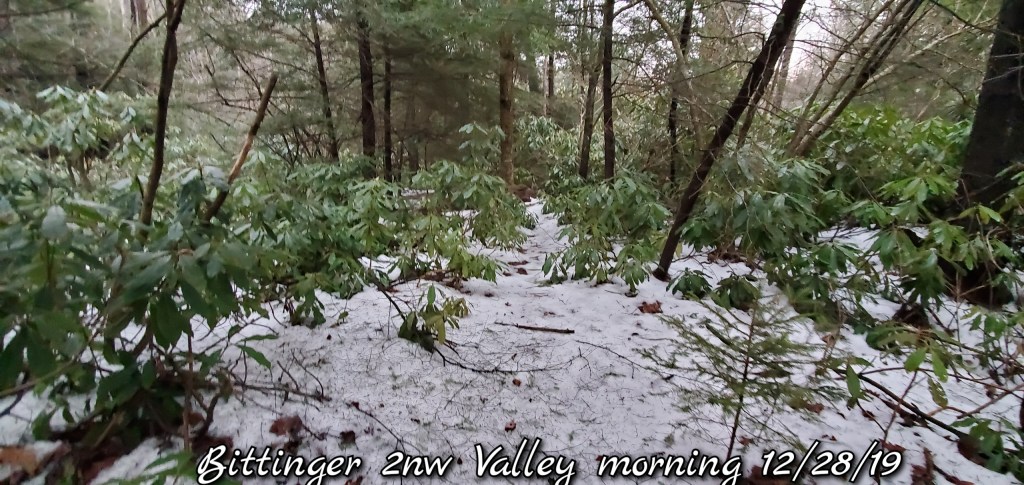
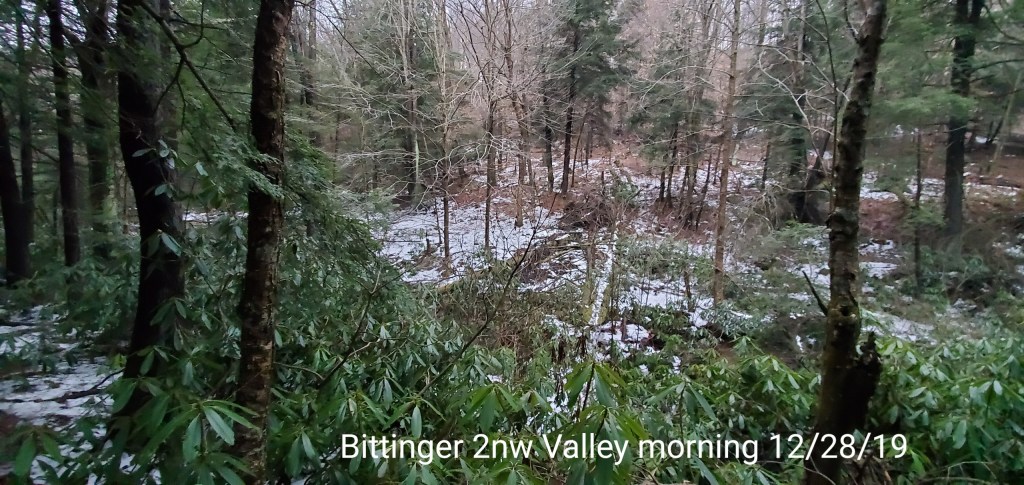
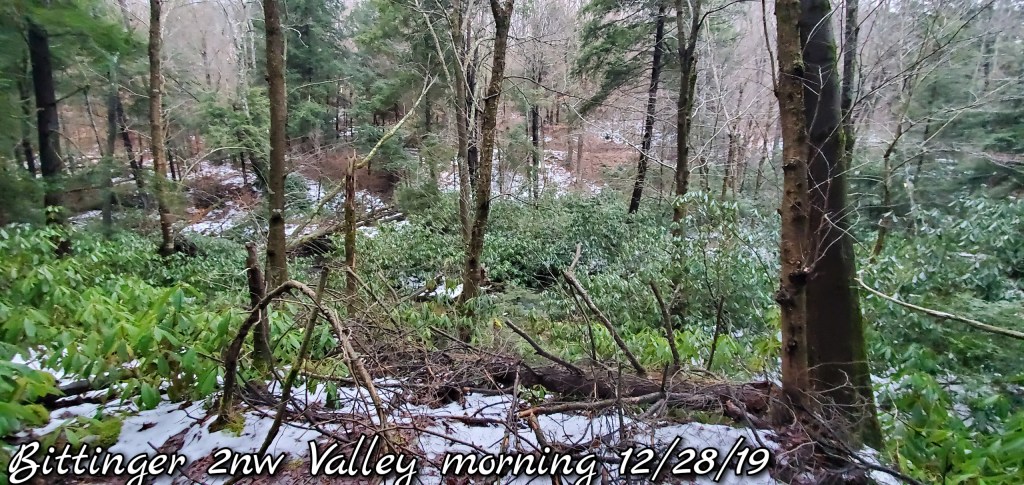
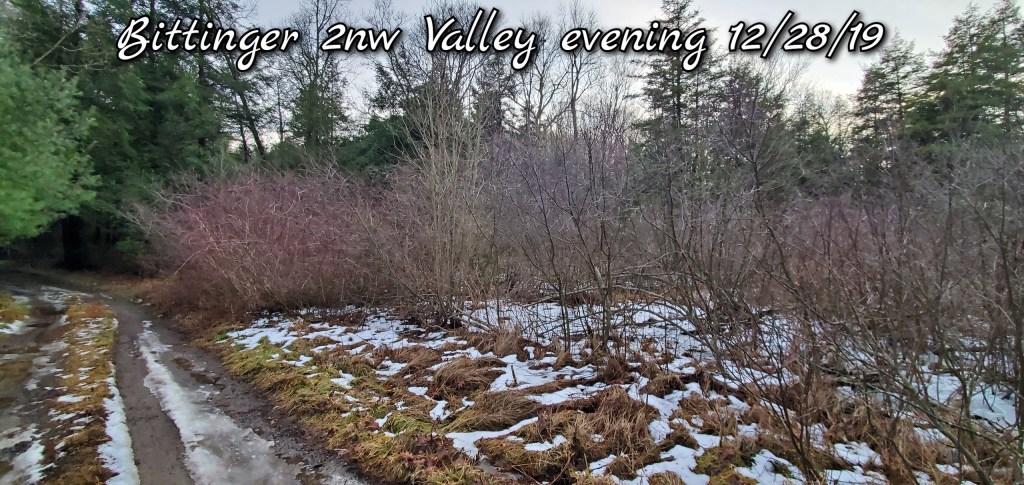
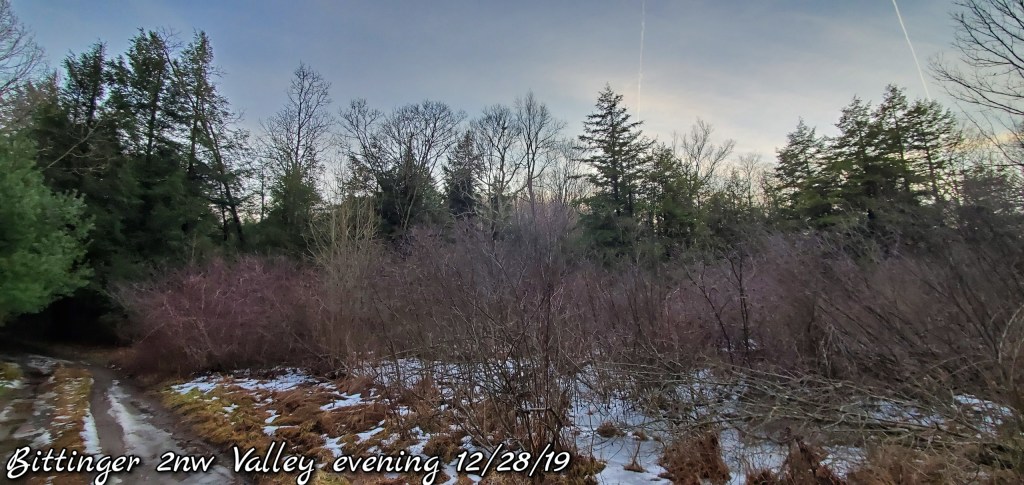
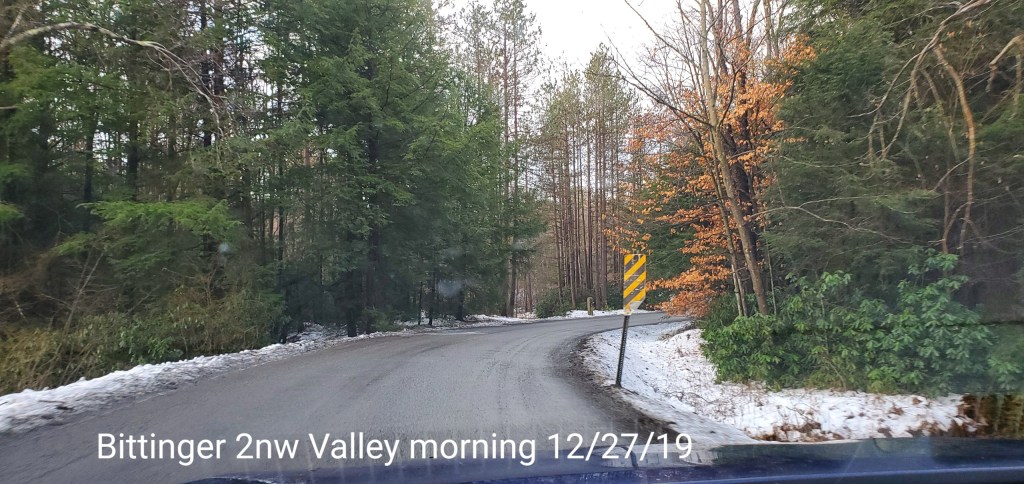
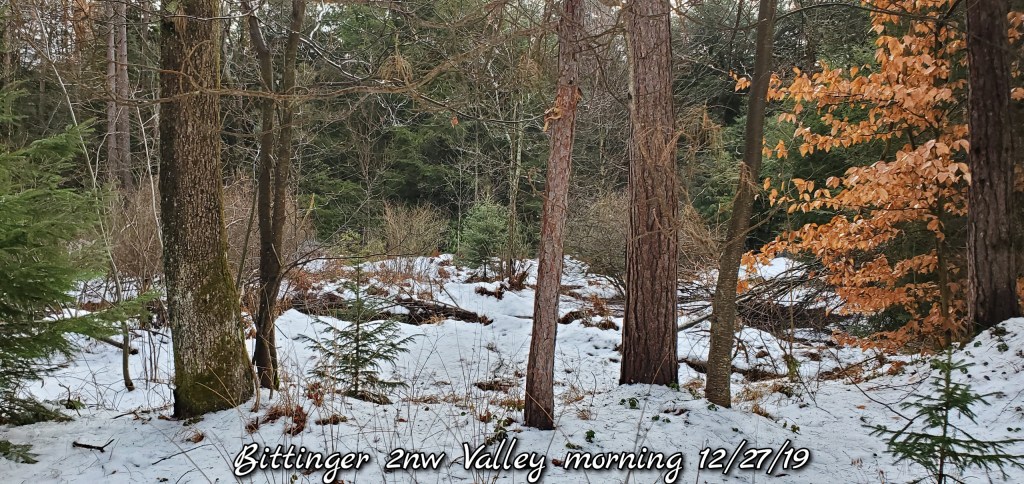
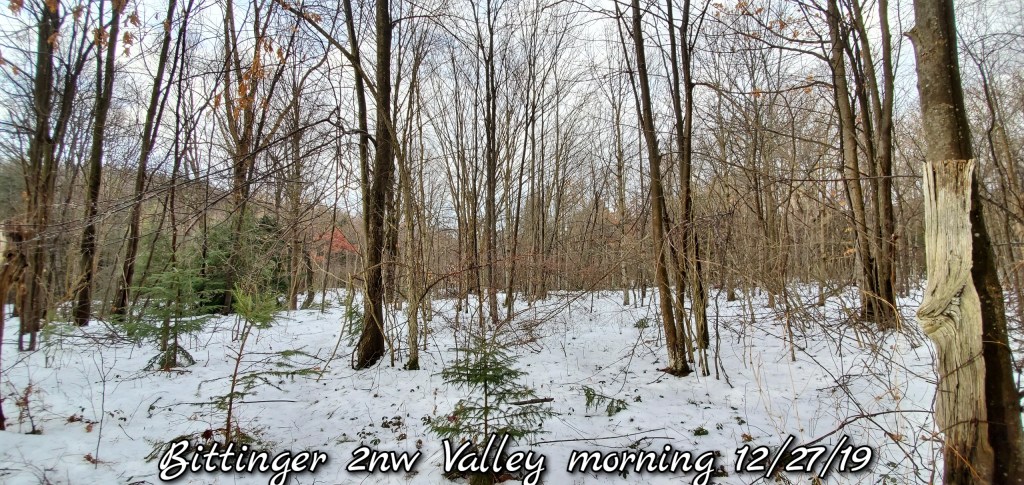
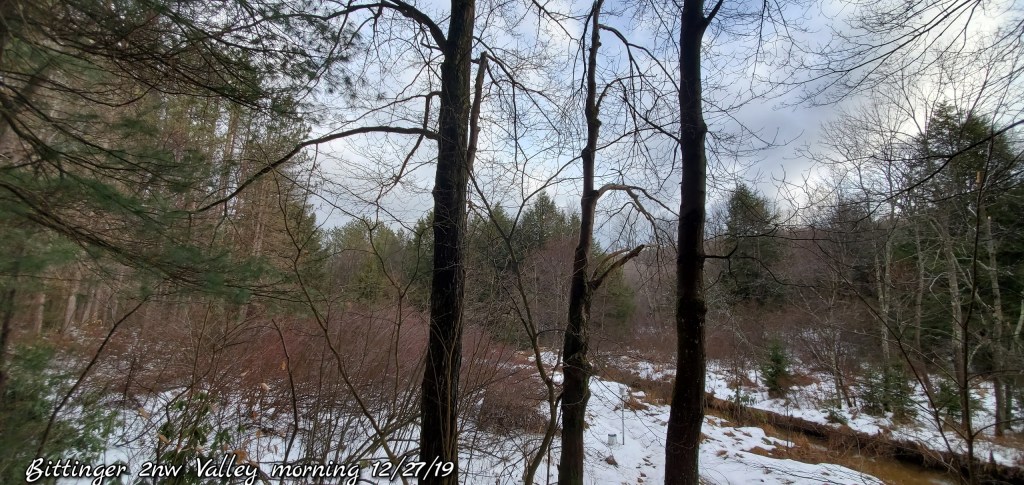
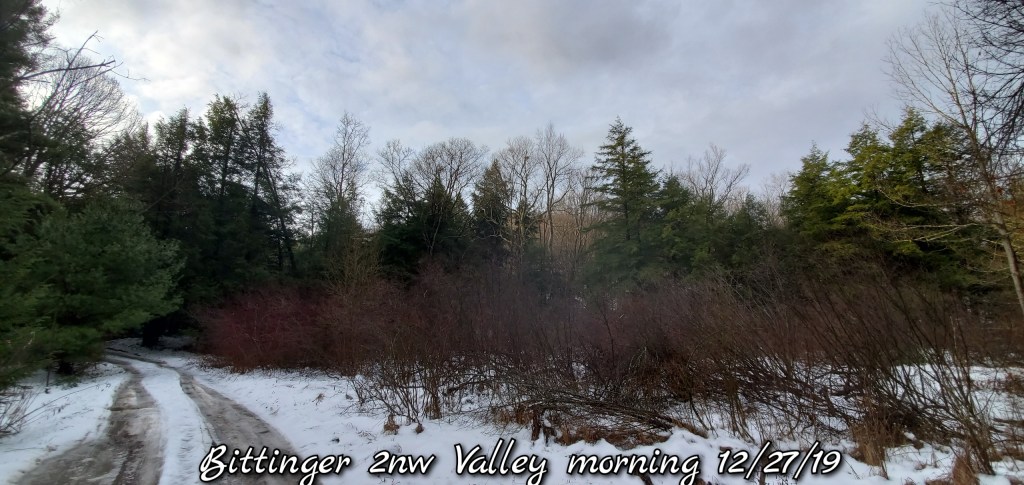
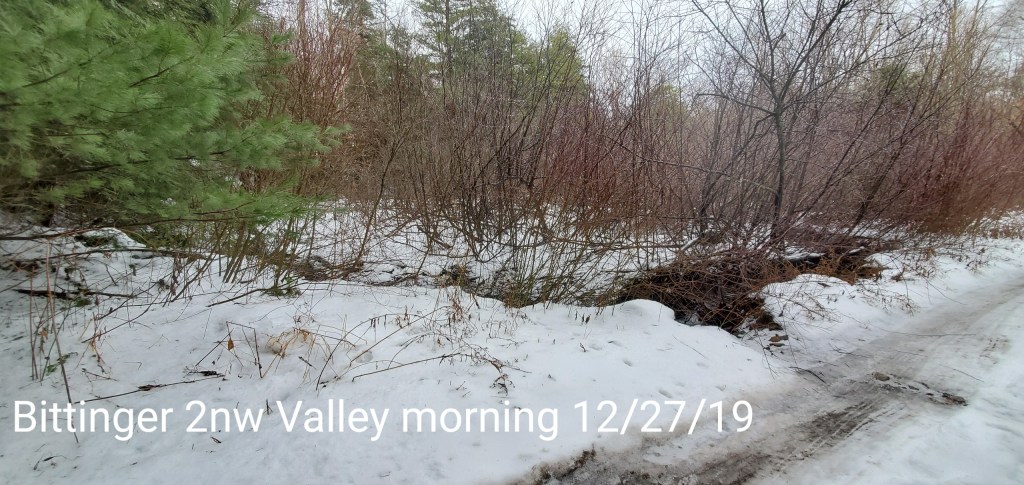
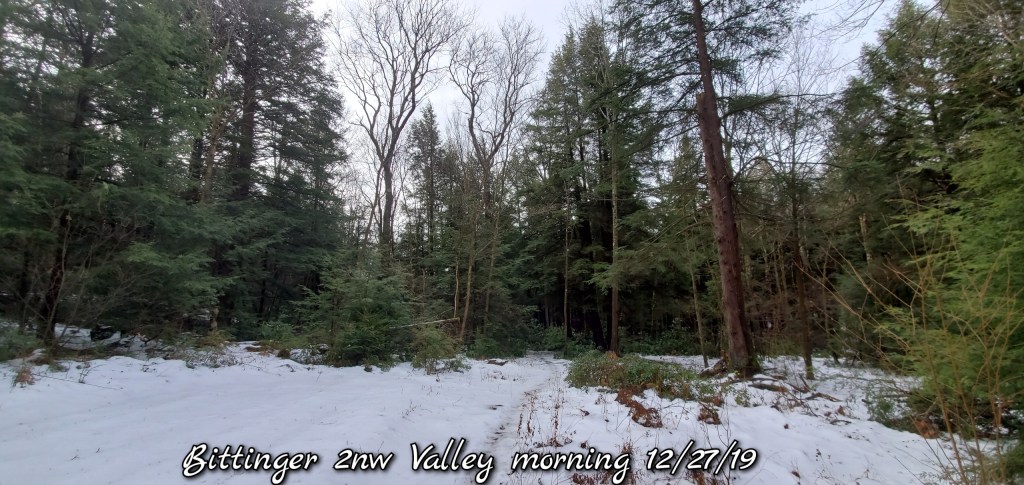
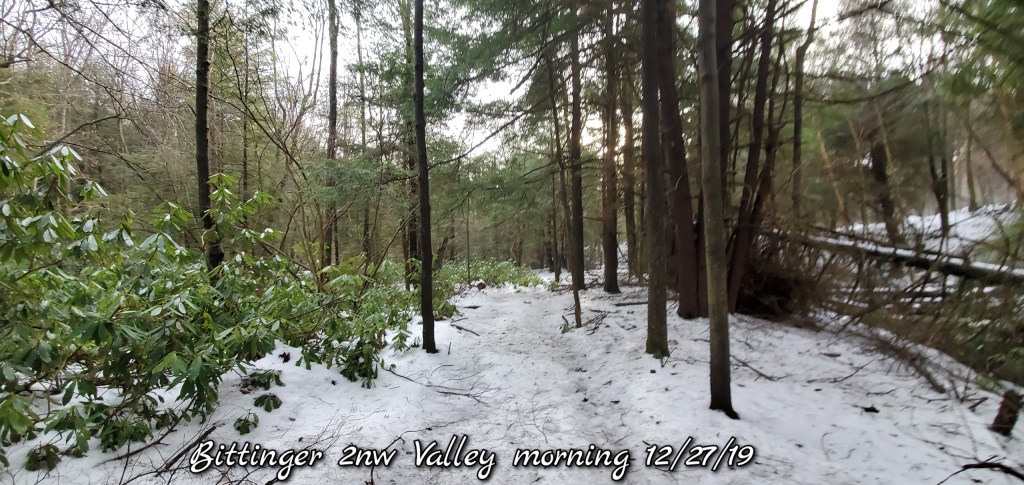
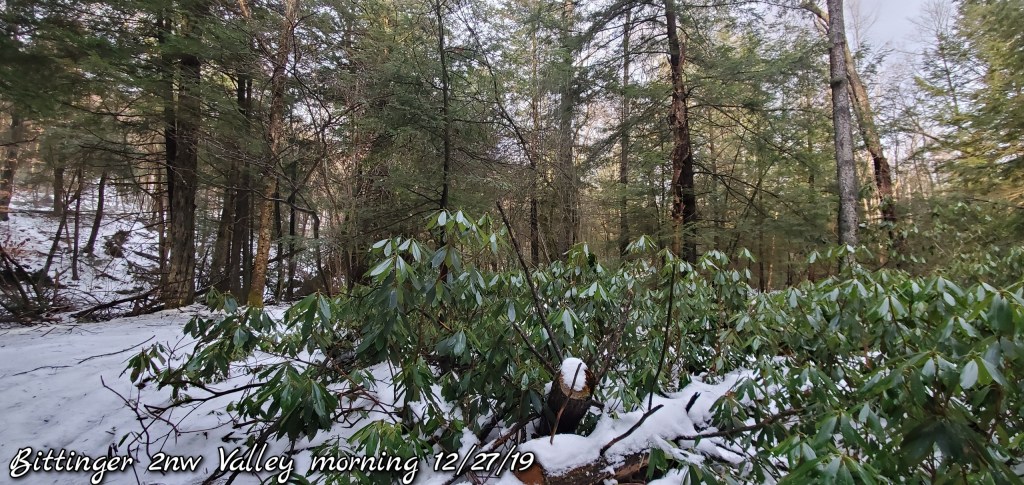
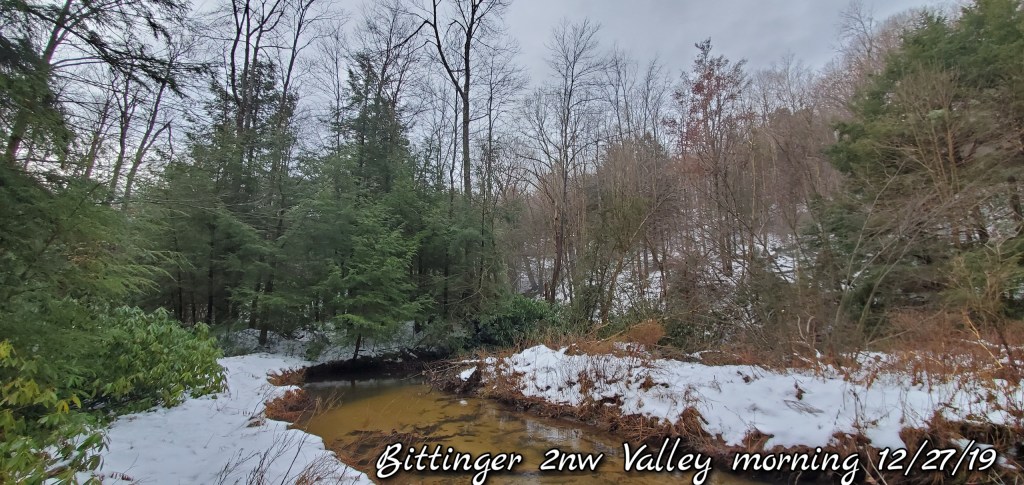
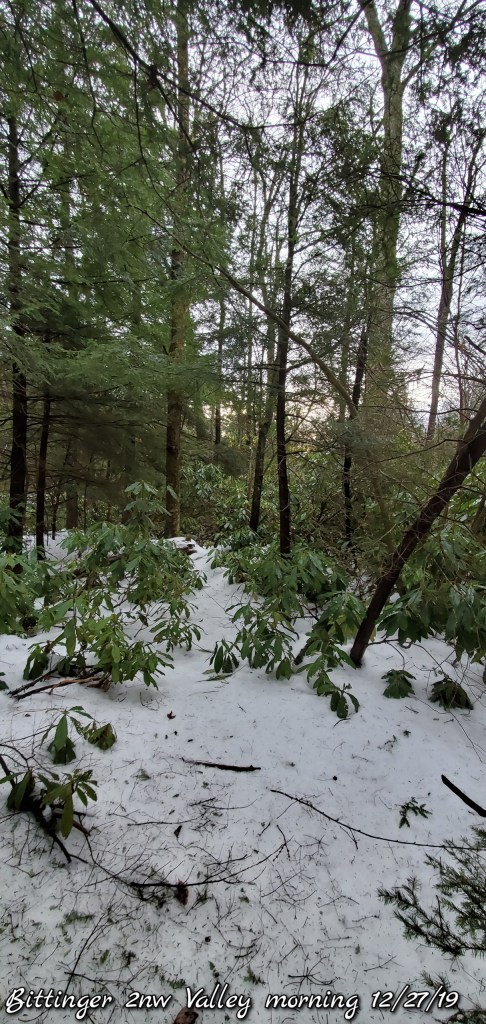
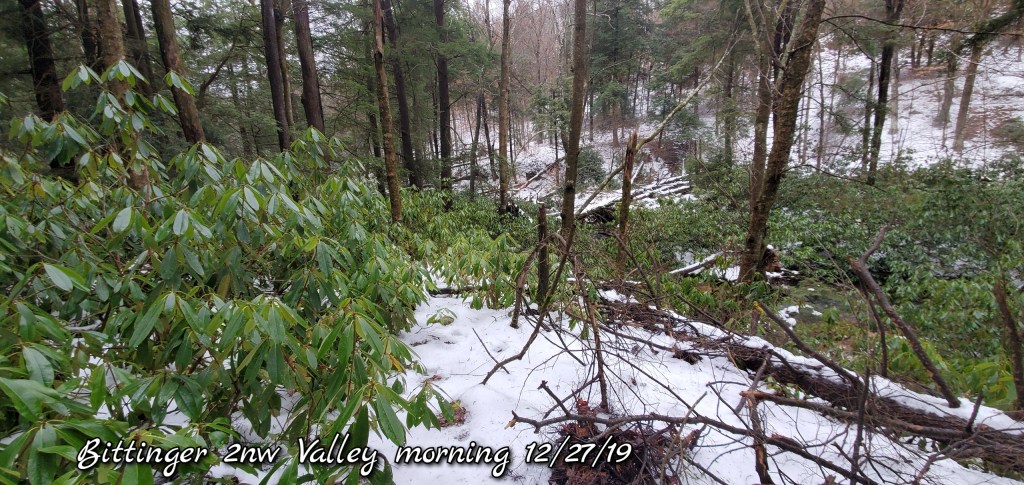
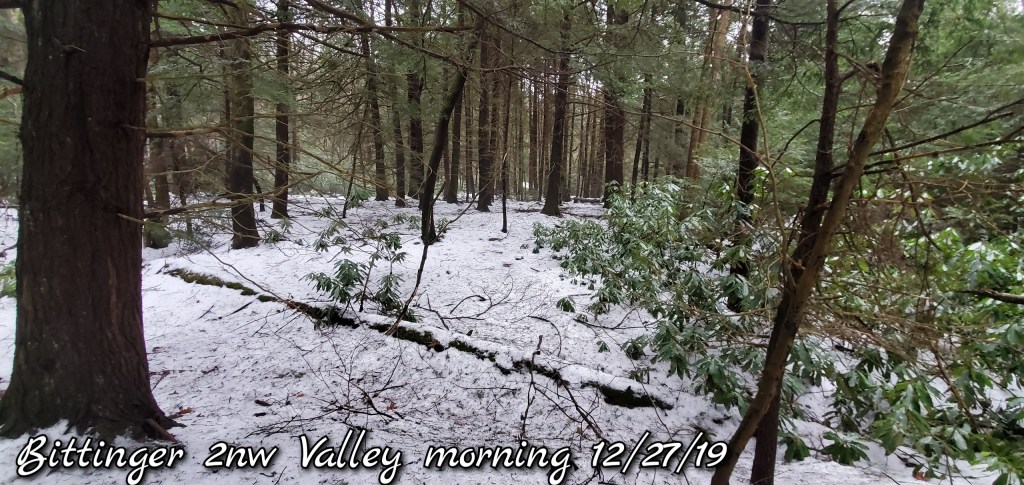
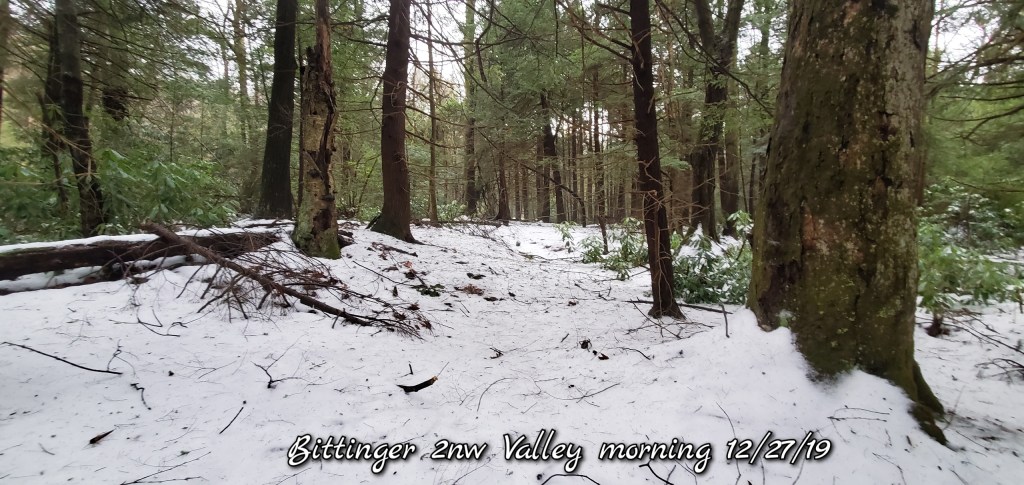
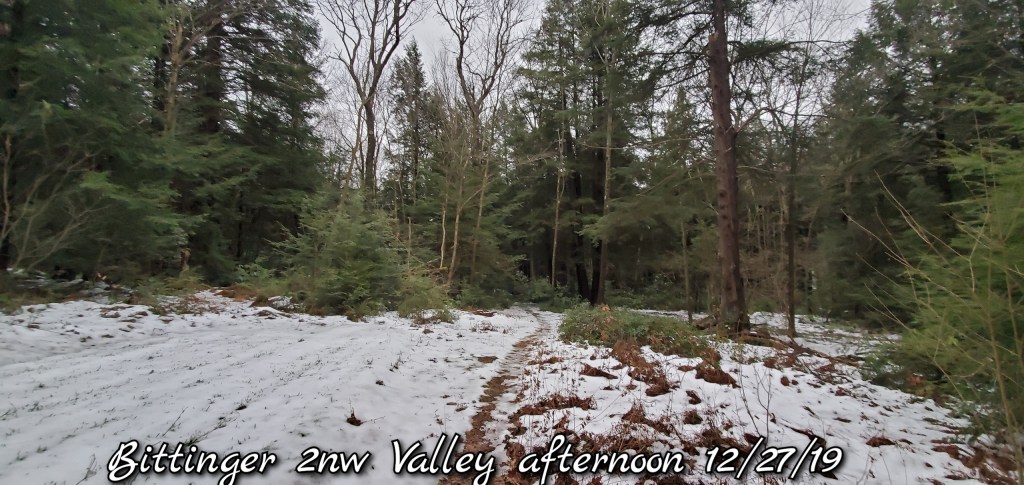
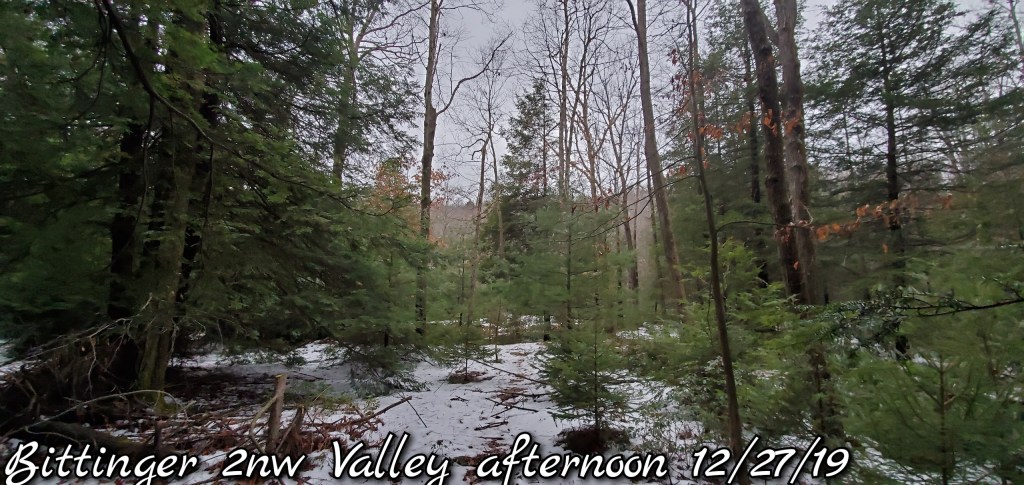
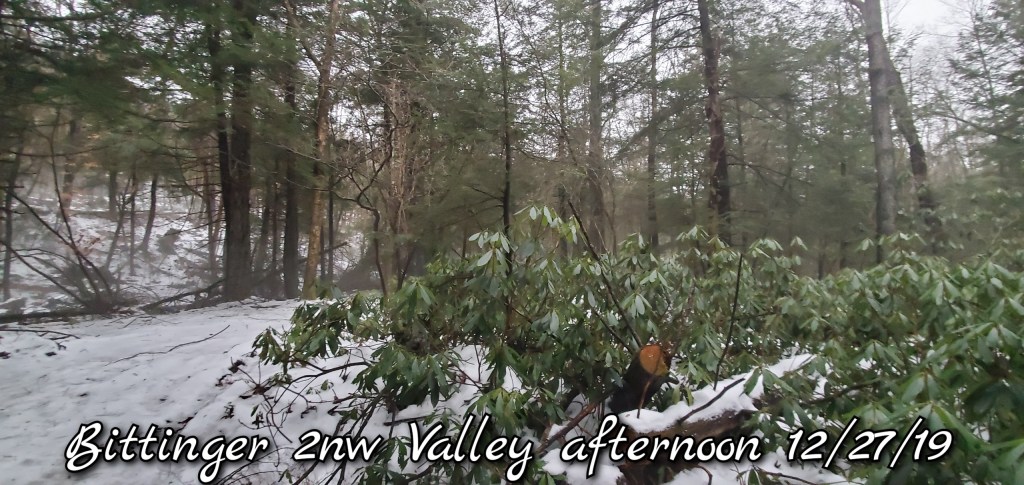
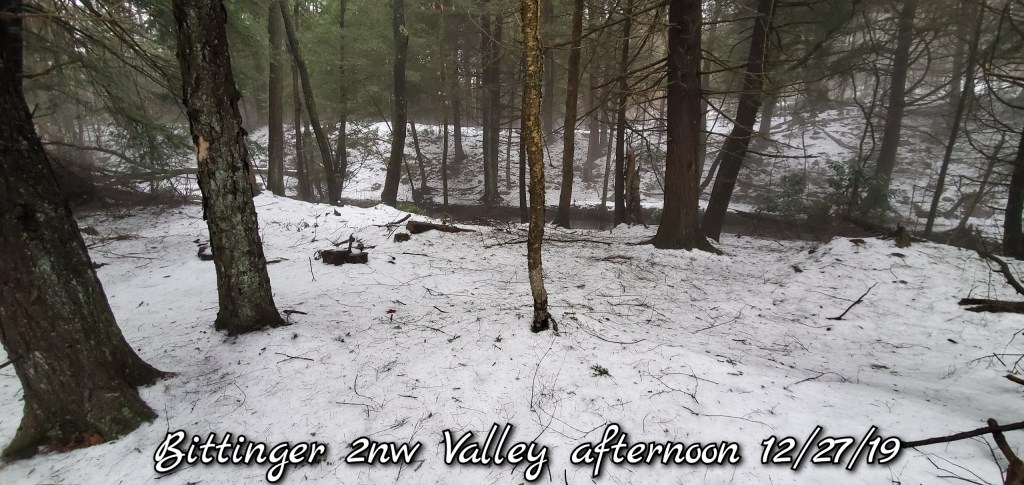
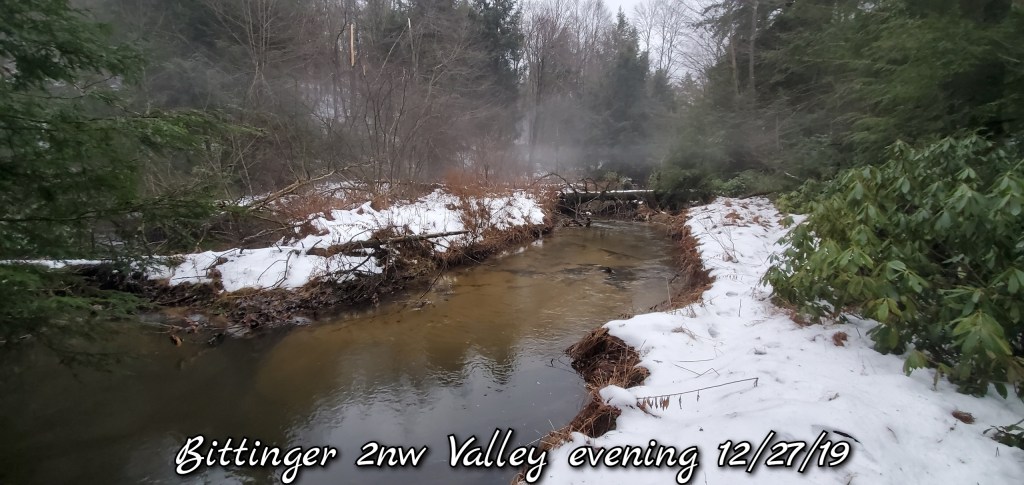
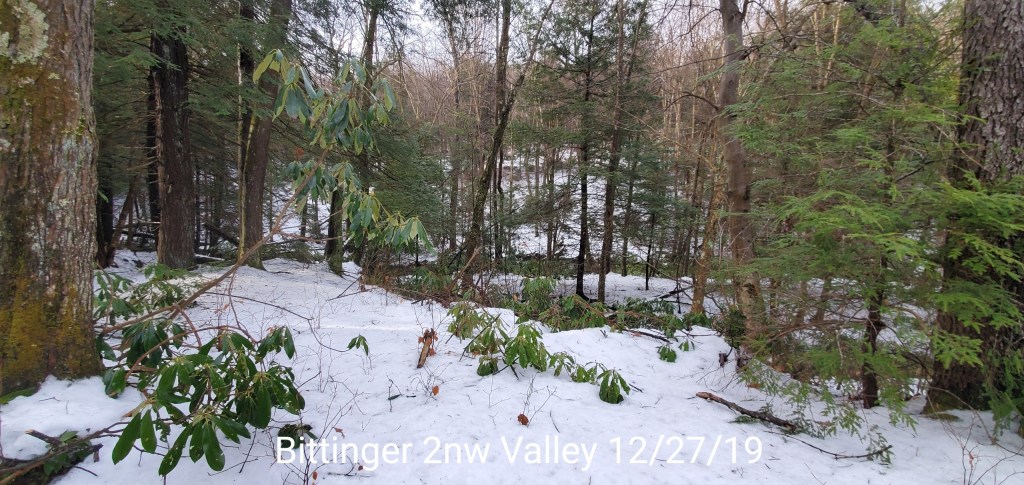
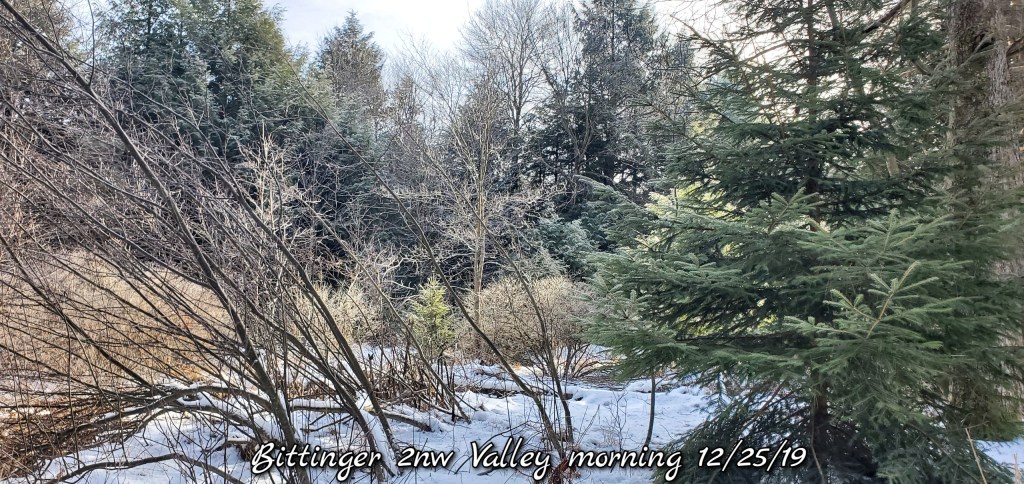
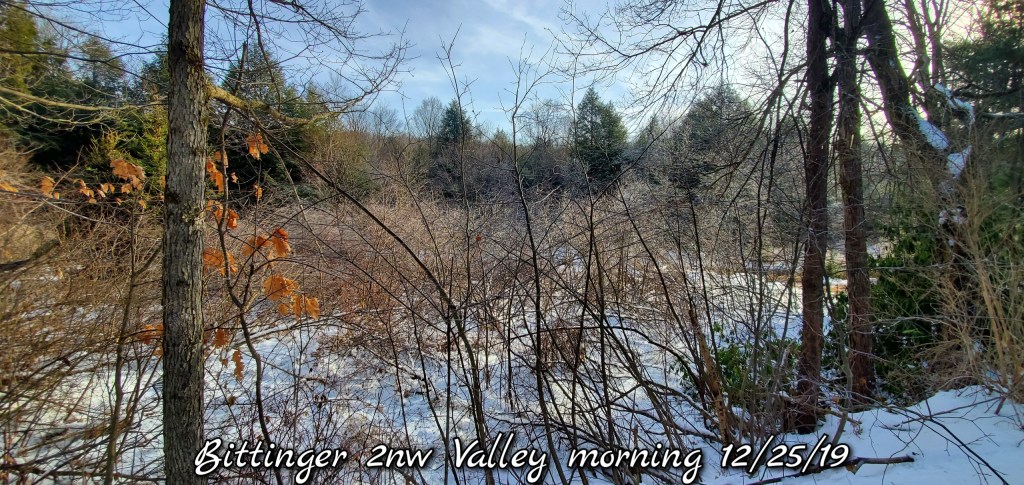
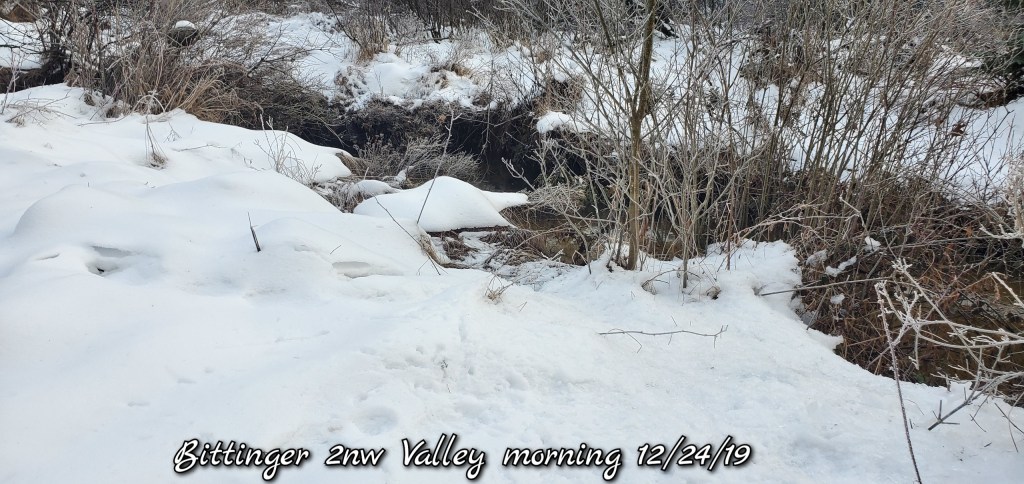
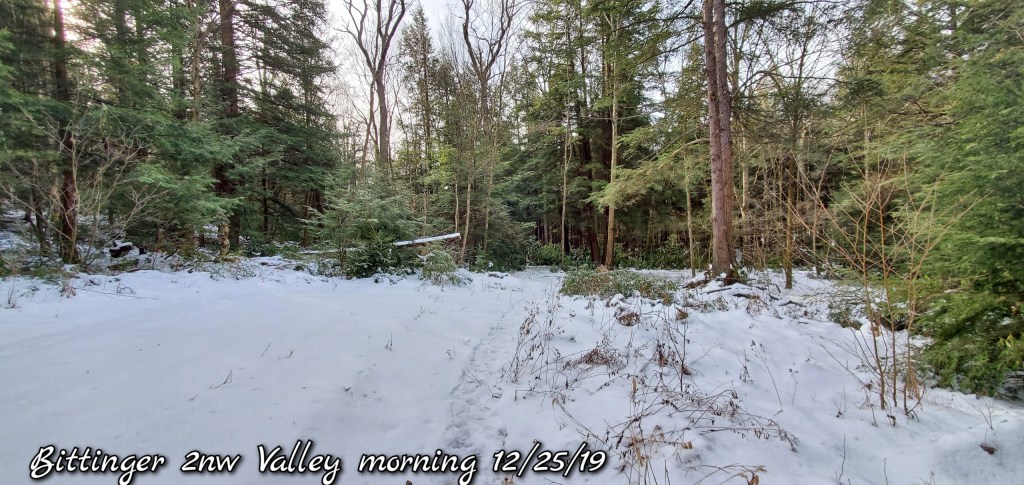
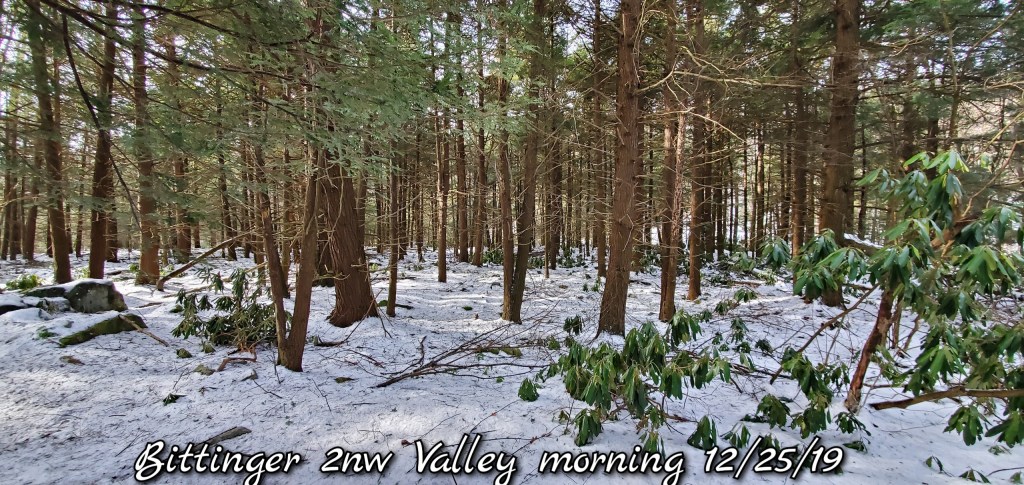
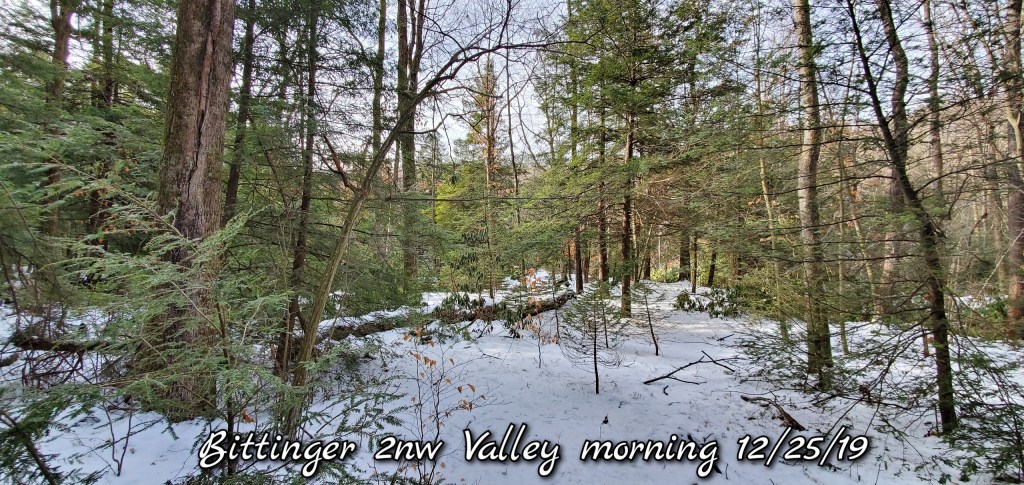
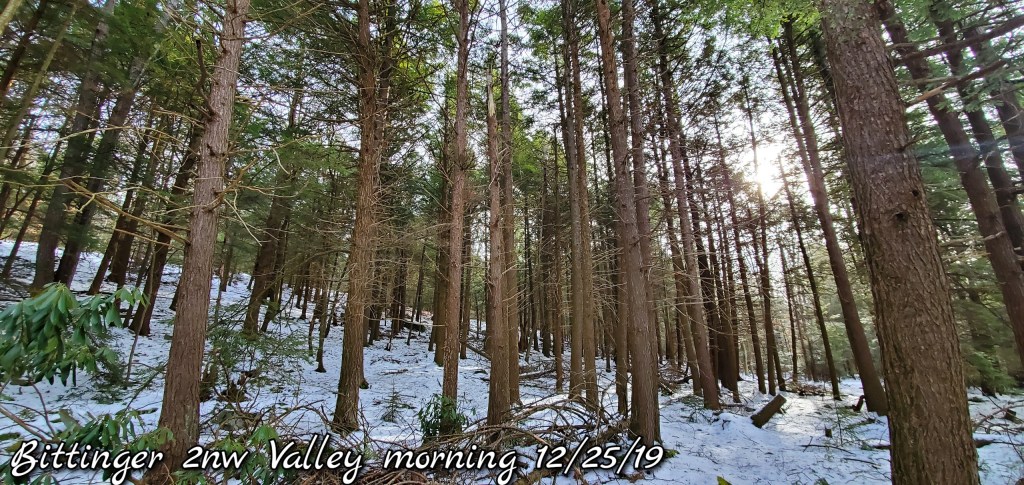
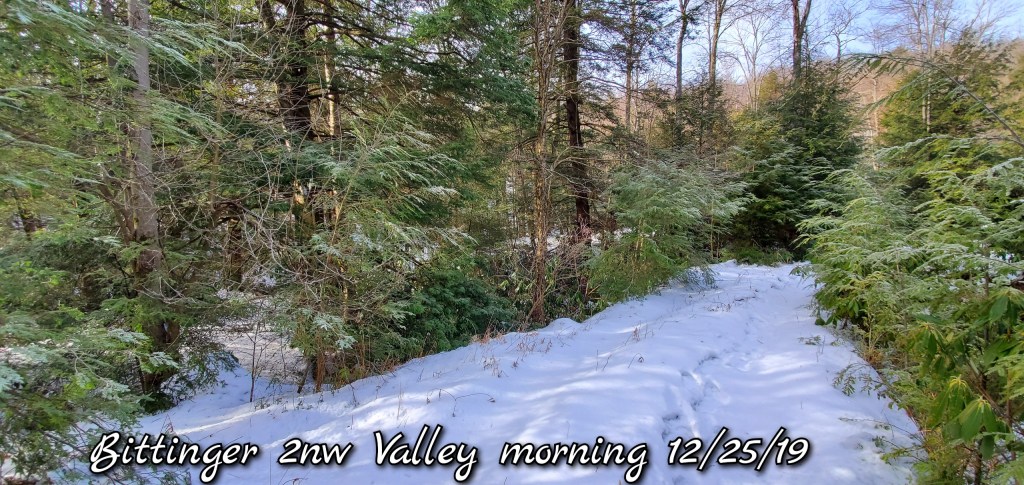
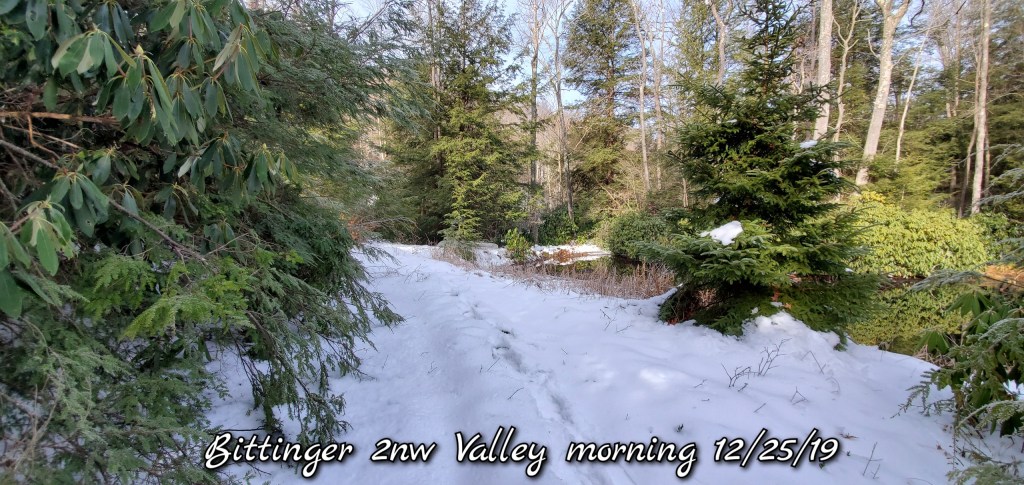
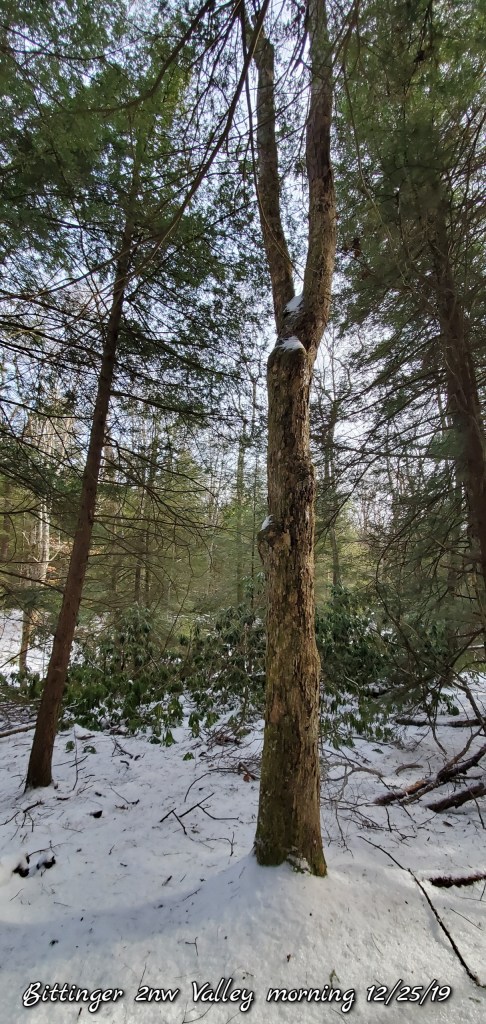
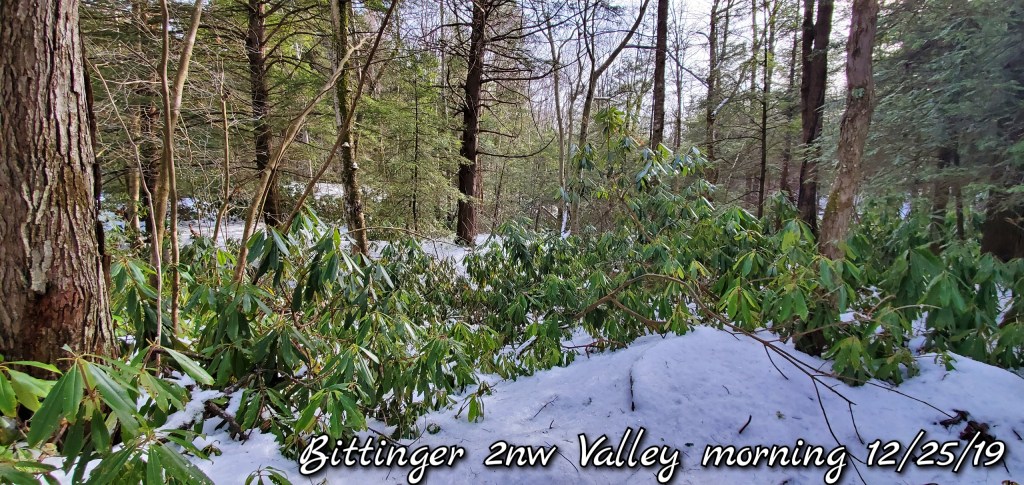
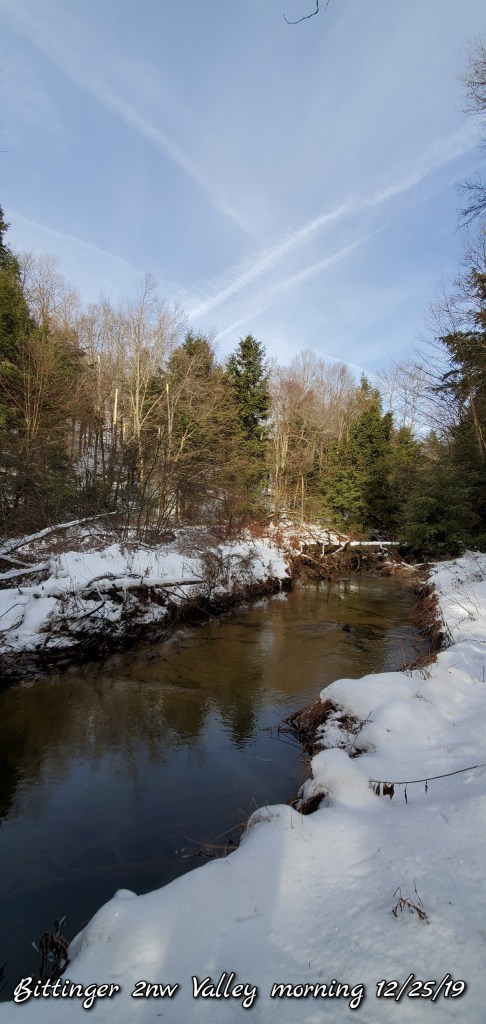
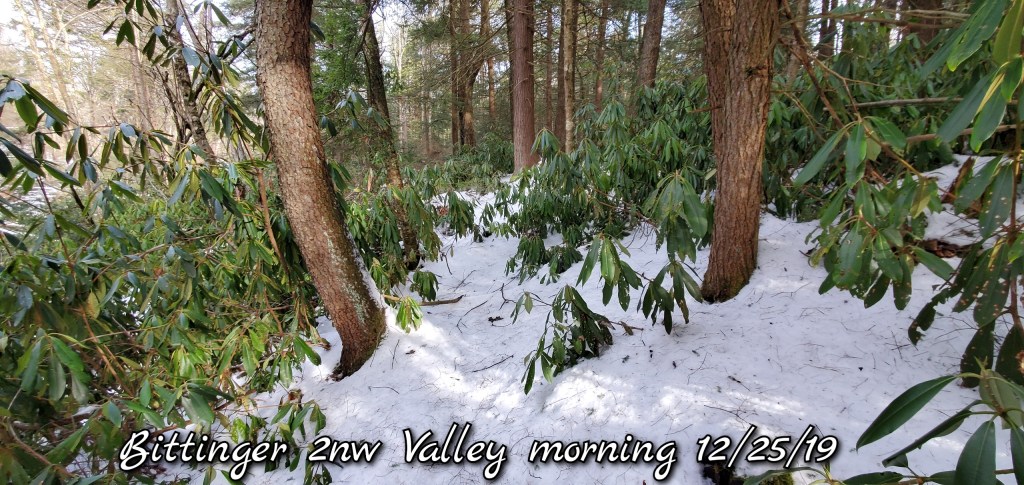
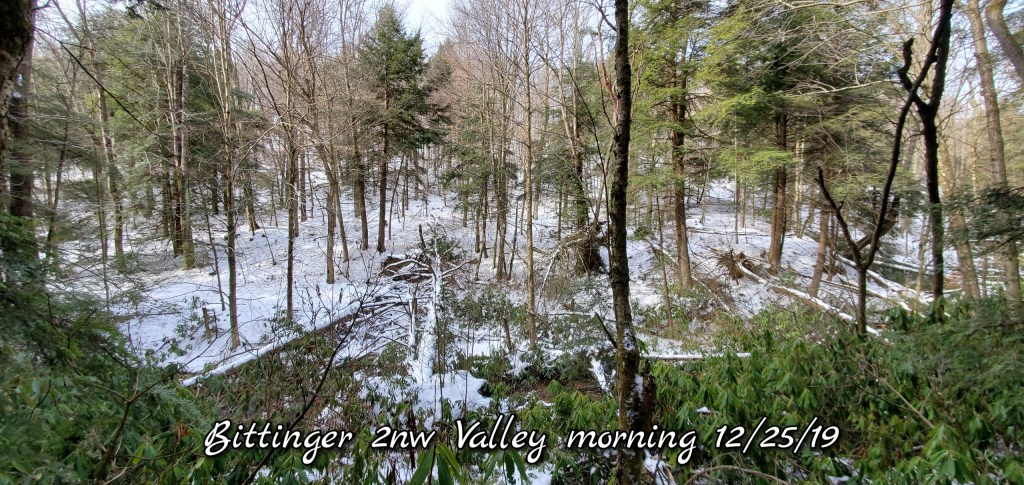
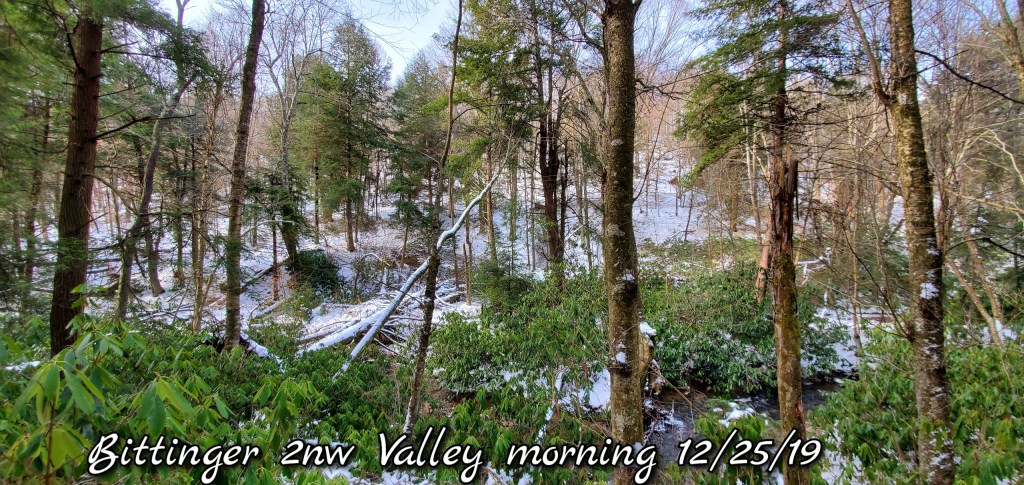
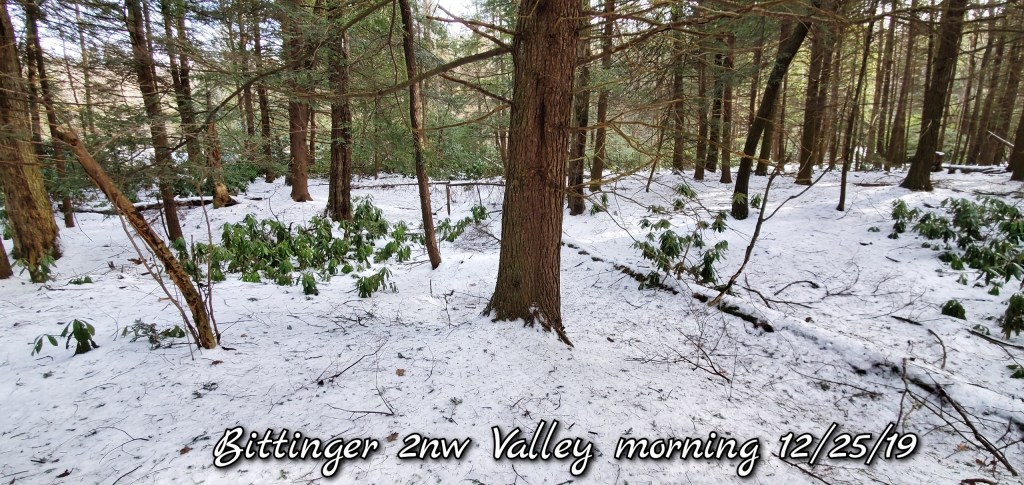
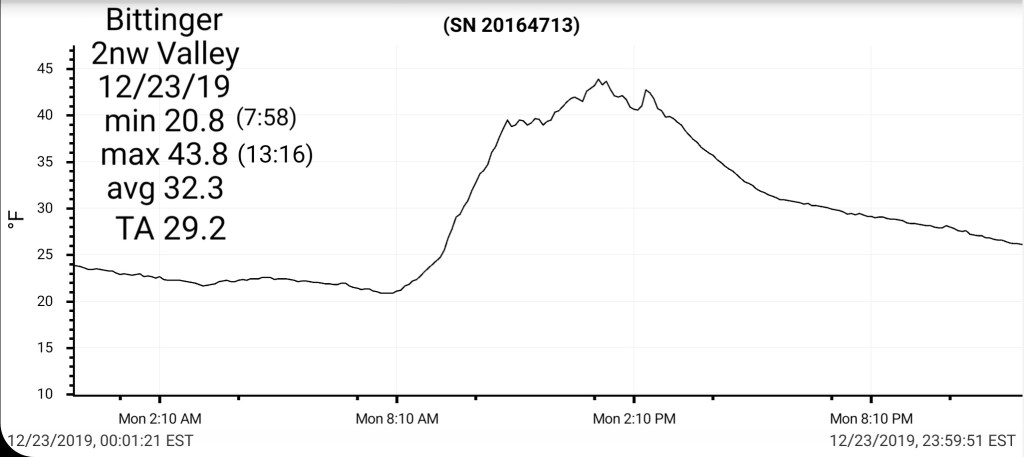
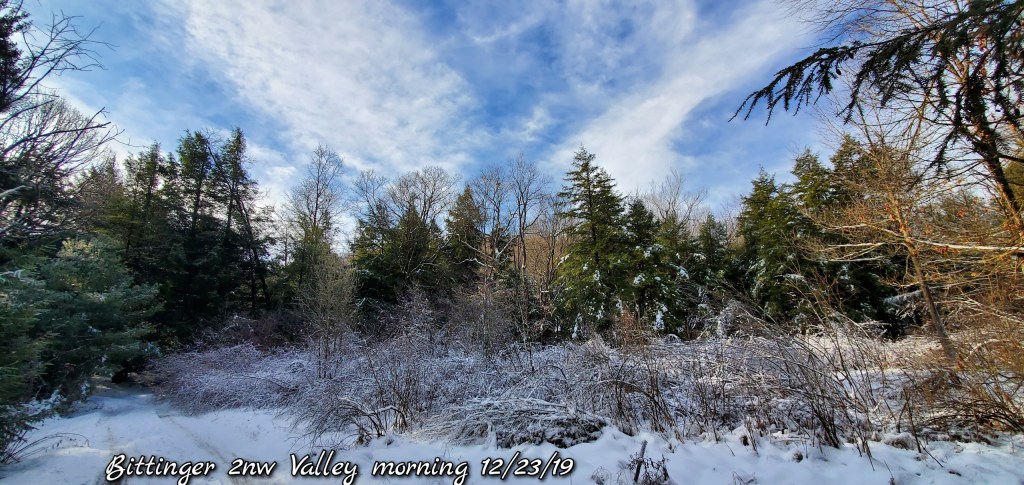
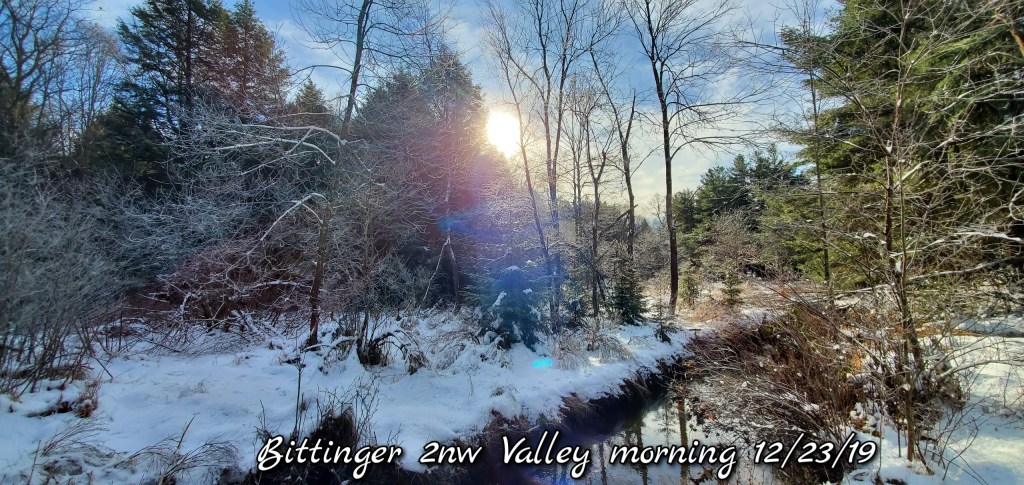
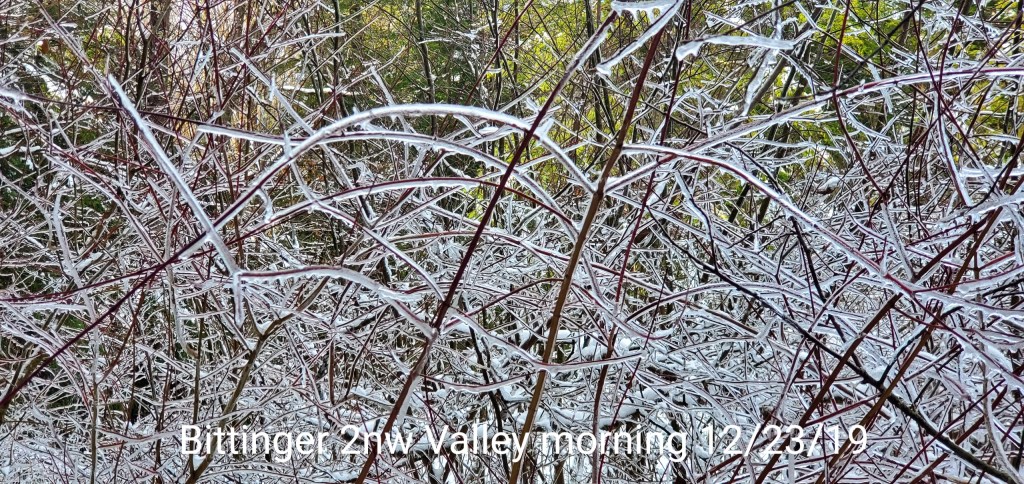
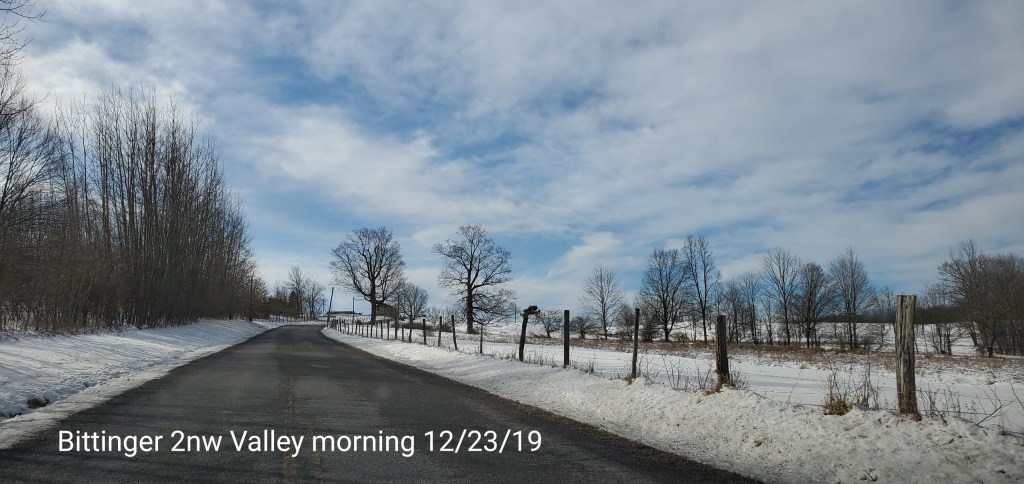
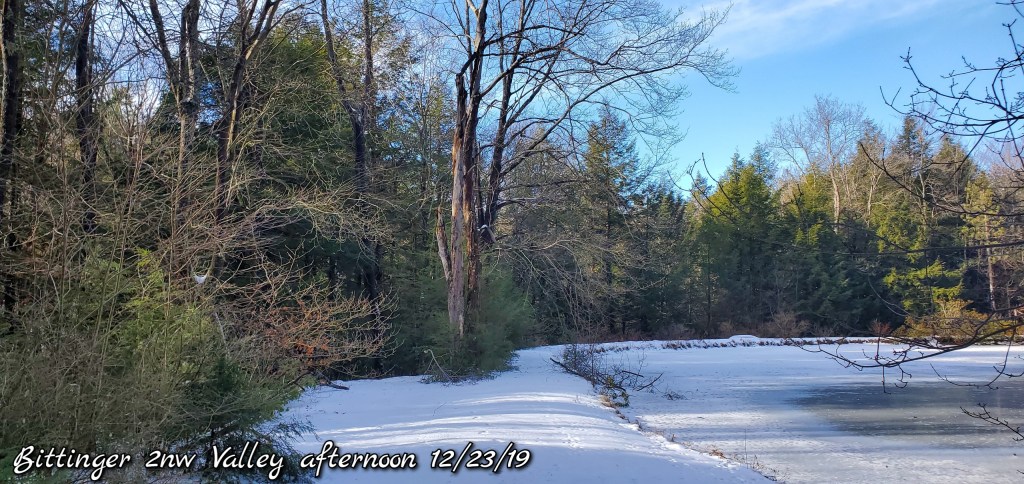
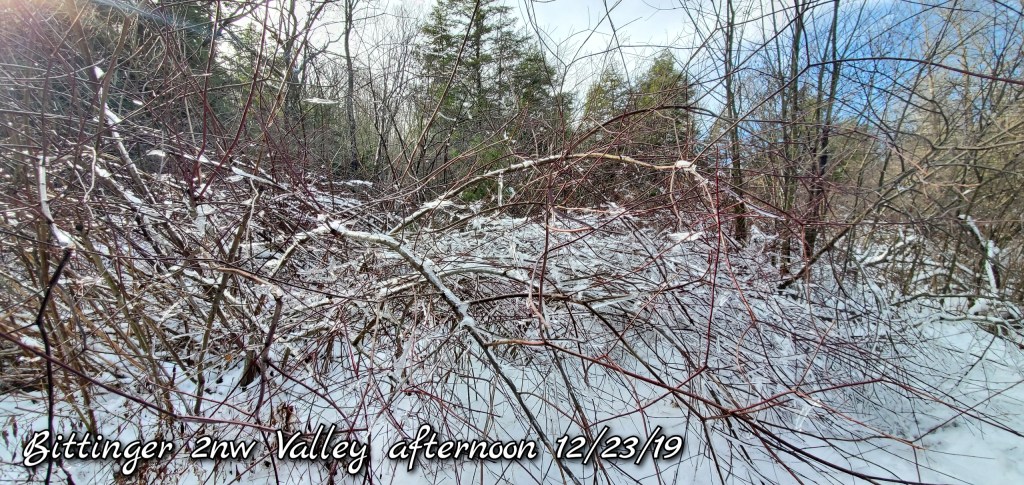
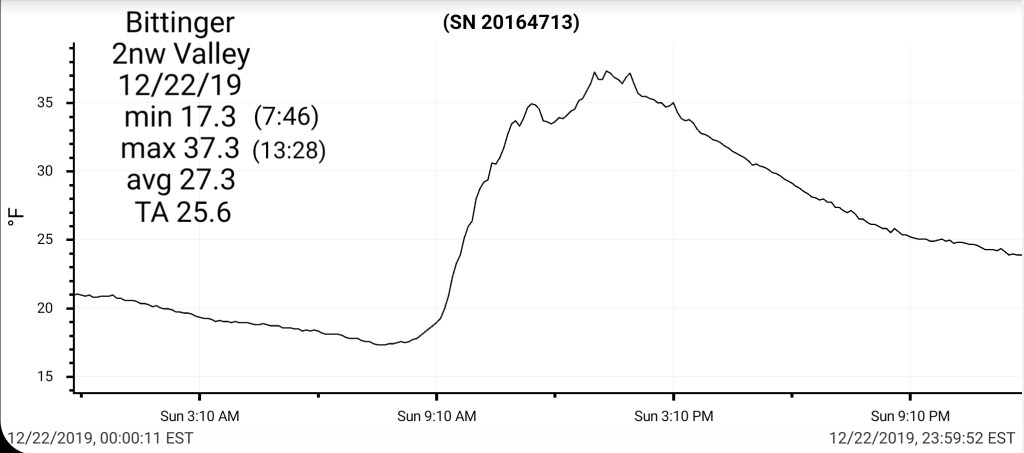
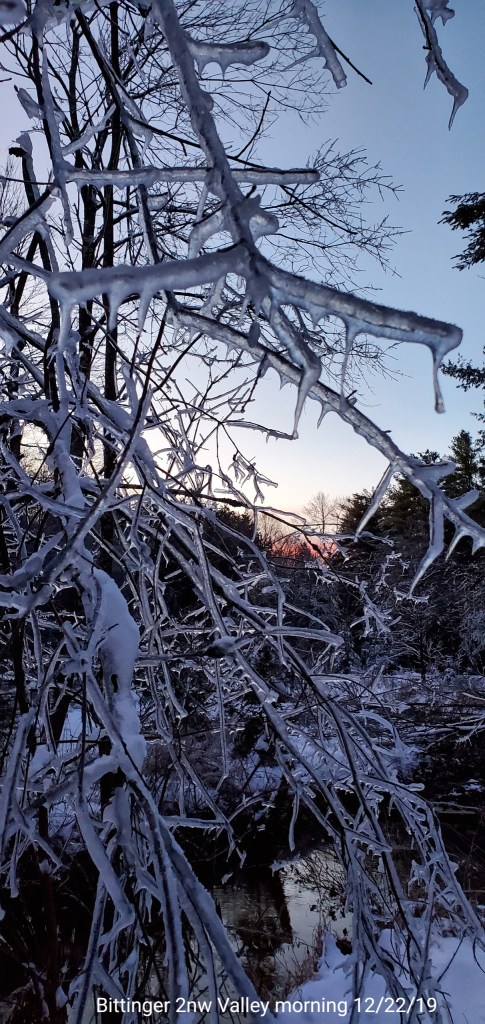
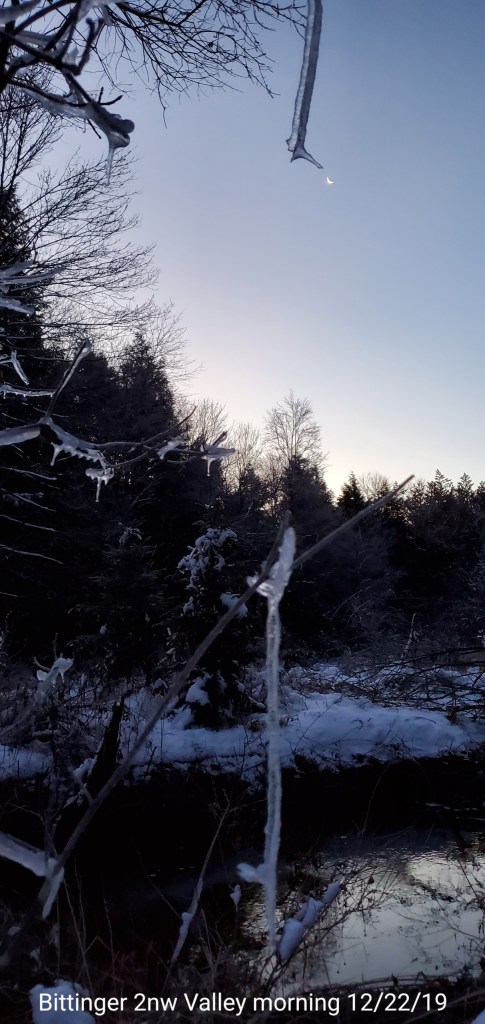
Bittinger 2nw Valley
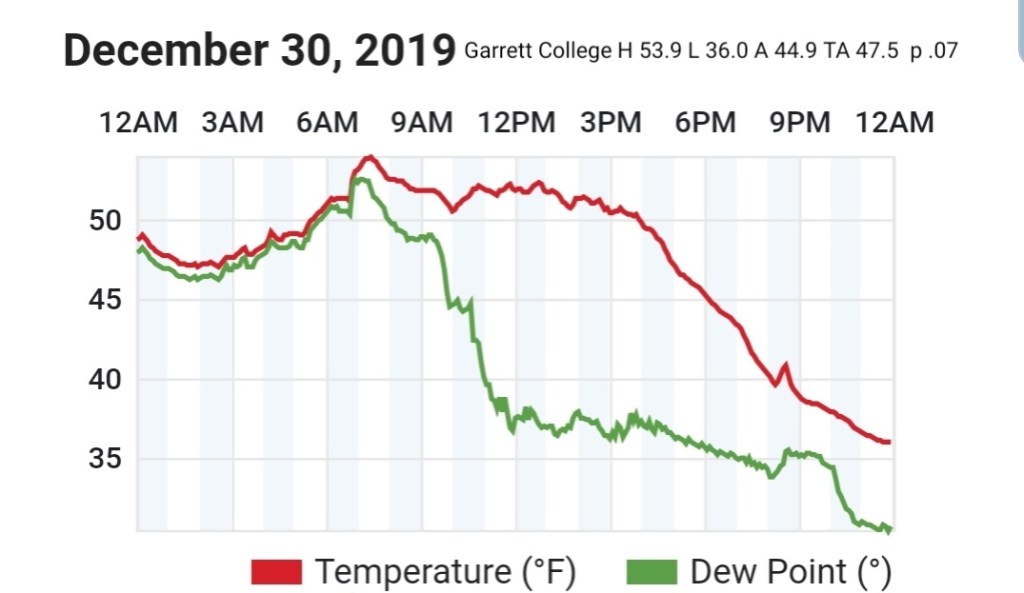
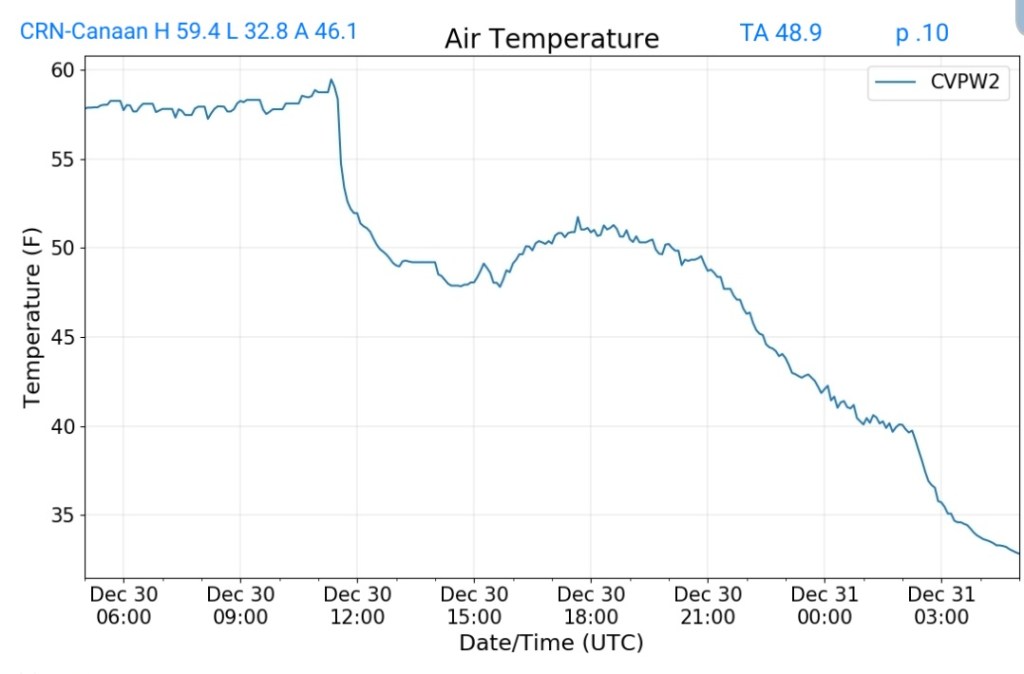
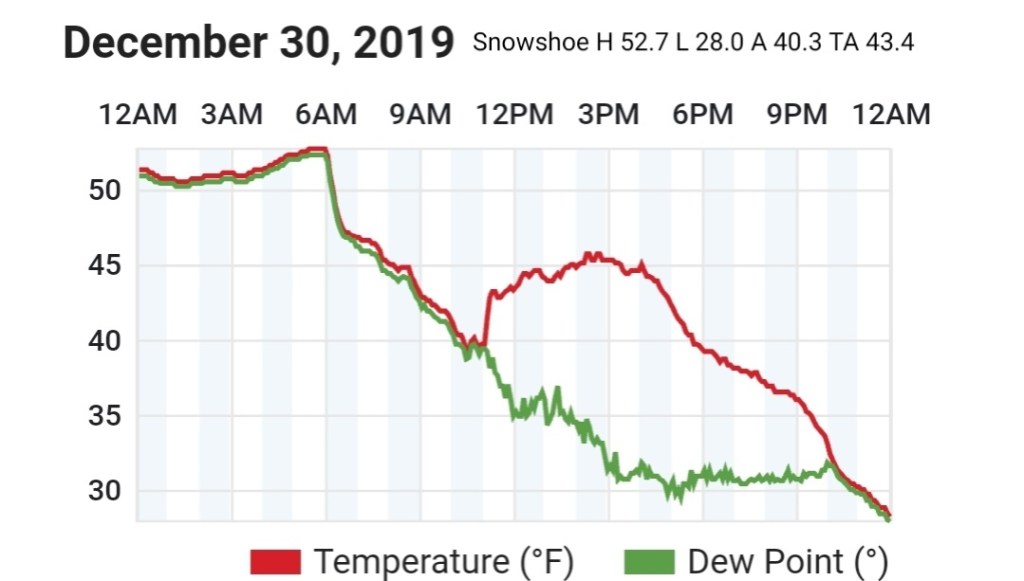
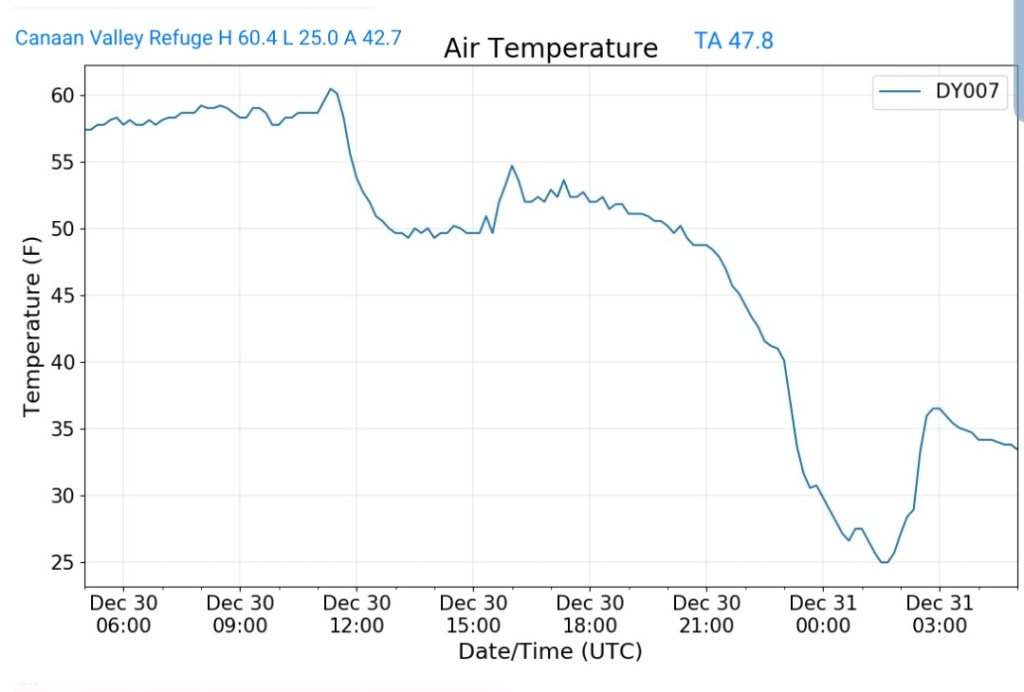
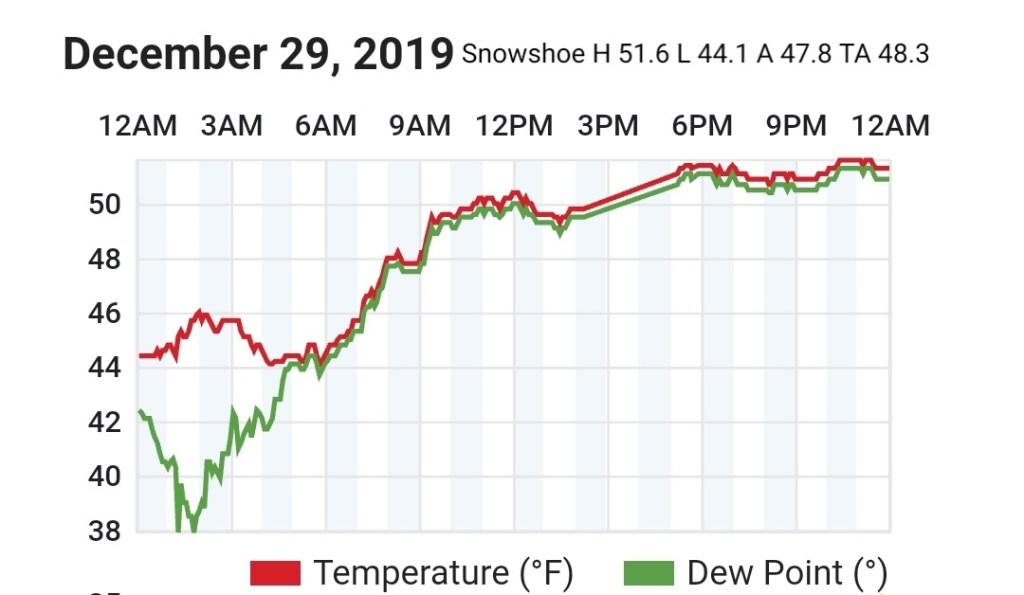
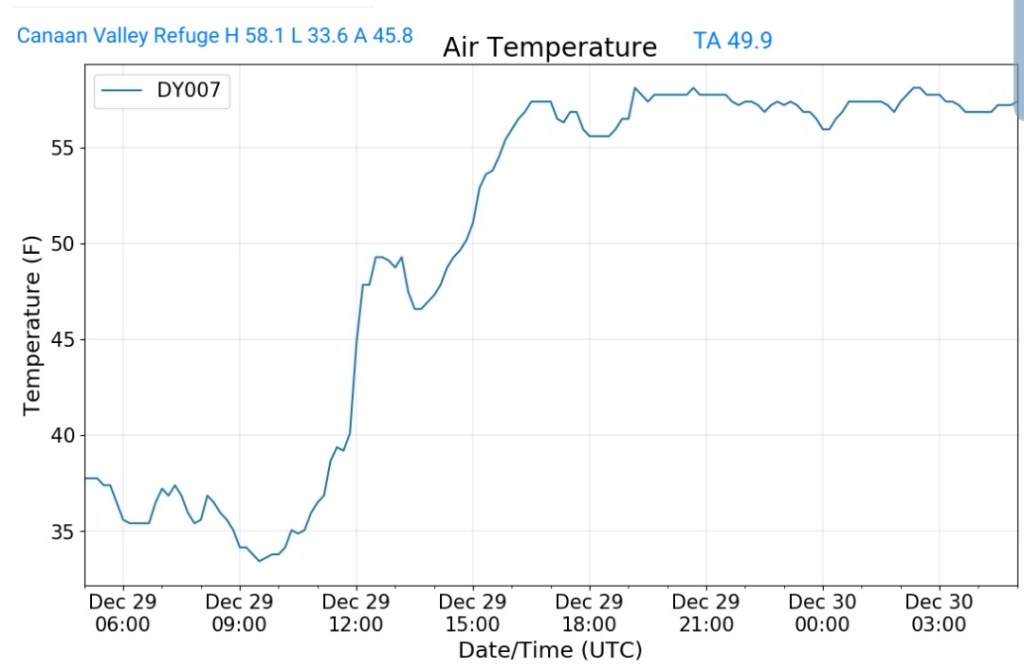
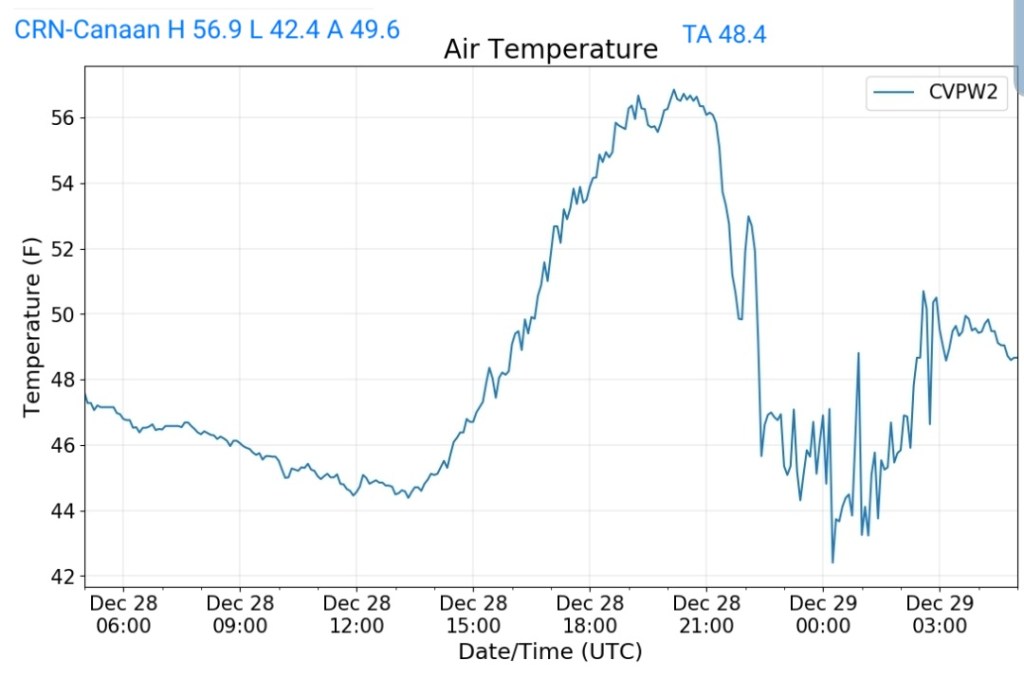
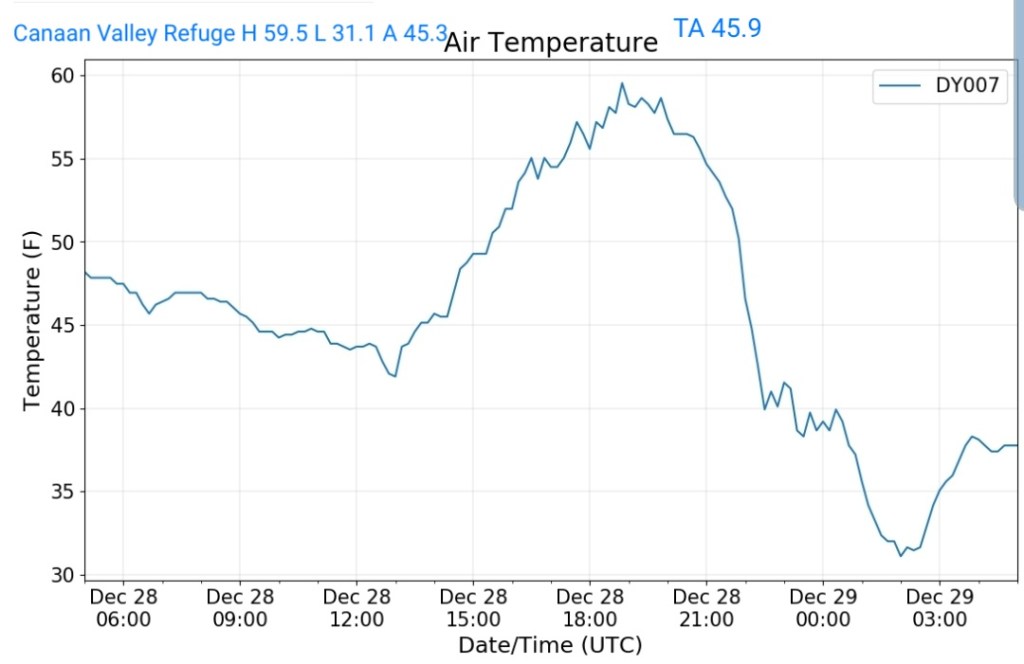
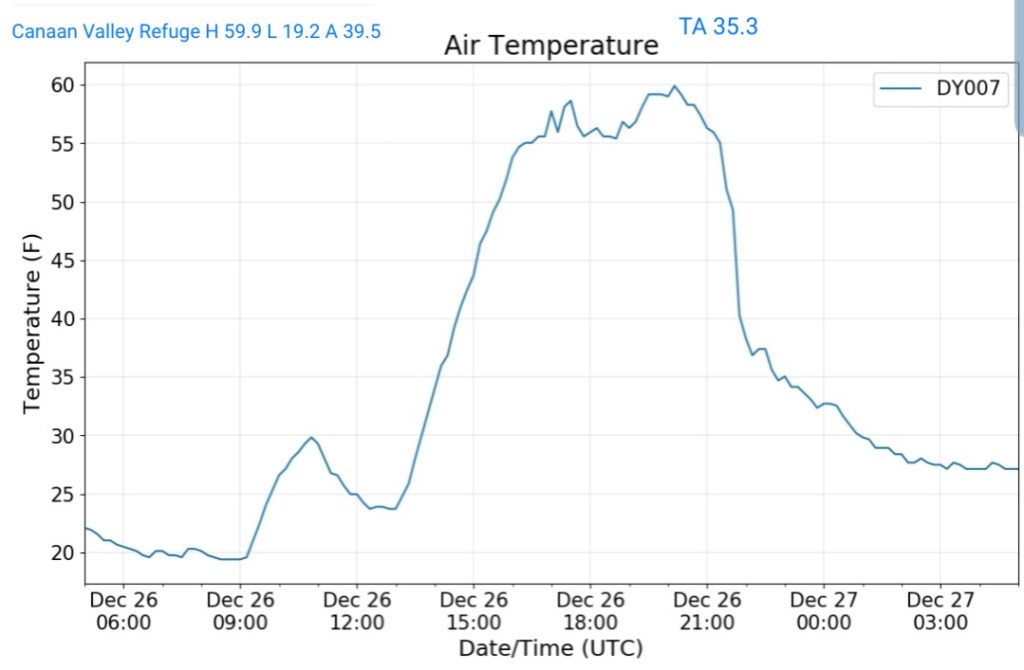
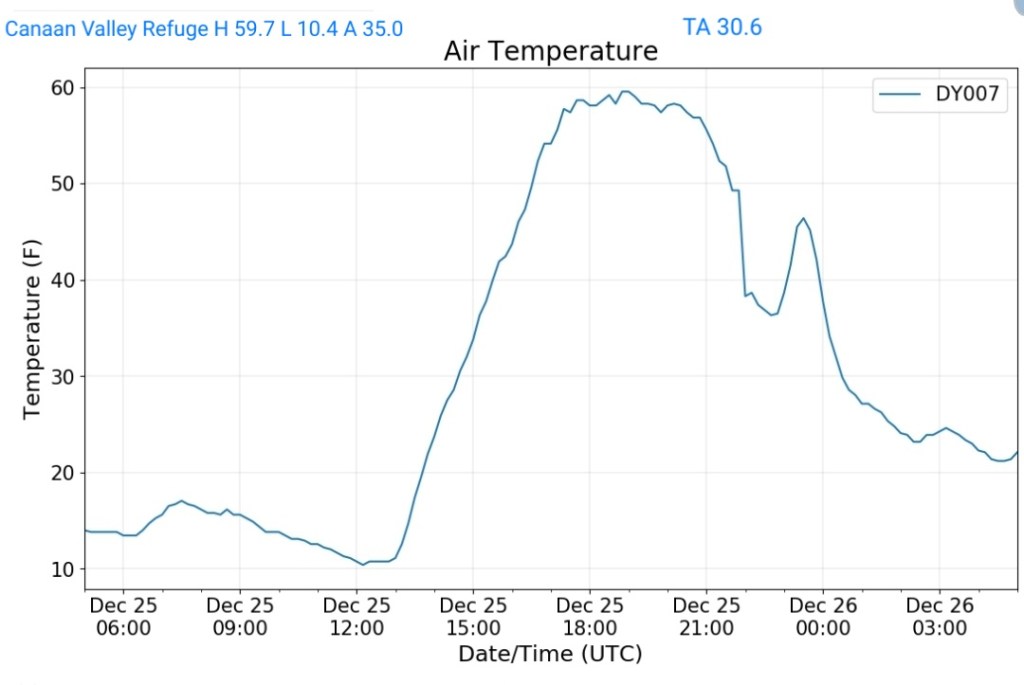
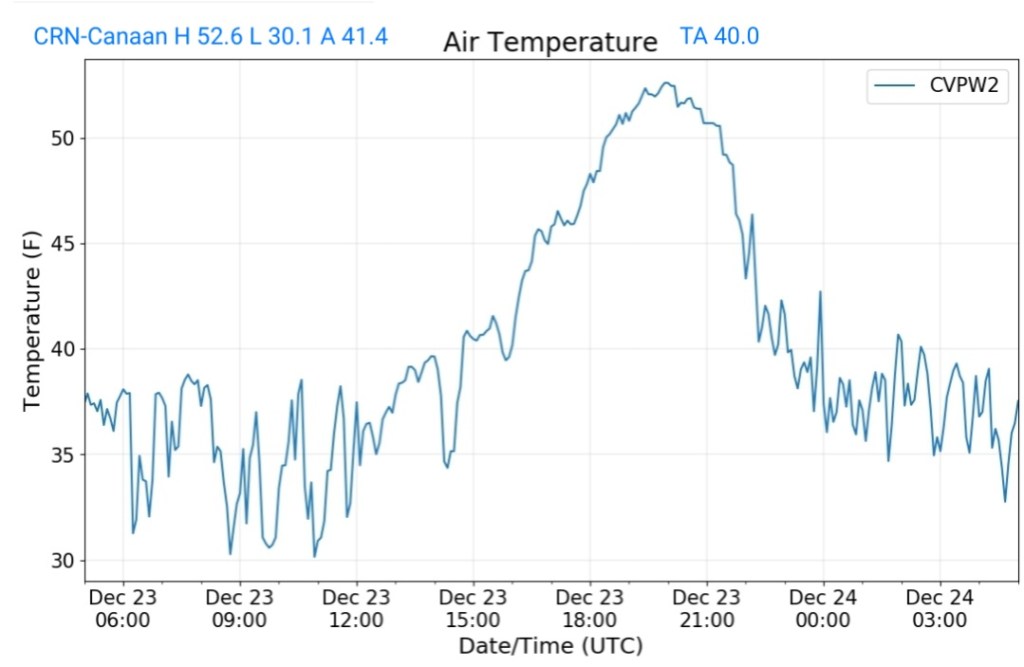
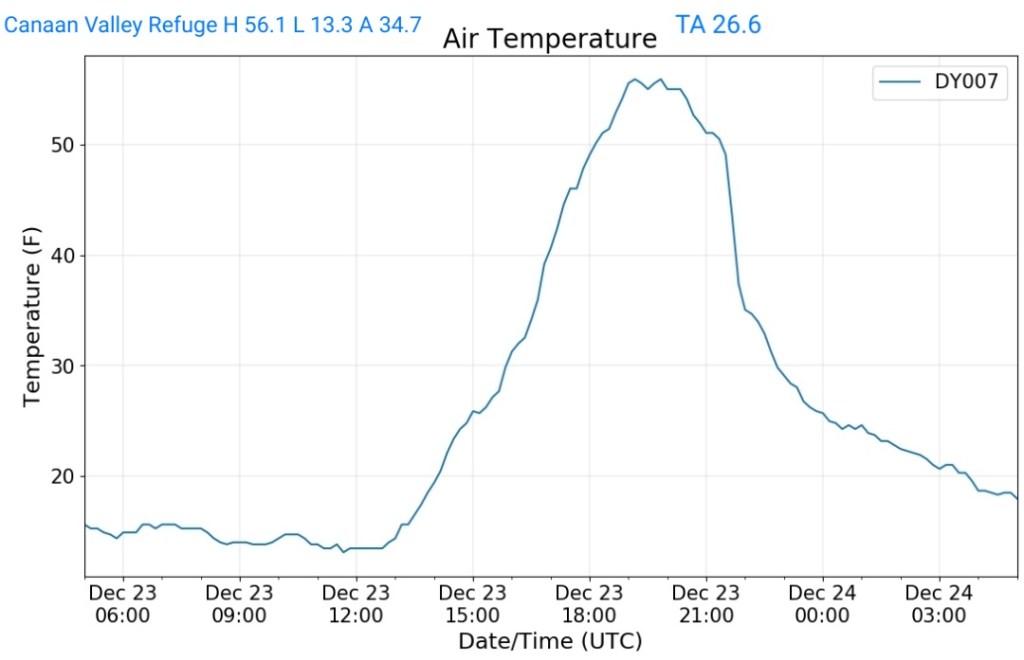
Canaan Valley Refuge
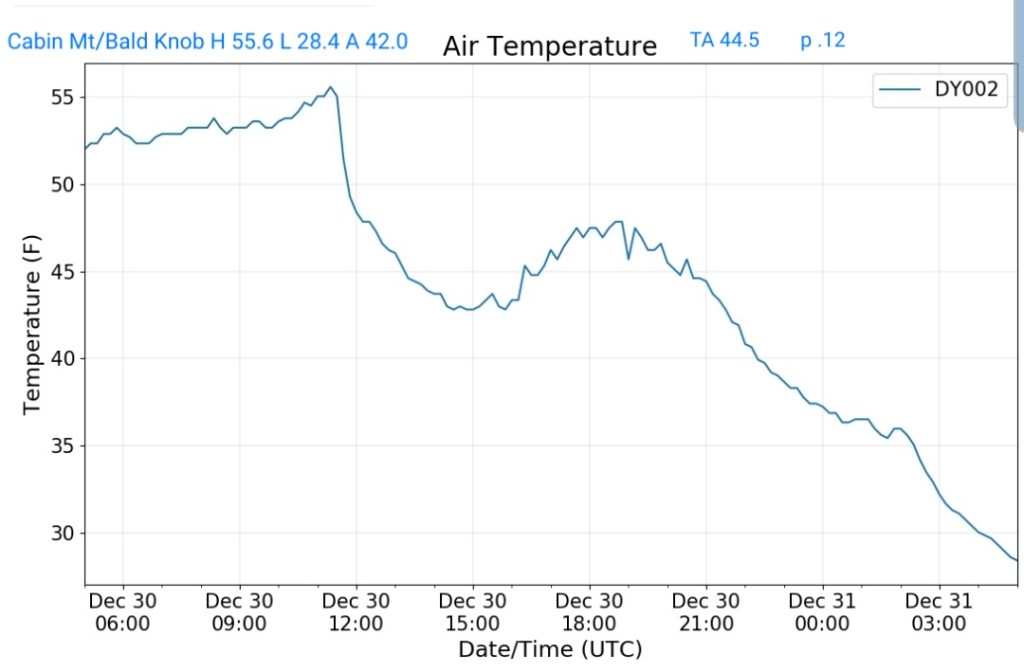
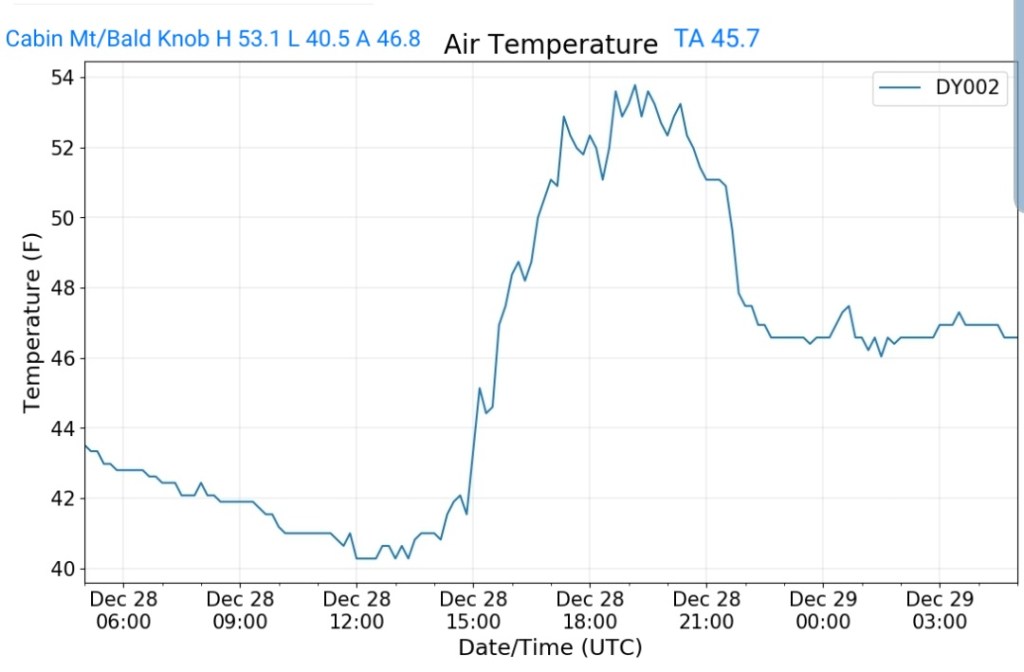
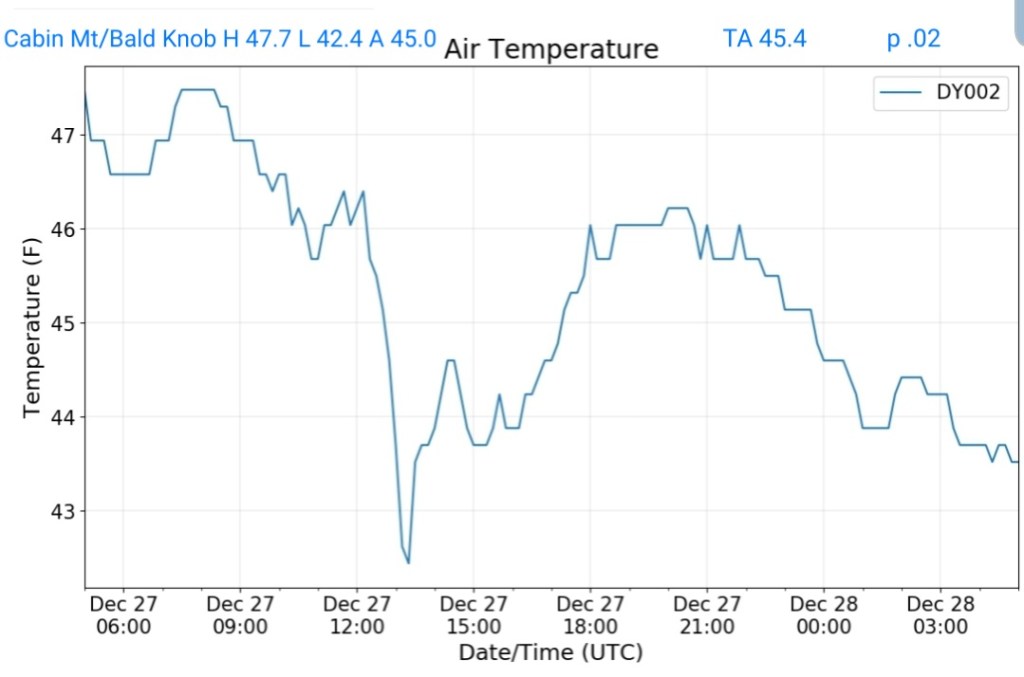
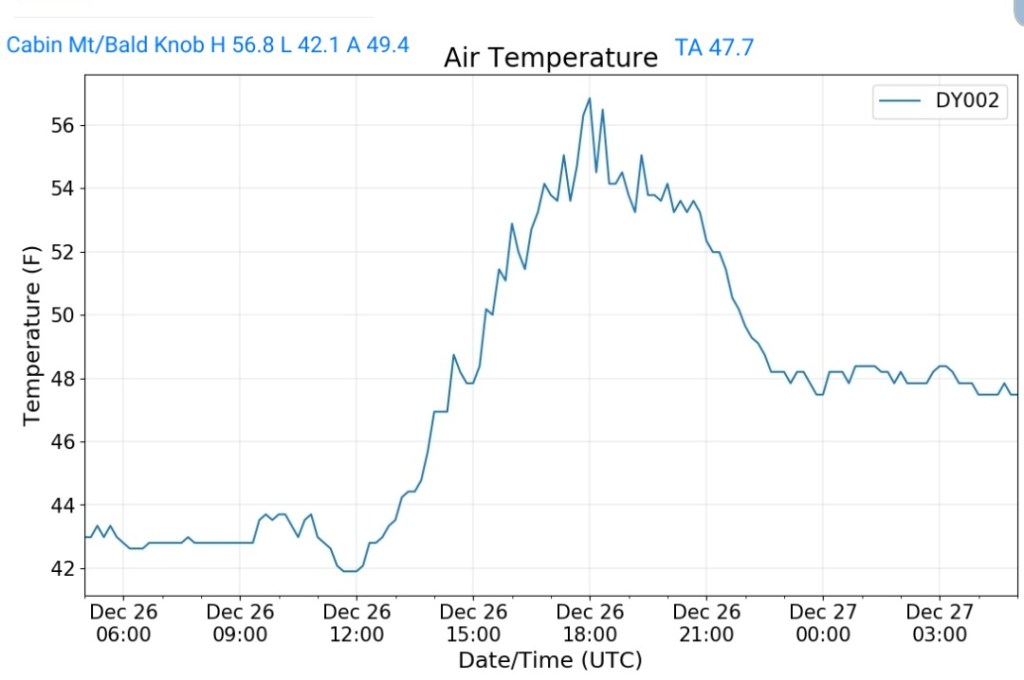
Bald Knob
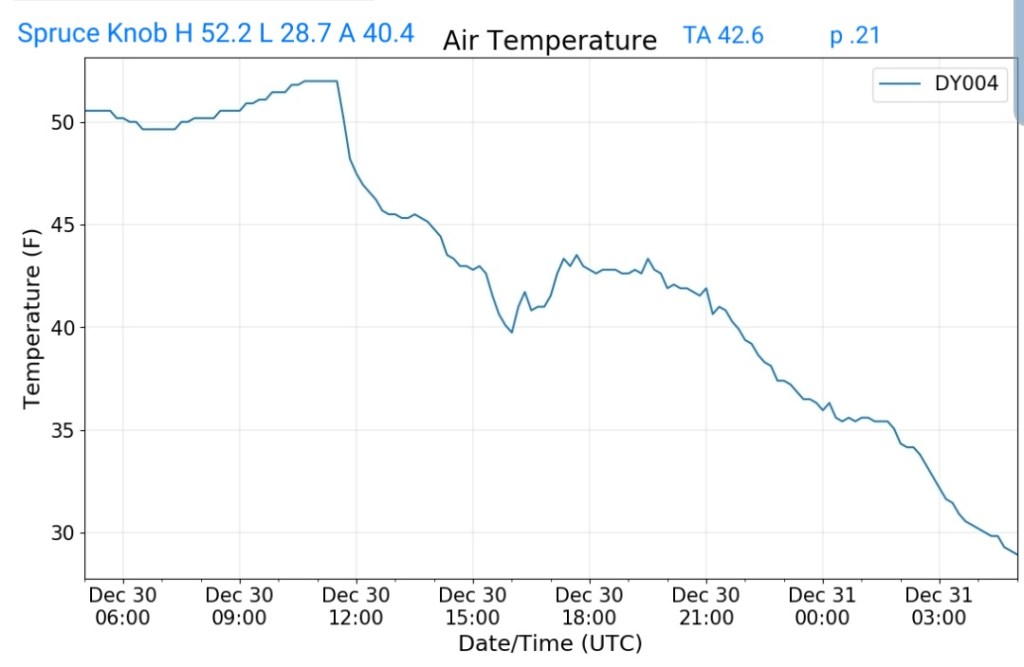
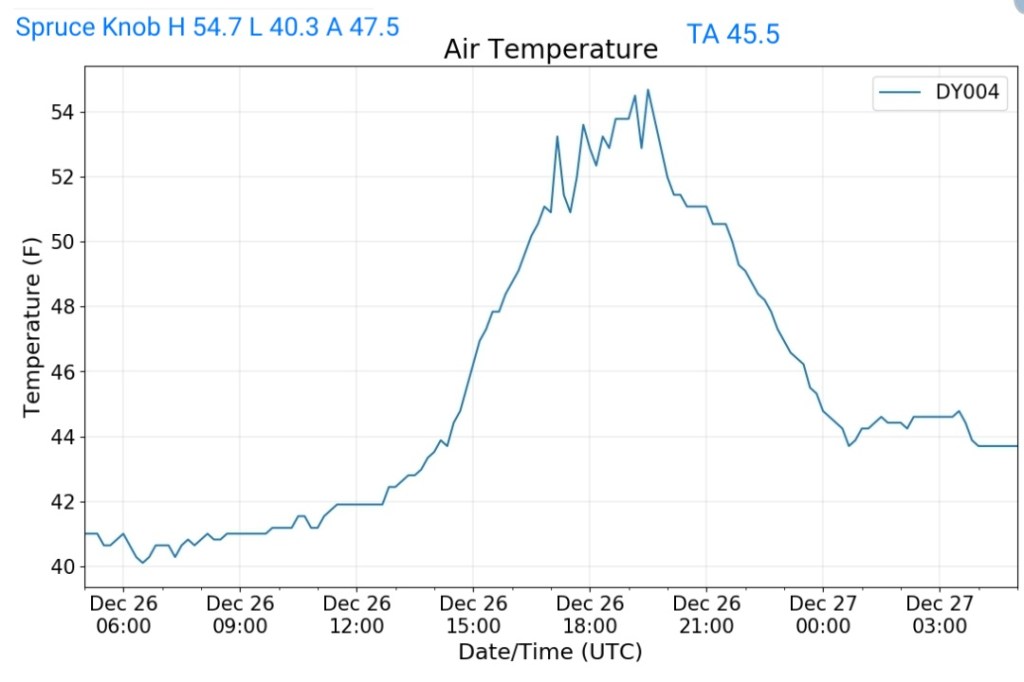
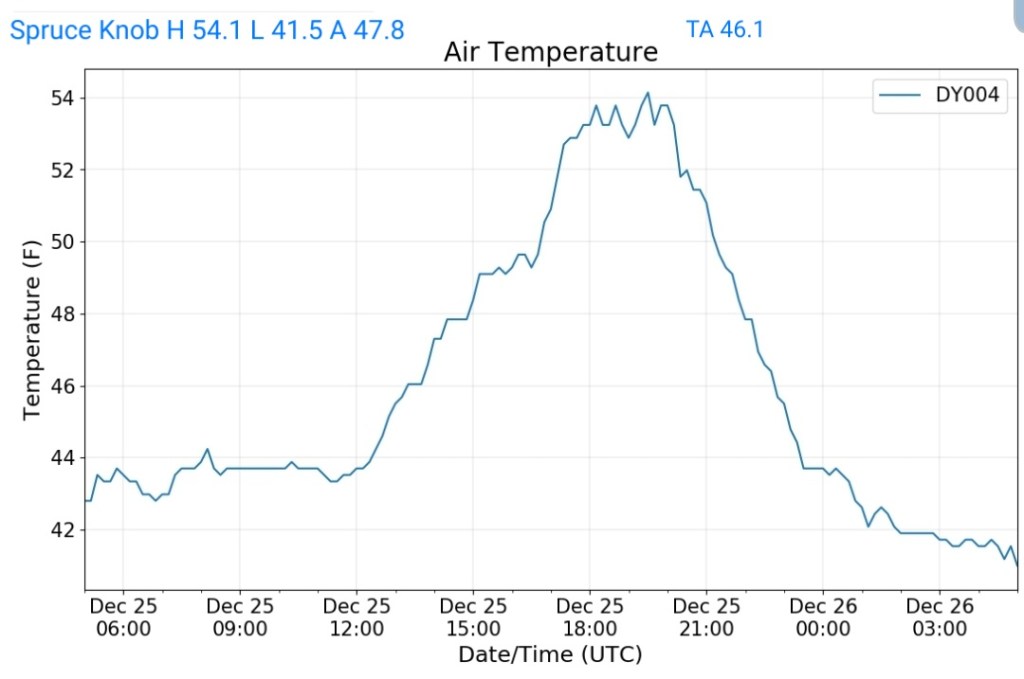
Spruce Knob
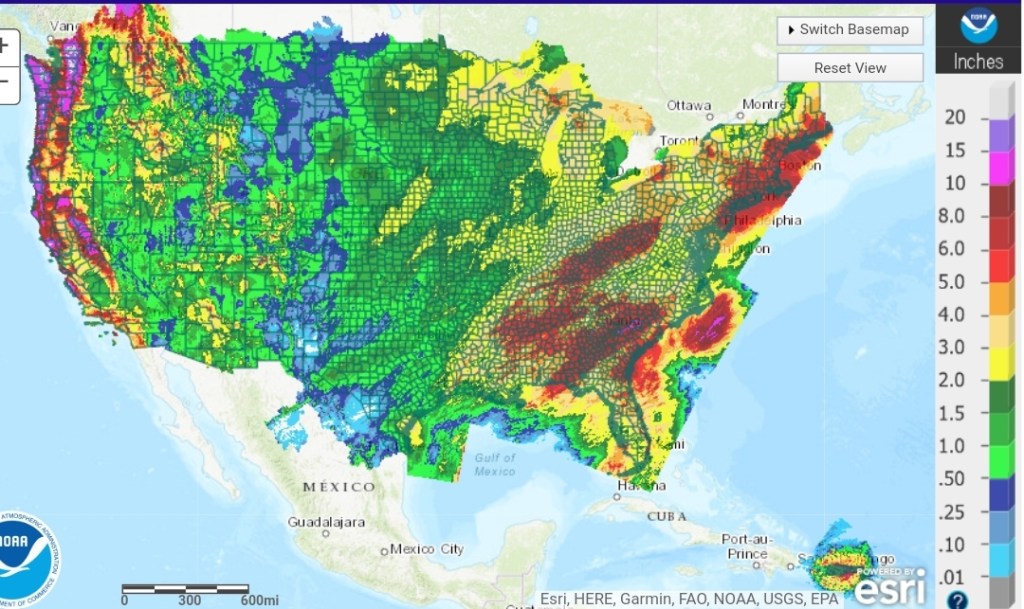
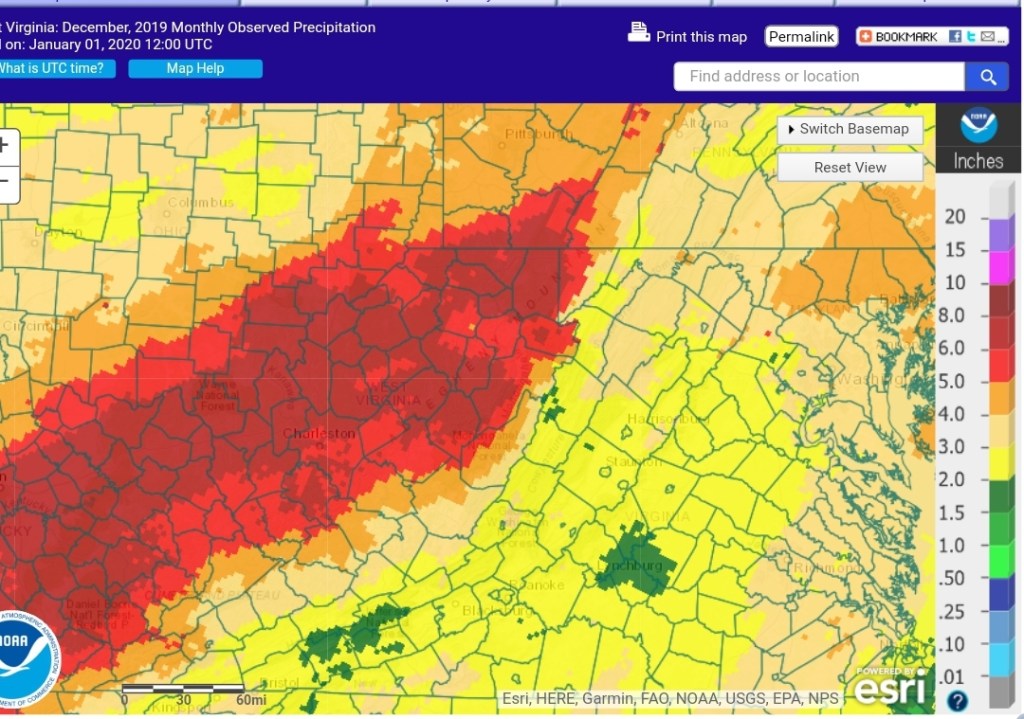
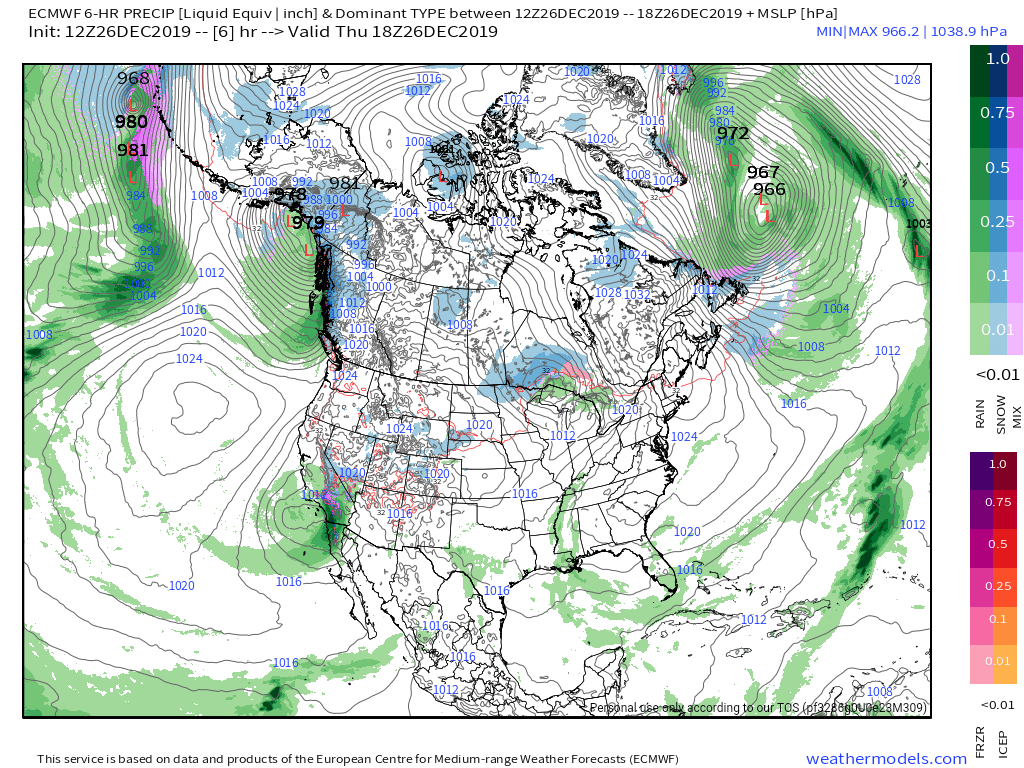
Precip
GFS OPERATIONAL ON ITS OWN……
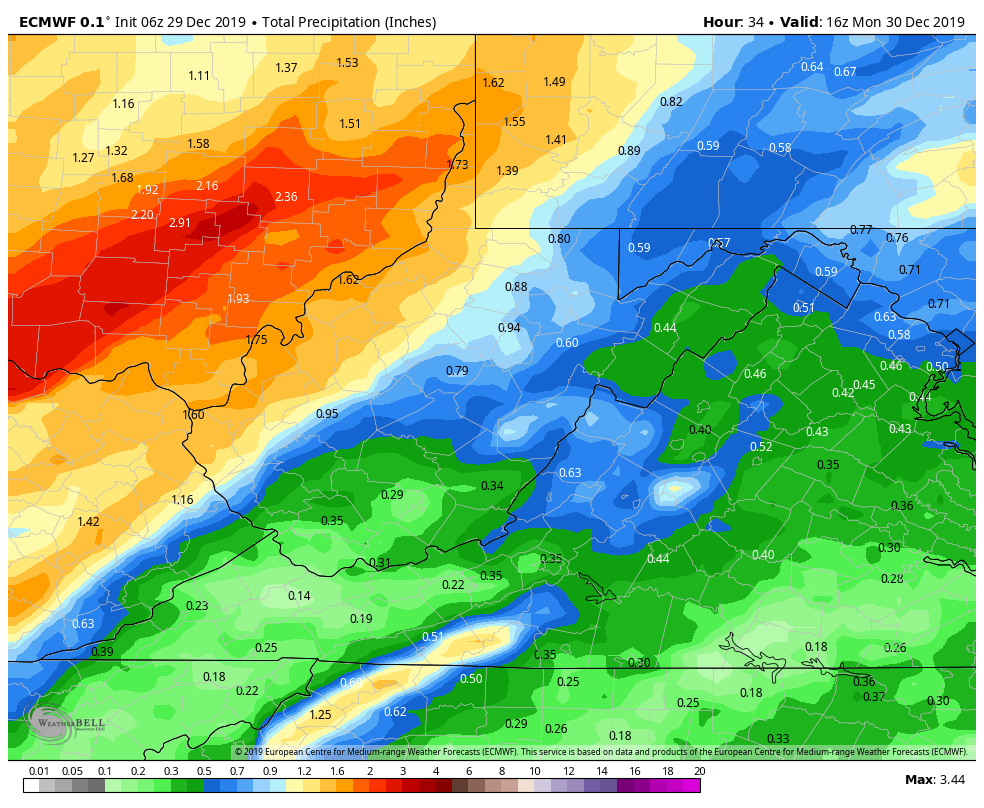
The GFS operational recieved an upgrade over this past year, the GFS ensemble package did not. This new upgrade is going to score big or continue to look lost in the long term. The model had performed poorly. Today was a prime example. The ECMWF performed much better with most of its runs showing minimal snow. The 6z, 12z GFS today was showing accumulation directly off initialization of the run. The short range Canadian products and ECMWF had the better idea.
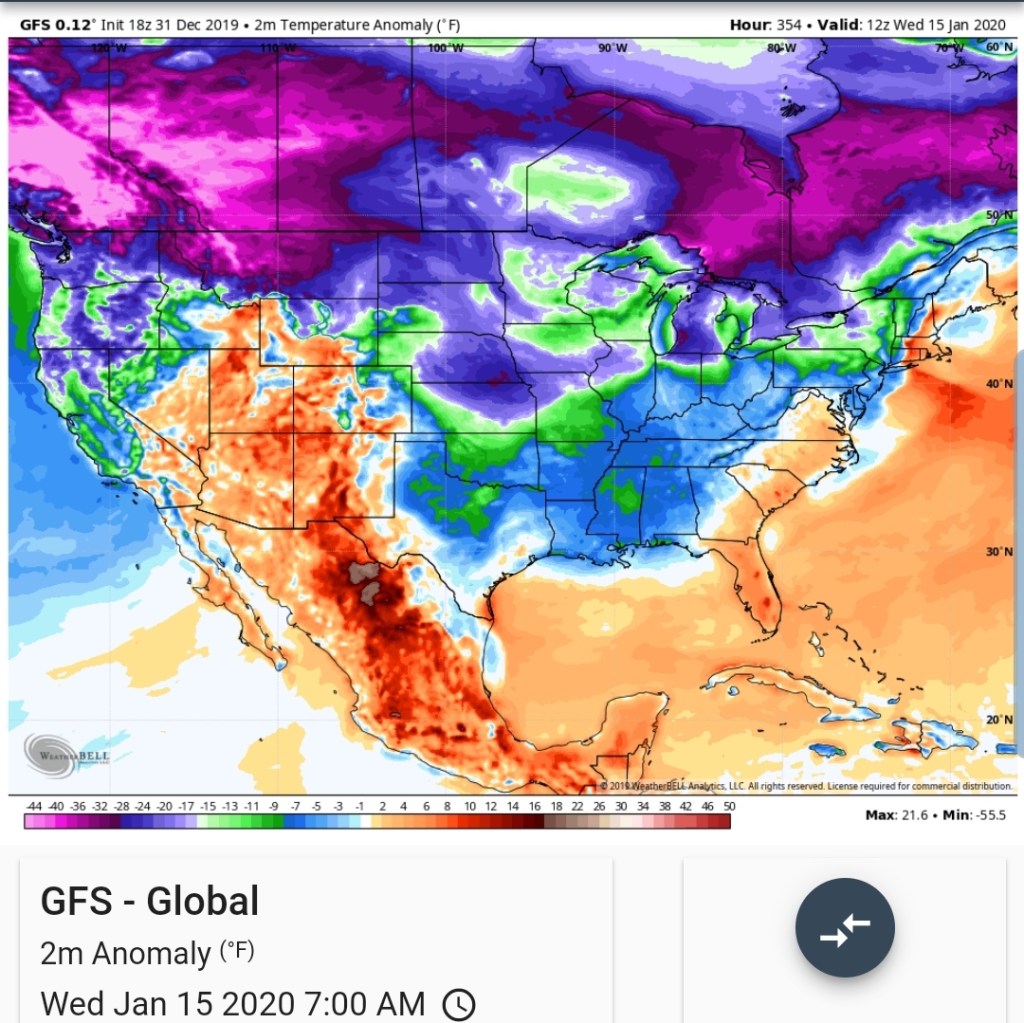
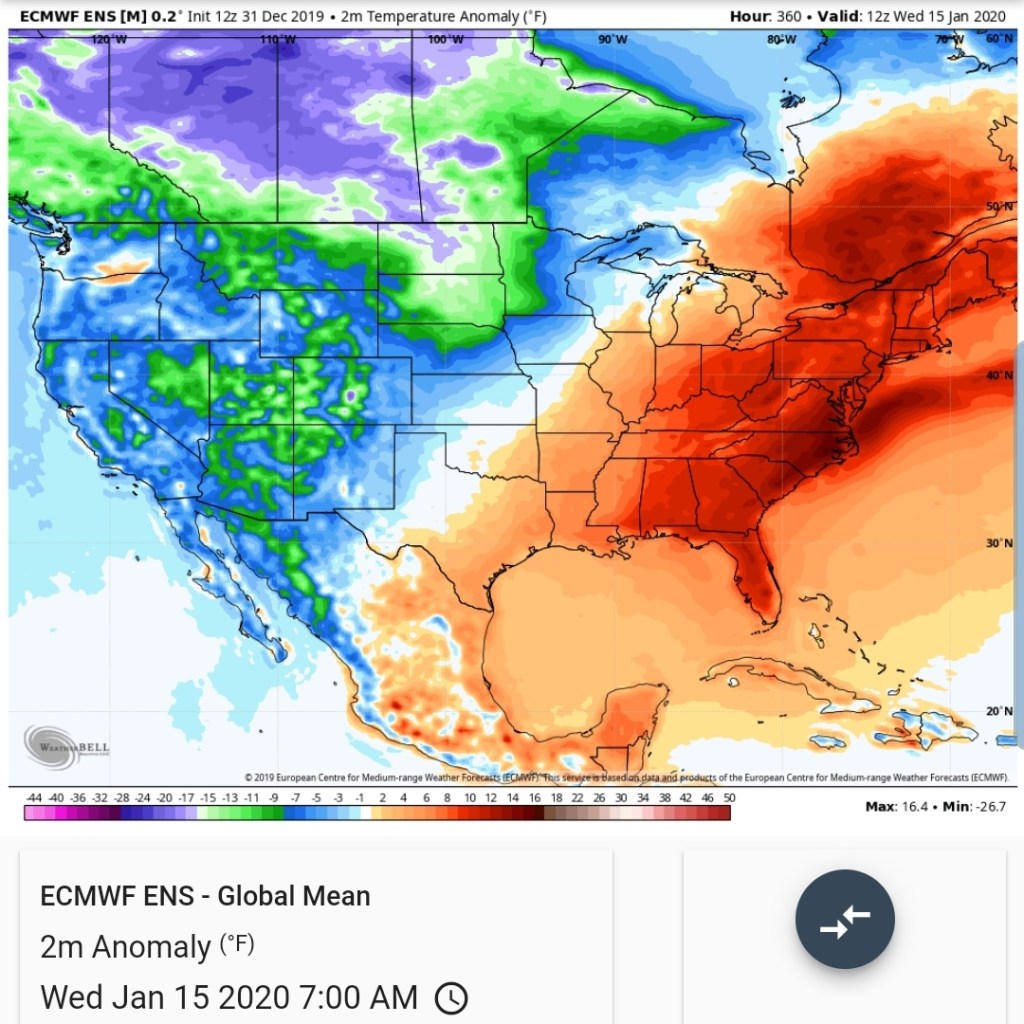
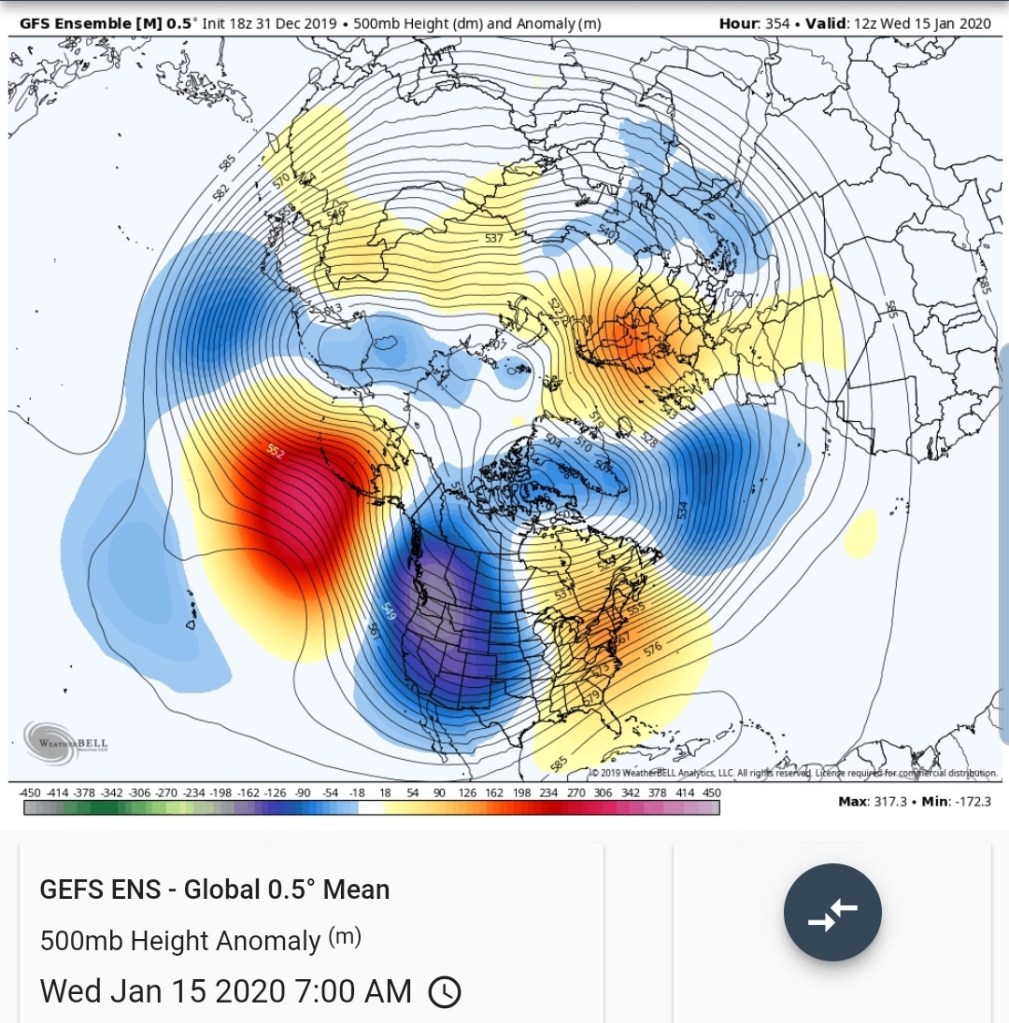
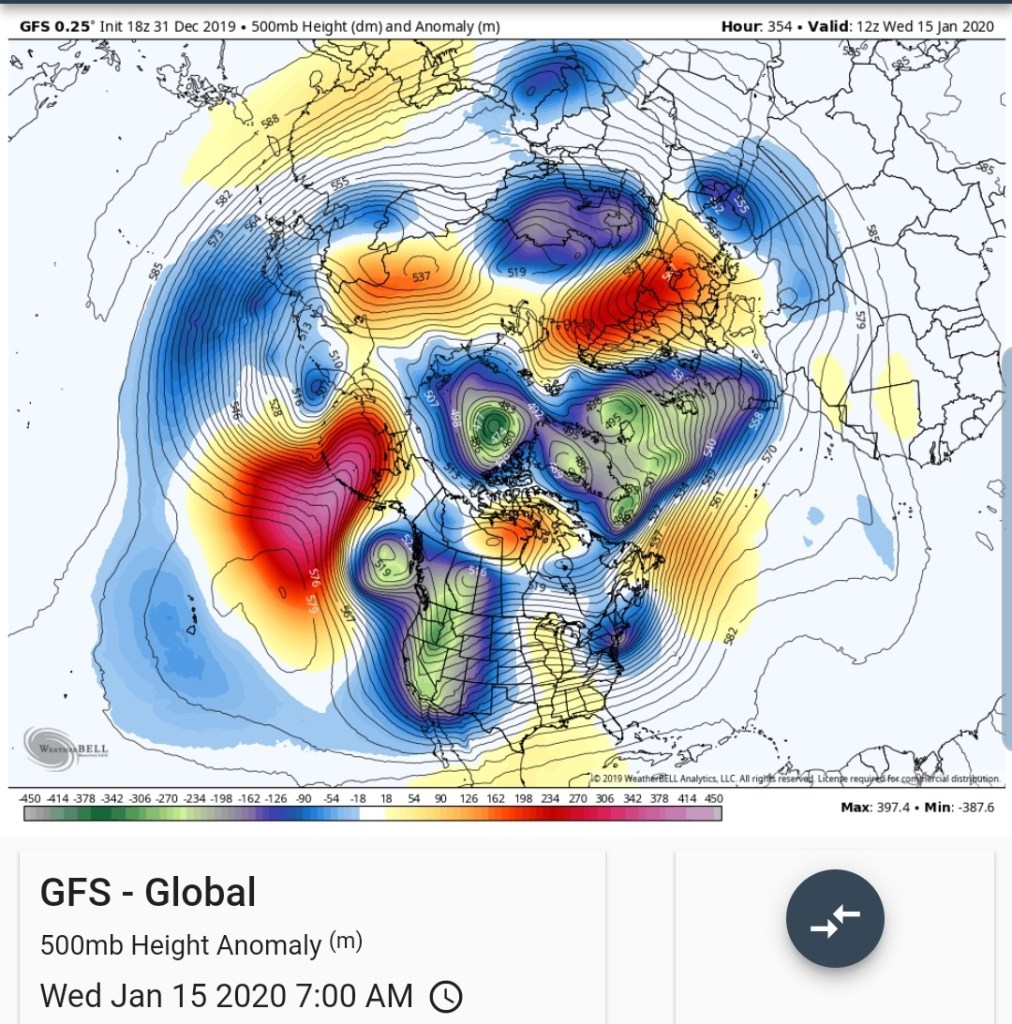
Now on the long range. The GFS operational has been consistent with a progressive pattern allowing cold to overwhelm the pattern mid mont . Its entirely on it’s own in this scenario. A few CFSV2 runs have done this but backed off. The 18Z GFS on January 15th
the entire look at the run
It’s own teleconnections look like
All anti eastern cold.
The GEFS for the time period the GFS op shows the cold pushing
That also looks like
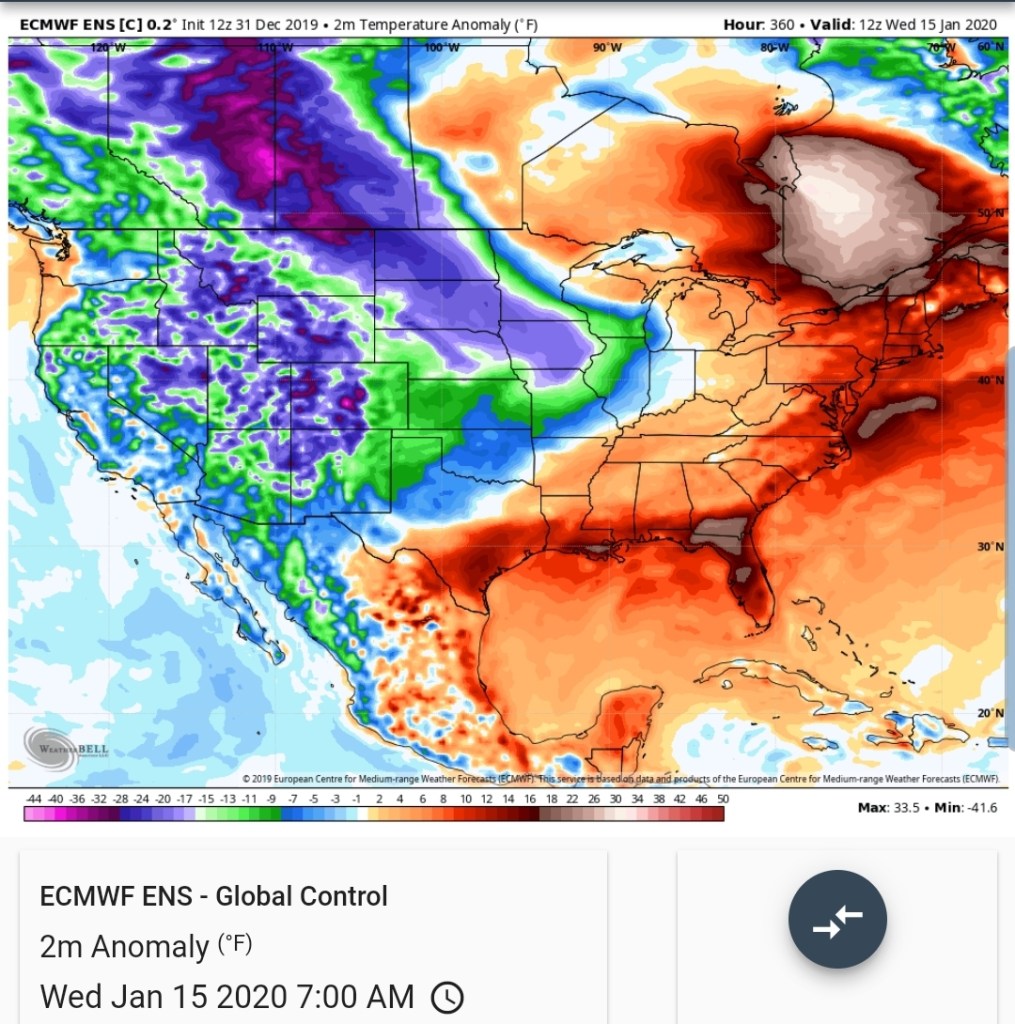
The ECMWF ensemble mean
ECMWF control
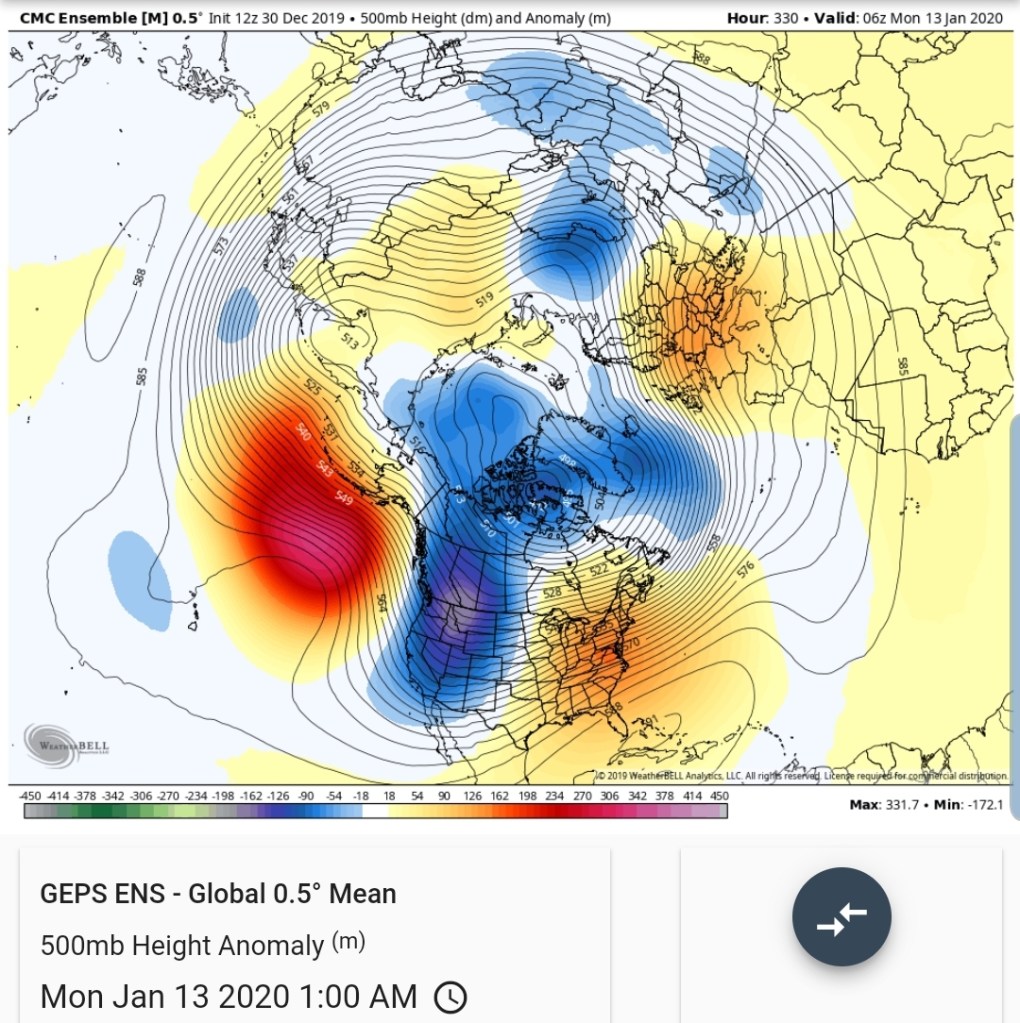
Canadian
This pattern is all supported by
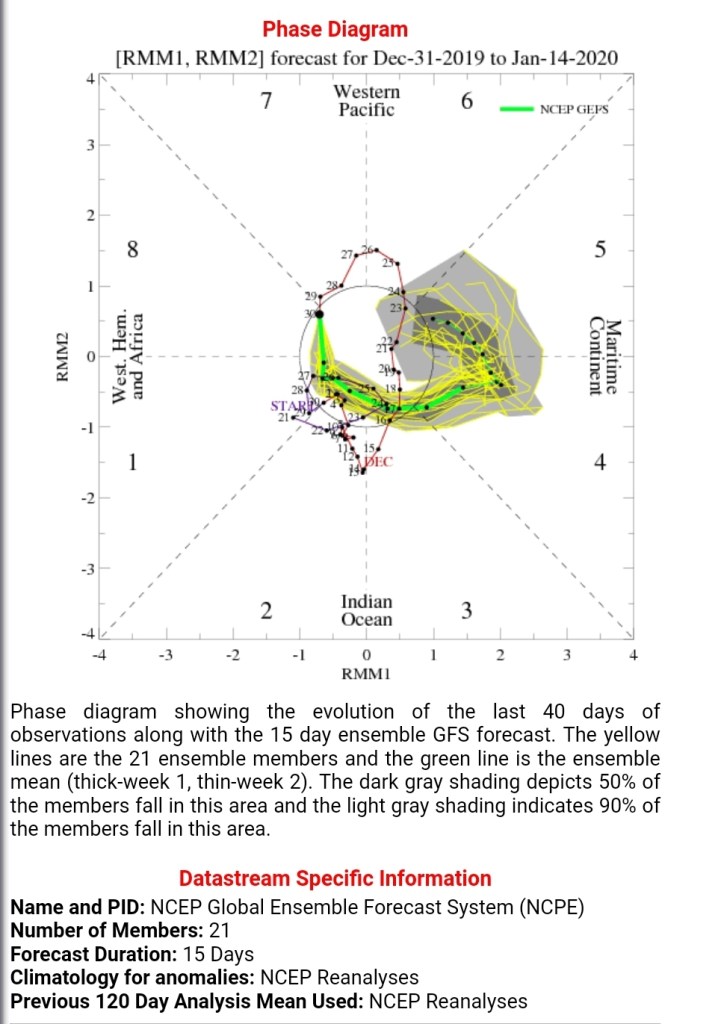
The 500mb look
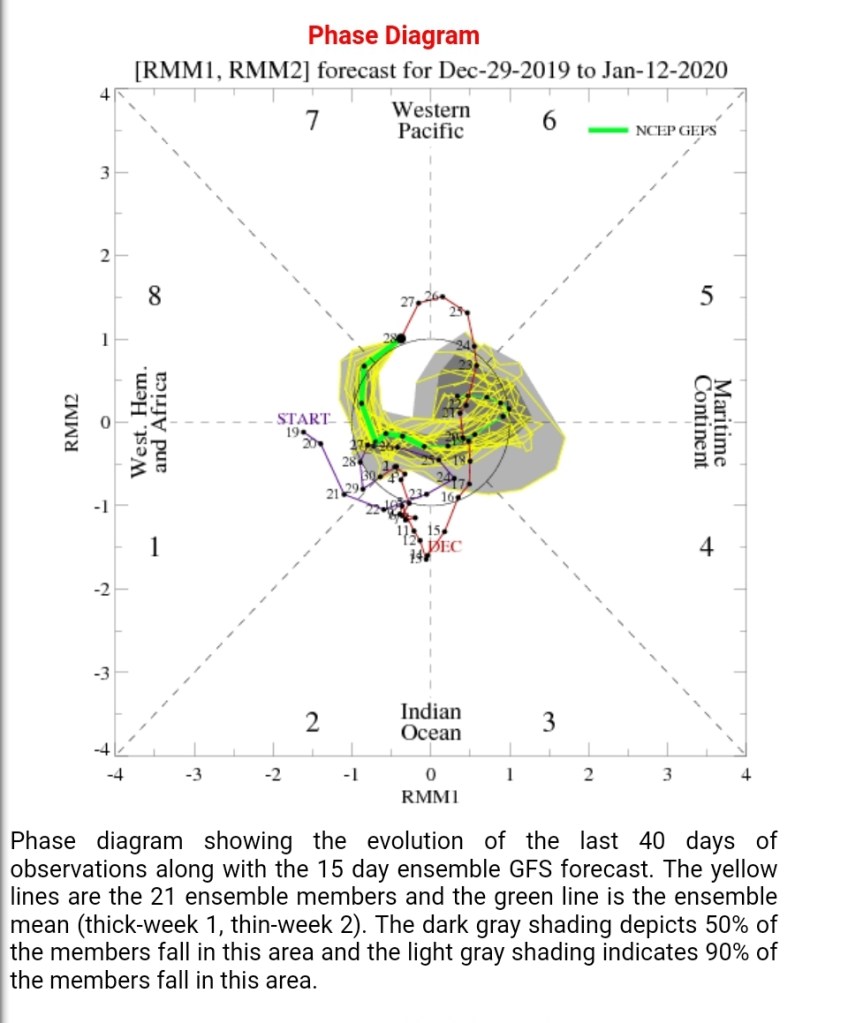
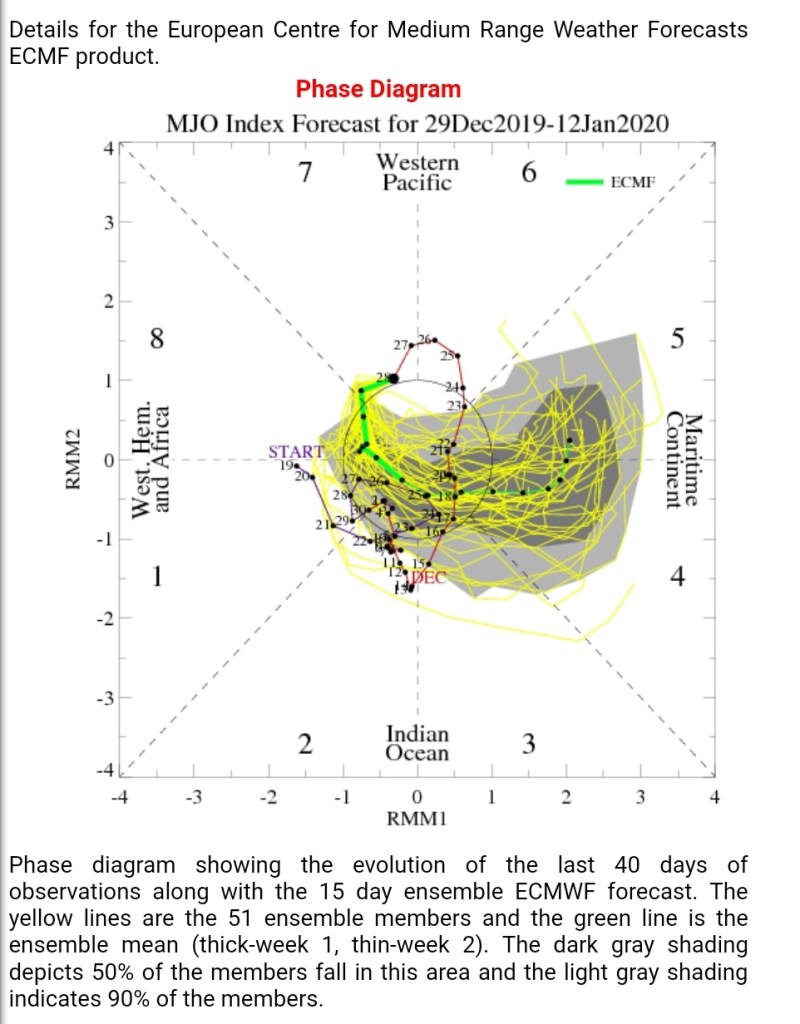
MJO
GFS and ECMWF
The operational has been consistent in ideas already with a progressive pattern where the cold fights and pushes, unlikely thats the case. It does at least look pretty for hope….and anything is possible…
Prior to this period, the snow threats. One this weekend after the rain and mild weather Friday into Saturday, and one mid week next week. Both of these have potential to be the best snow makers of the season so far.
Surface features and 500mb height anomalies and flow
Pics today-
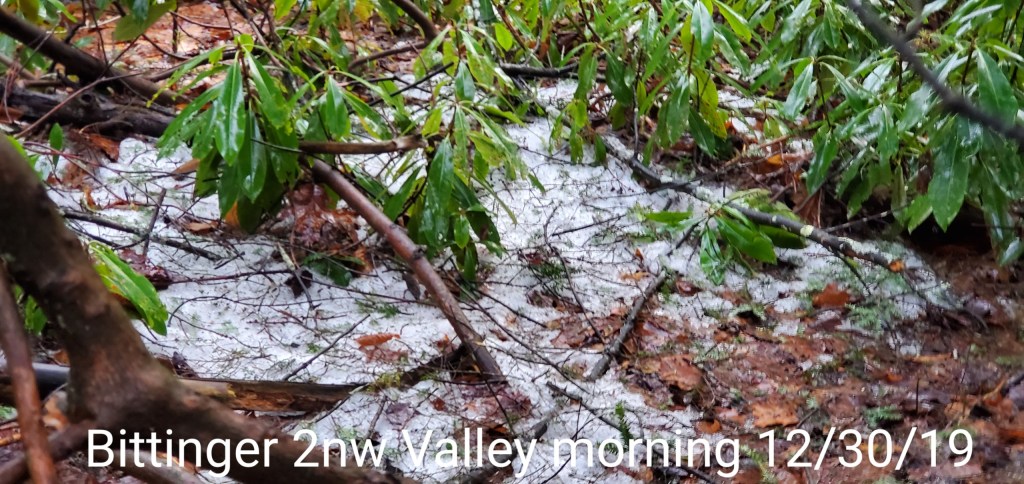
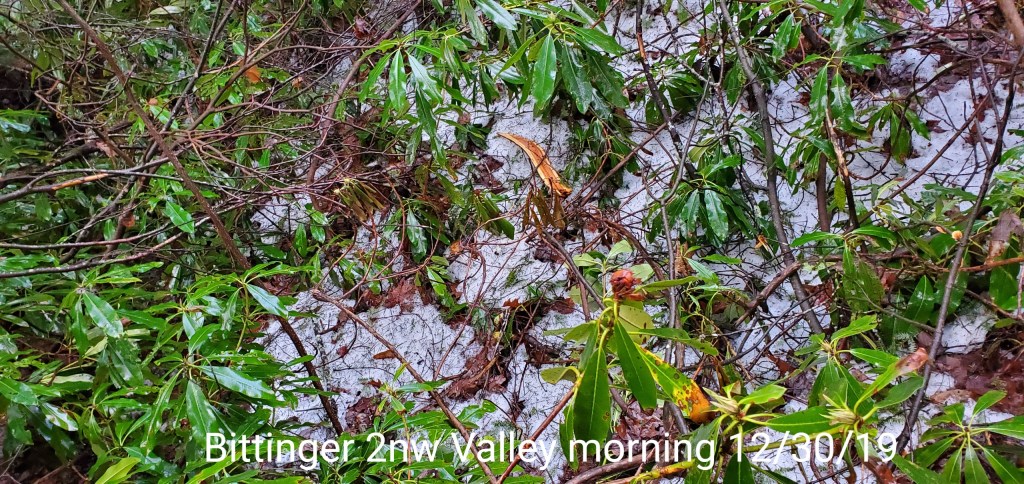
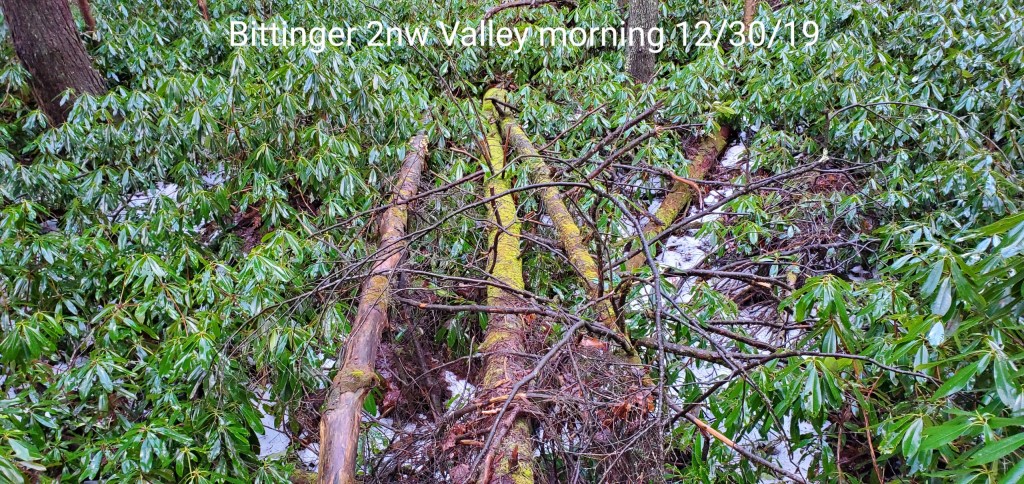
Few lingering pockets of snow in the sheltered protected low areas.
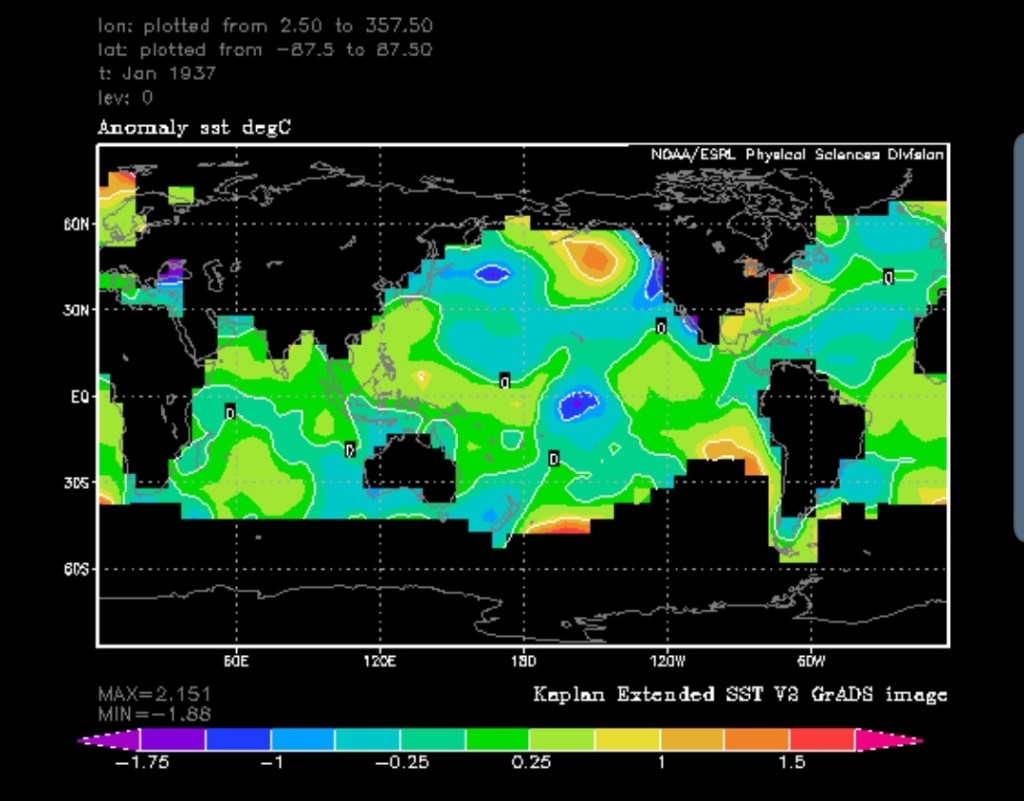
1937 had a brother to help show his milder side….
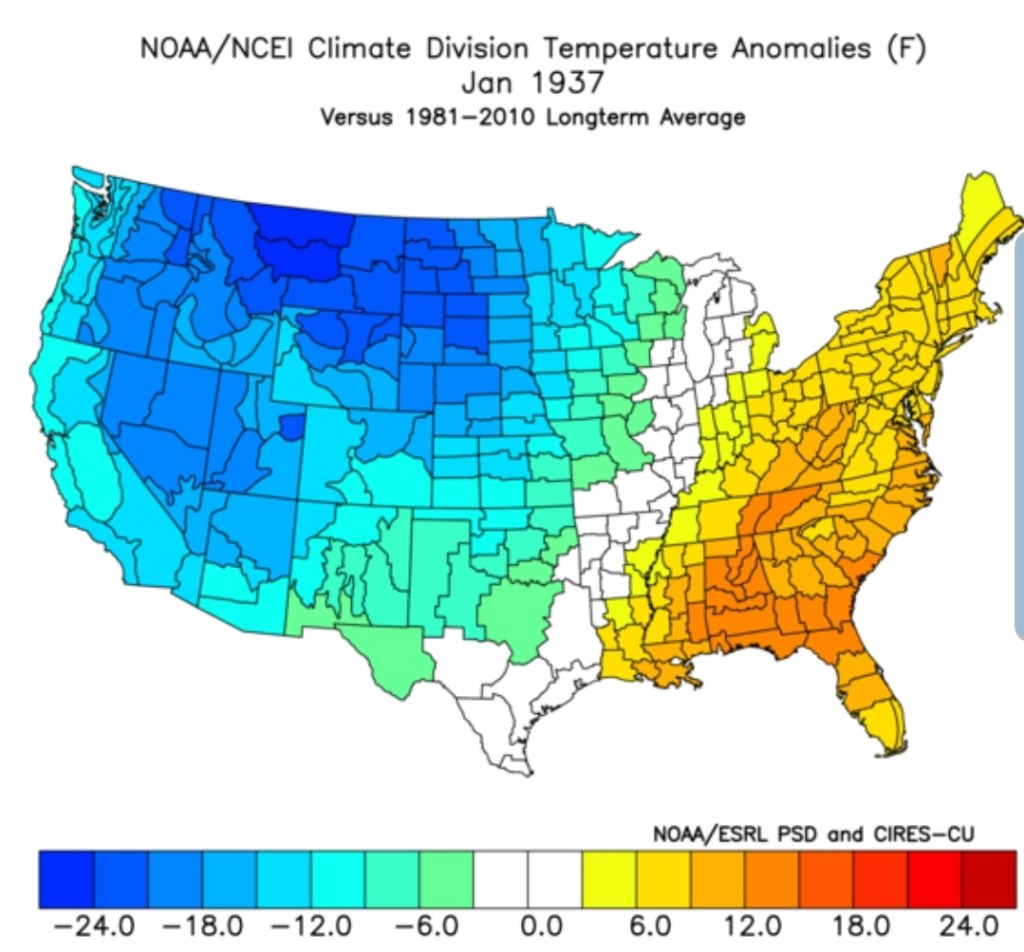
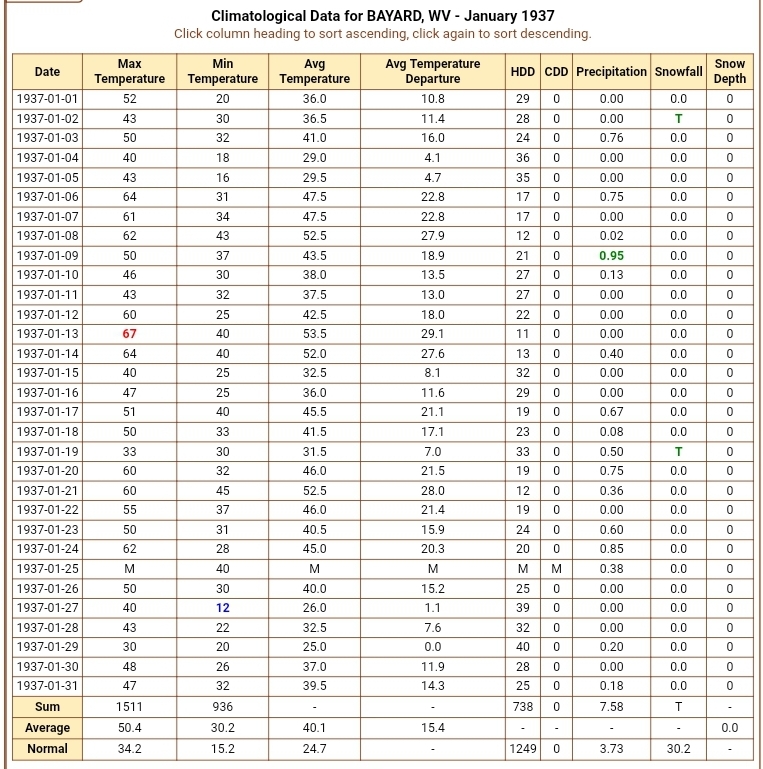
Jan 1937
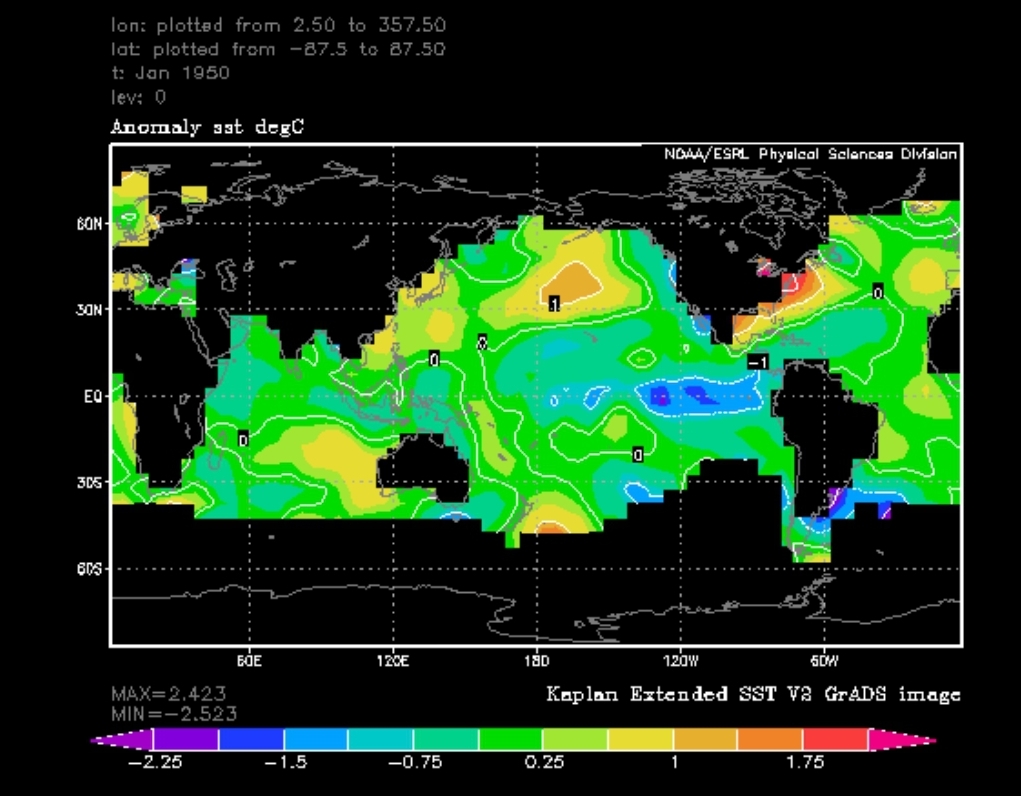
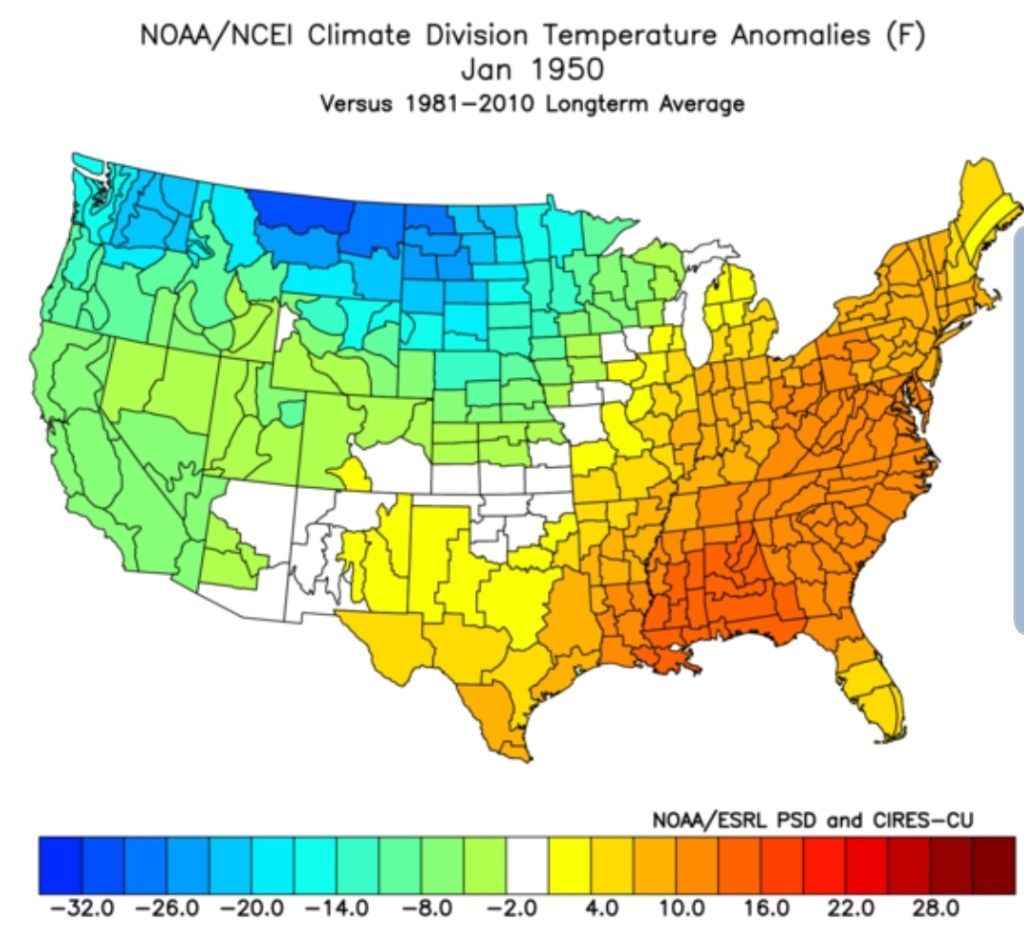
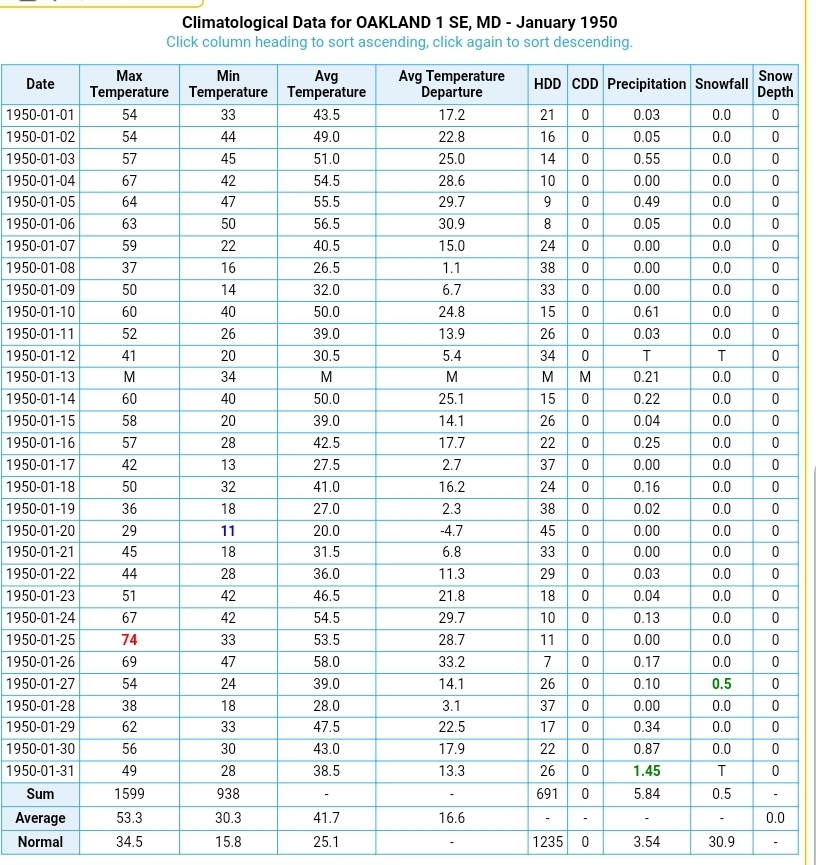
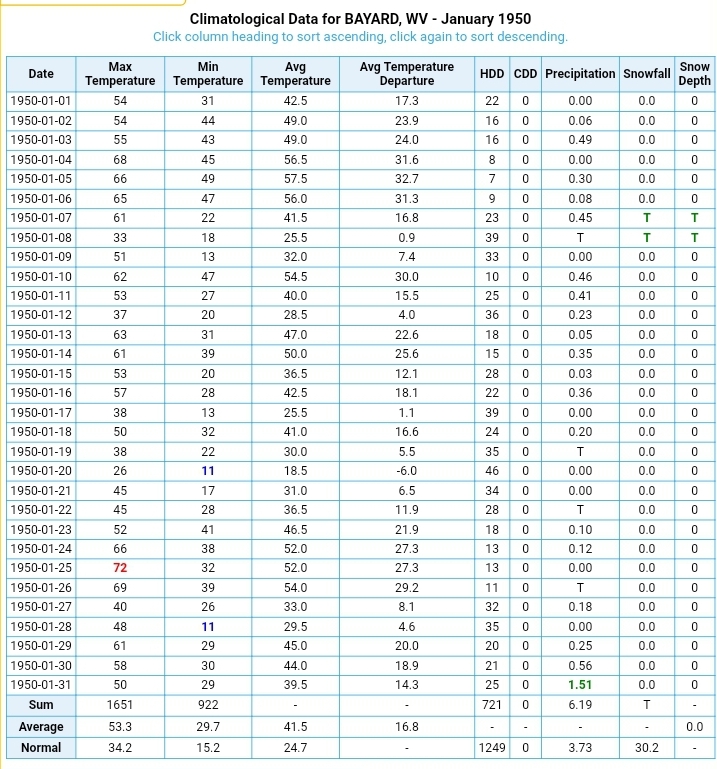
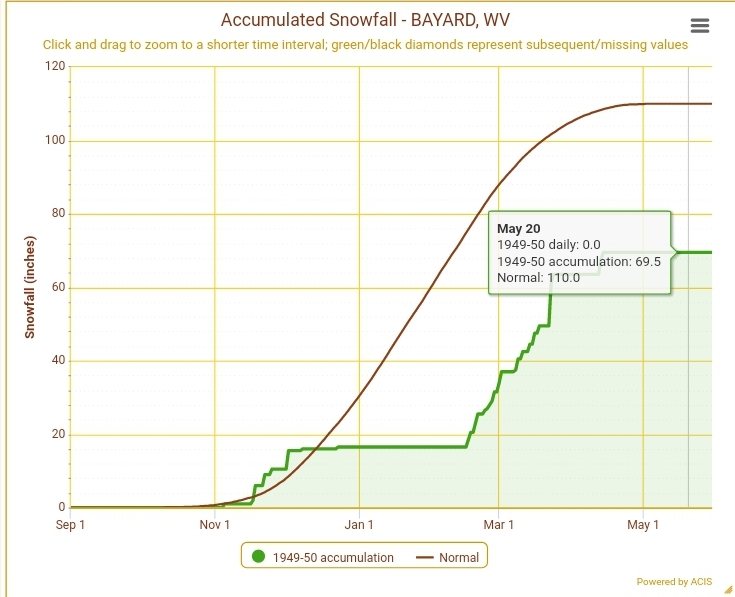
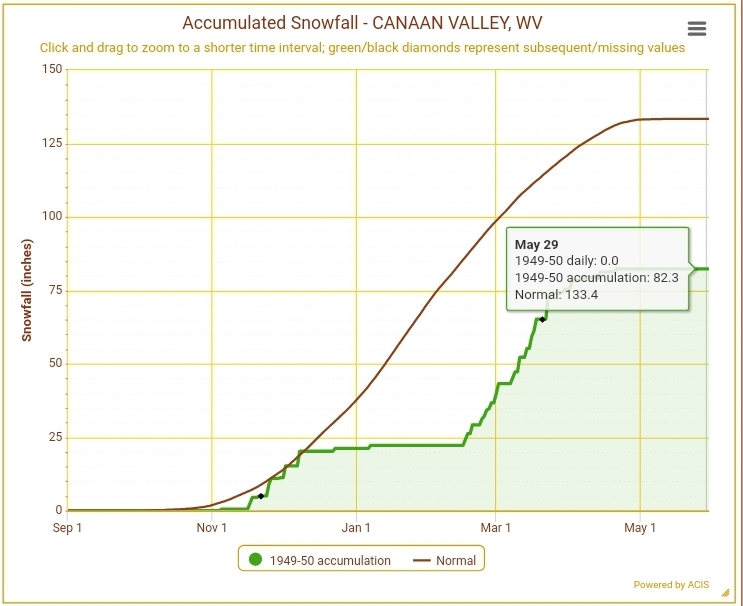
Jan 1950
That northern Pacific warm pool was a touch further off the coast, and supported a western trough more so than 37 or this January. Very warm anomalies up the eastern seaboard into the Gulf. 1950 had the very warm anomalies off the west coast of Australia. Supportive of convection there for unfavorable MJO phases for winter here.
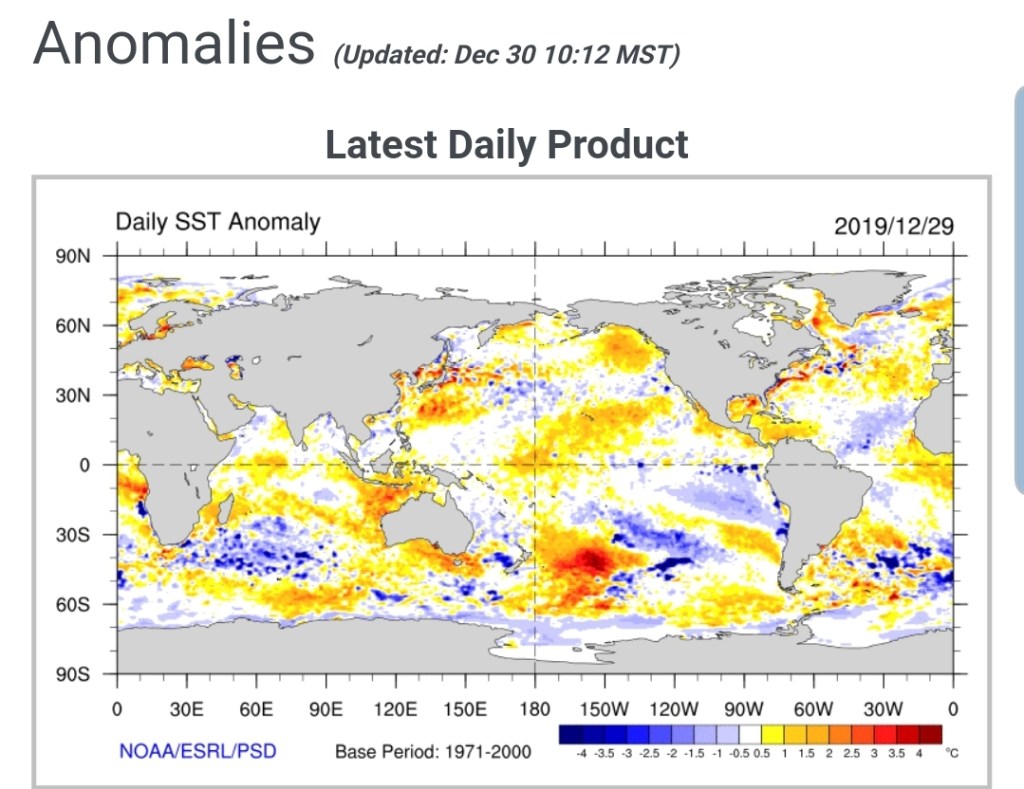
Present day, the northeast Pacific warm pool is further east, but with a tongue of cooler water aimed towards California. Warmth in the Gulf up the eastern seaboard.
That 1937 setup gave a look like this
January 1950
Current modeling by late week 2 January
November 1936
November 1949
November 2019
December 1936
December 1949
This year
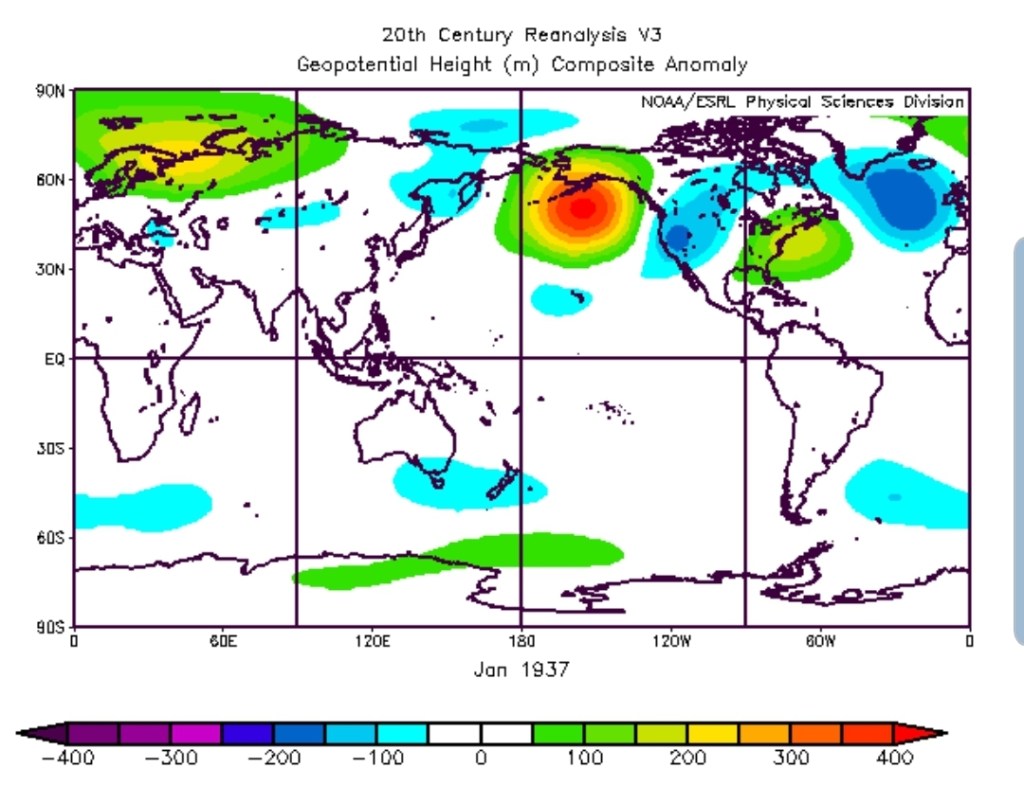
January 1937
January 1950
January 1950 at the sites
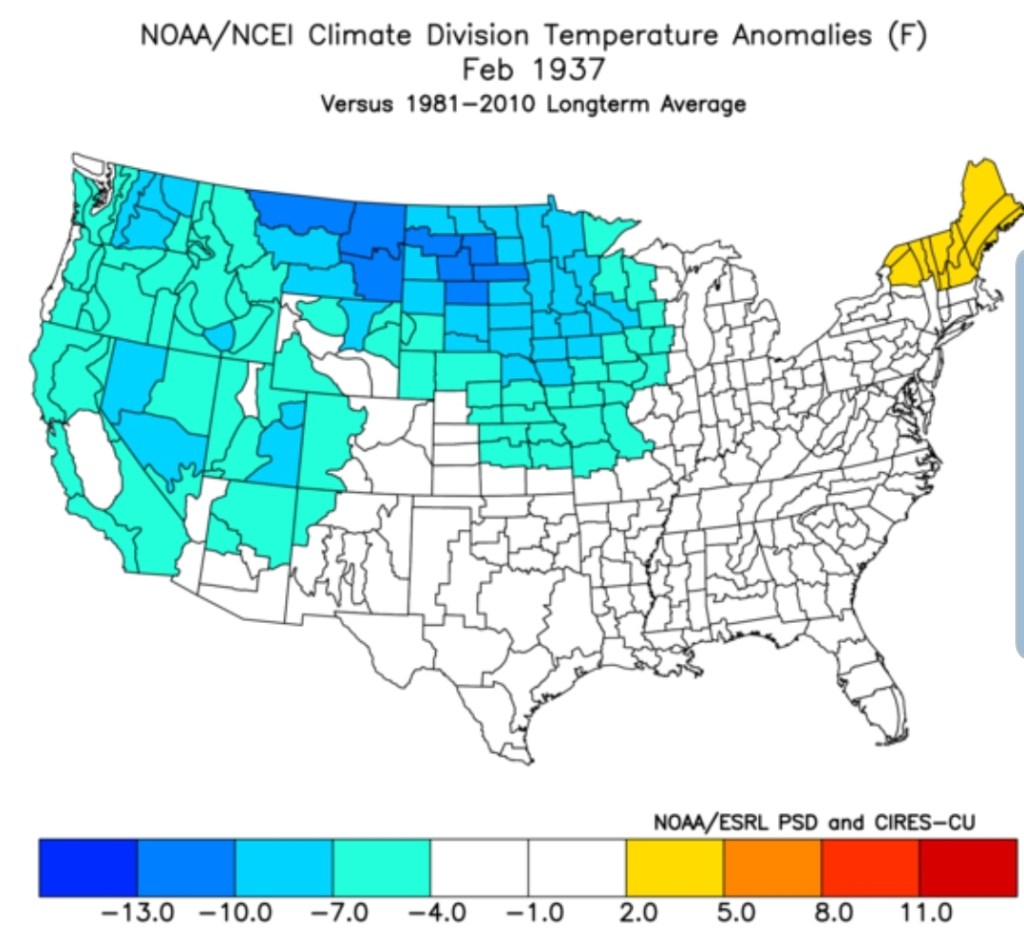
February 1937
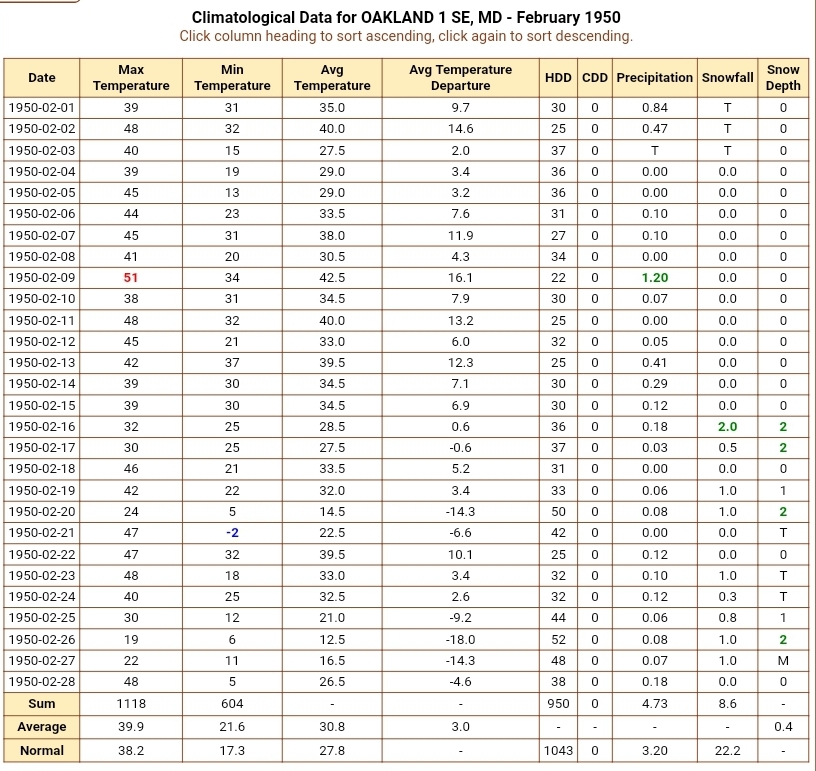
February 1950
Feb 1950 at the sites
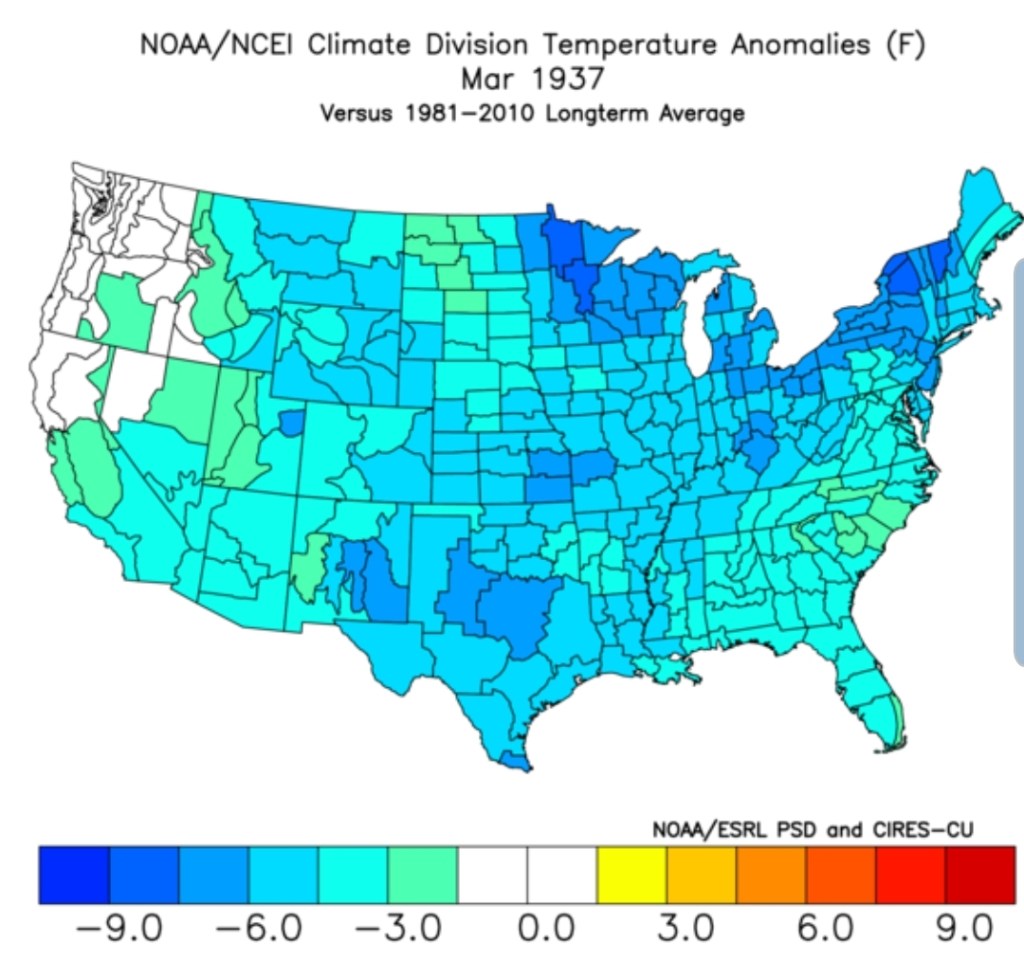
March 1937
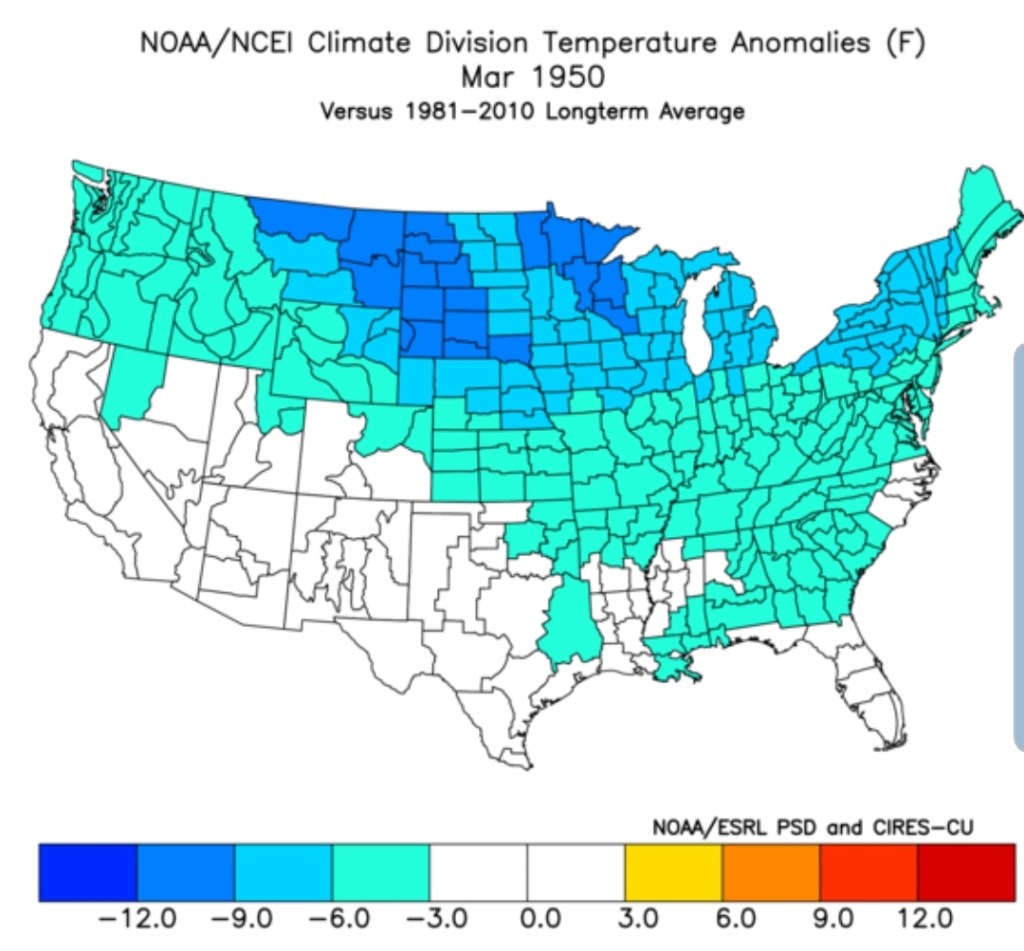
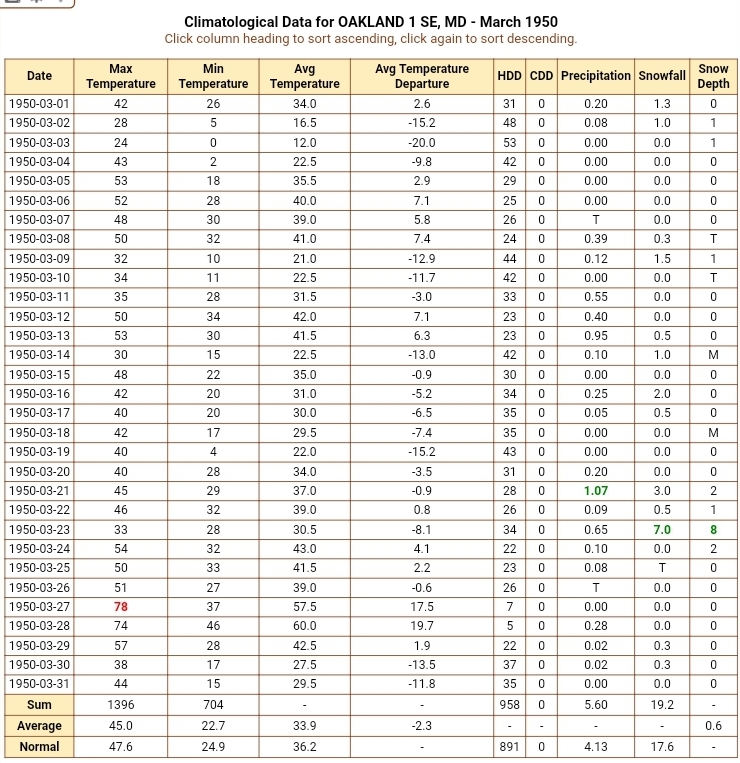
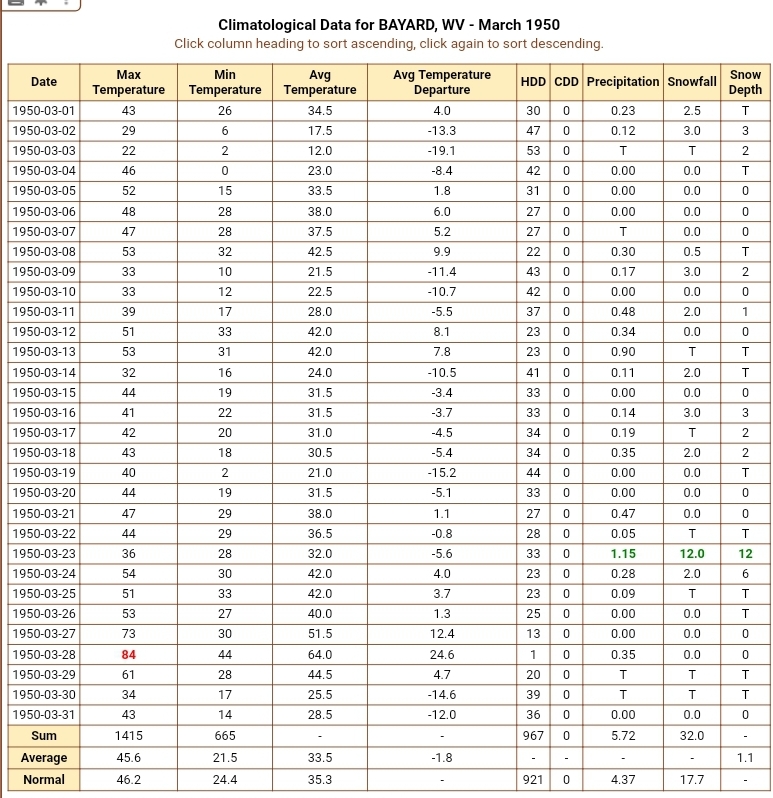
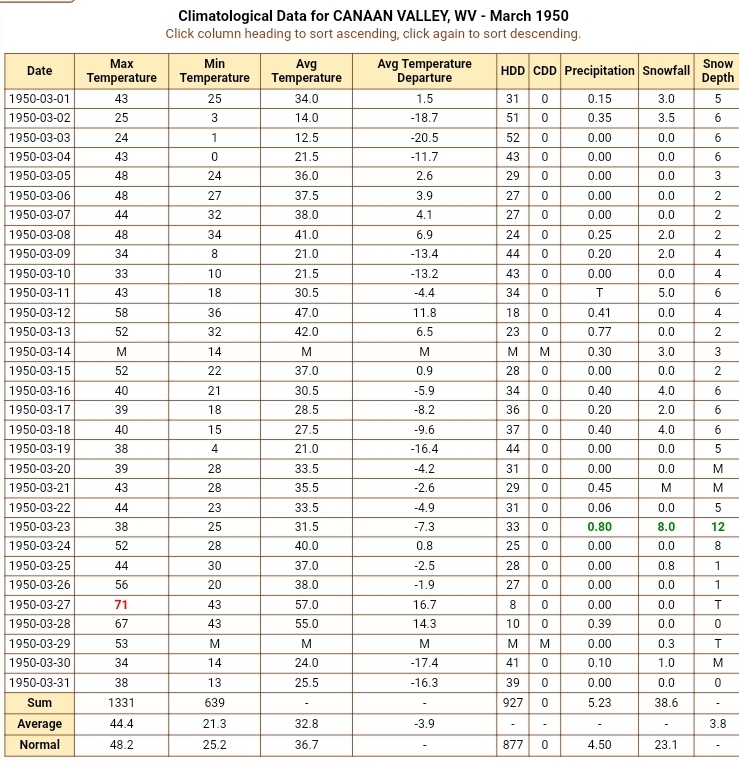
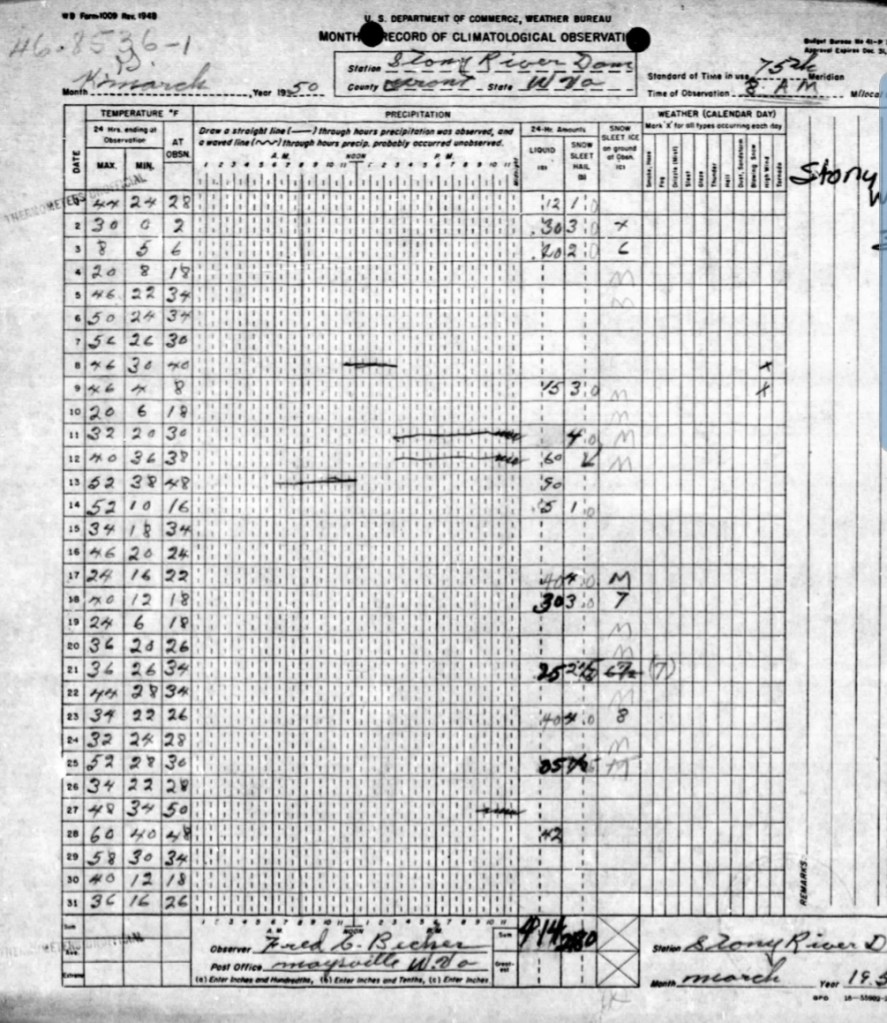
March 1950
At the sites in March 1950
April 1937
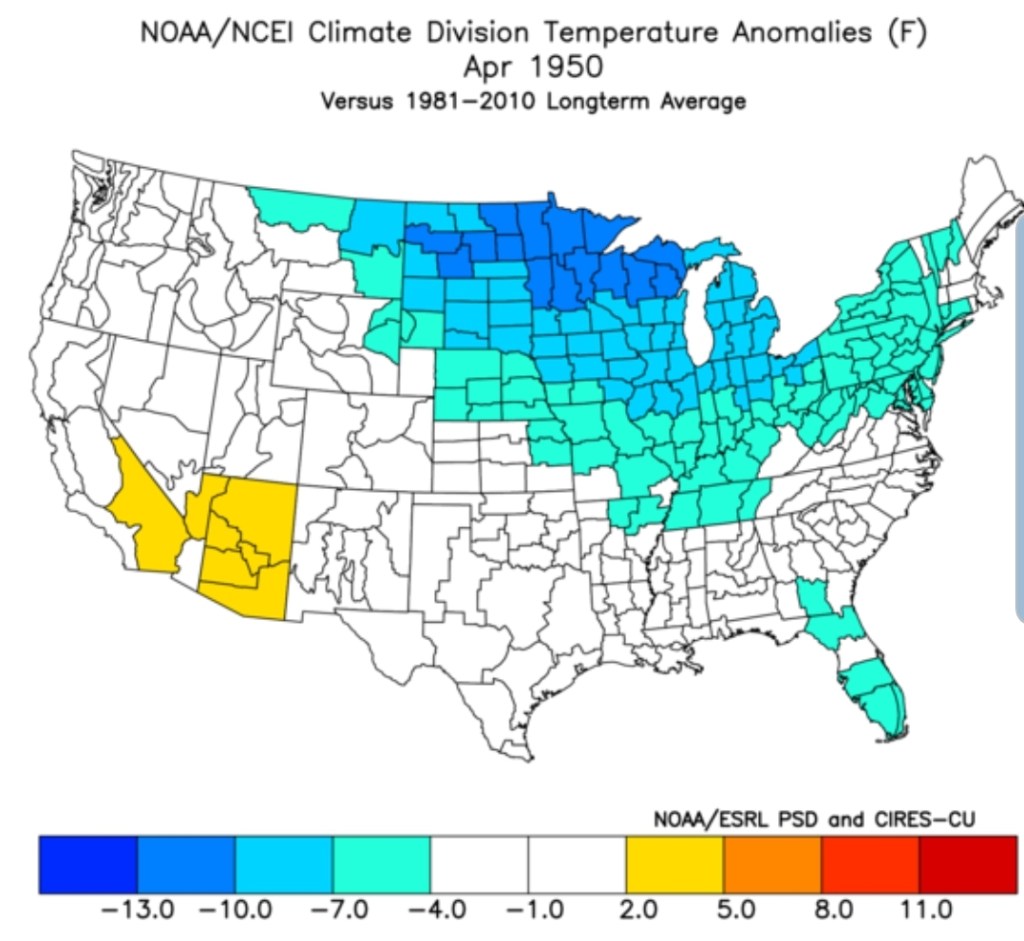
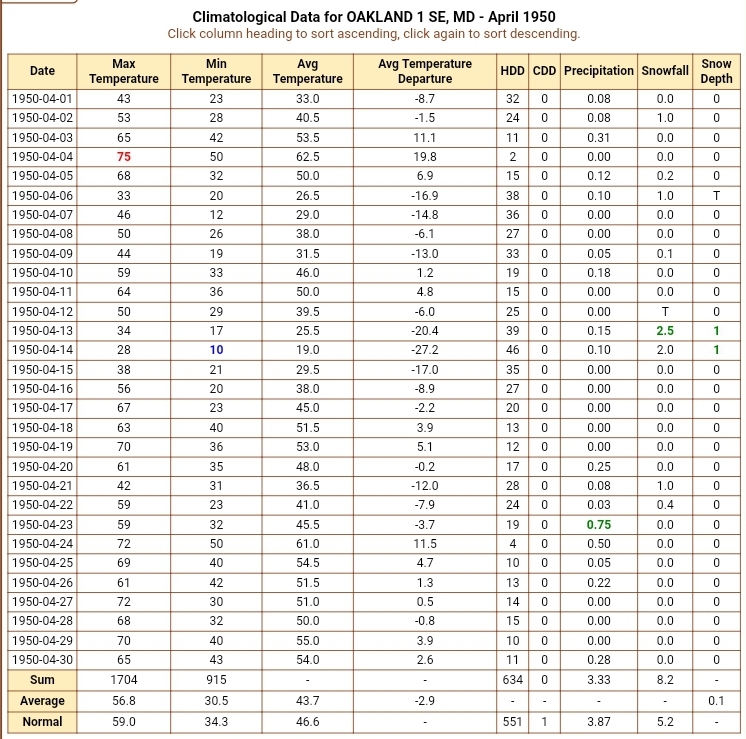
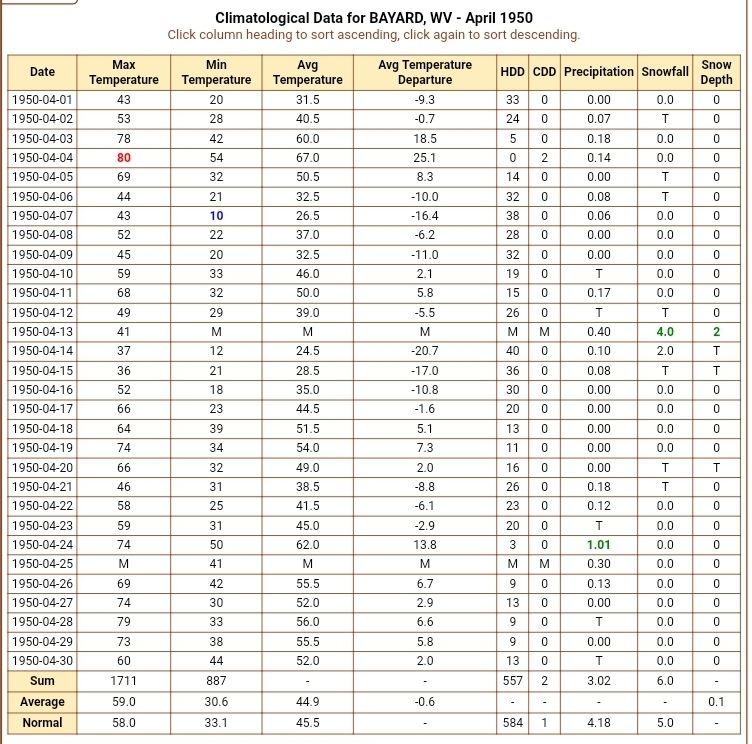
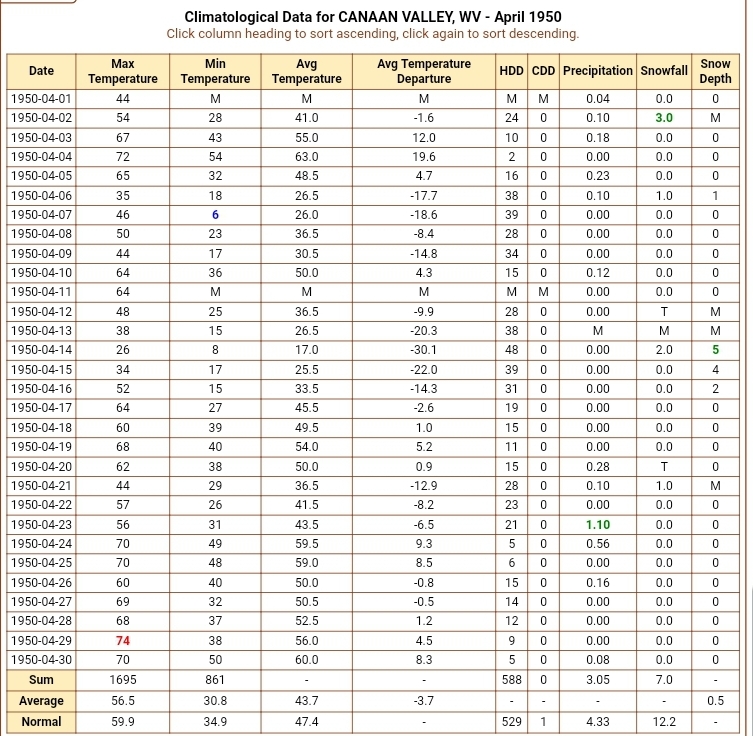
April 1950
April 1950 at the sites
Season amounts 1949/50
Tomorrow their cousin 1956 will be introduced..hopefully the adoption papers are found quickly and will show these examples aren’t any true relation to what this January holds.
These are just examples of like setups. There are even worse setups that produced entire poor winters… 31-32, 48-49 are a few off the top of the head examples.
Surface features and 500mb height anomalies and flow
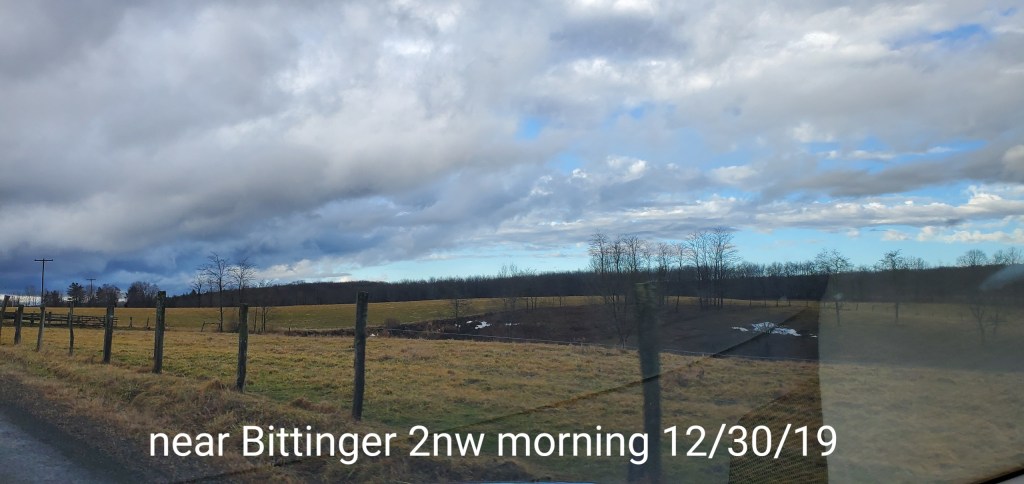
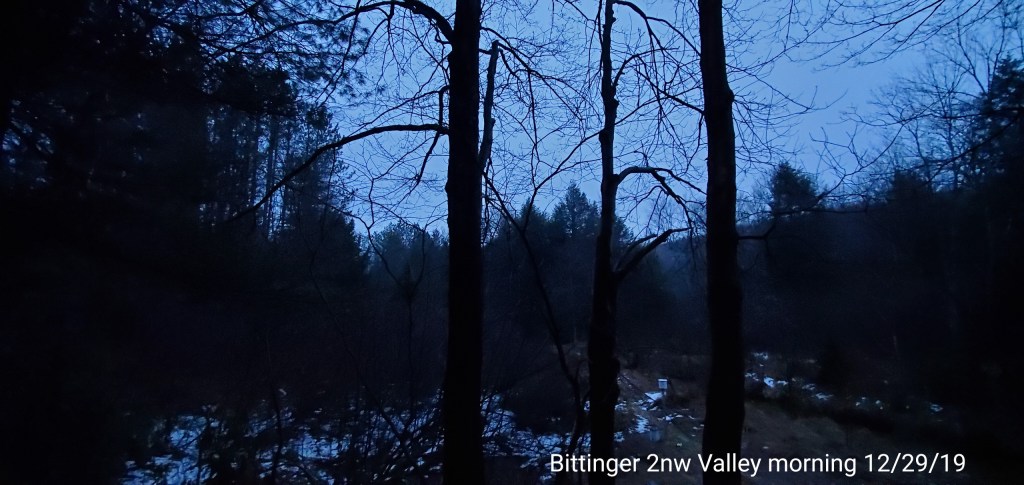
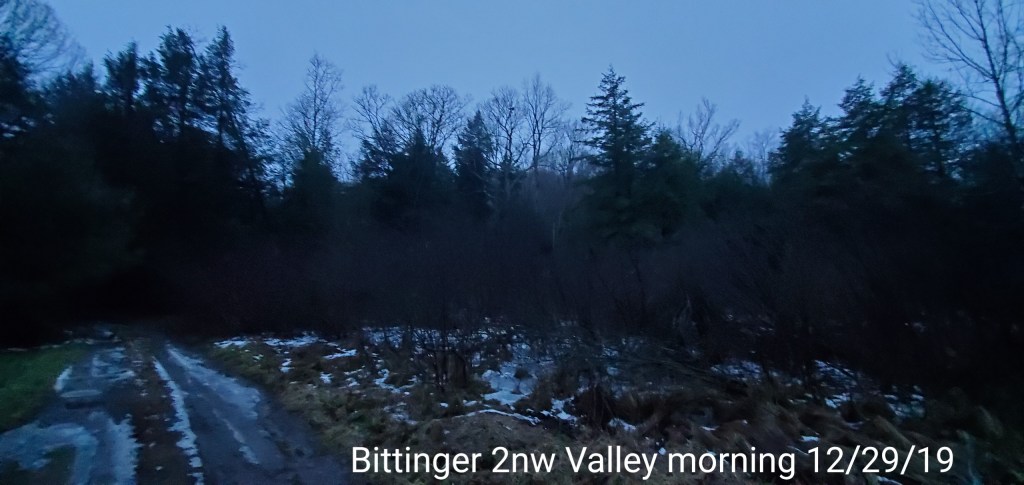
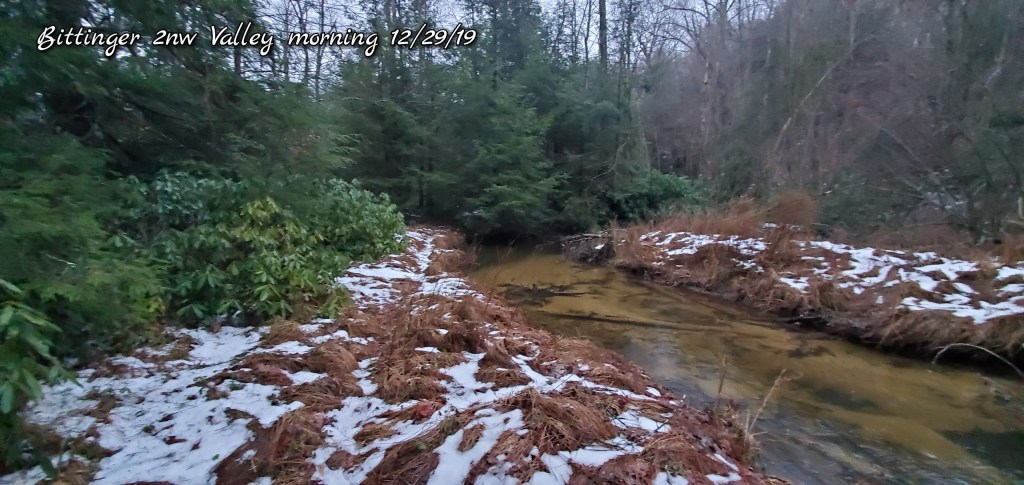
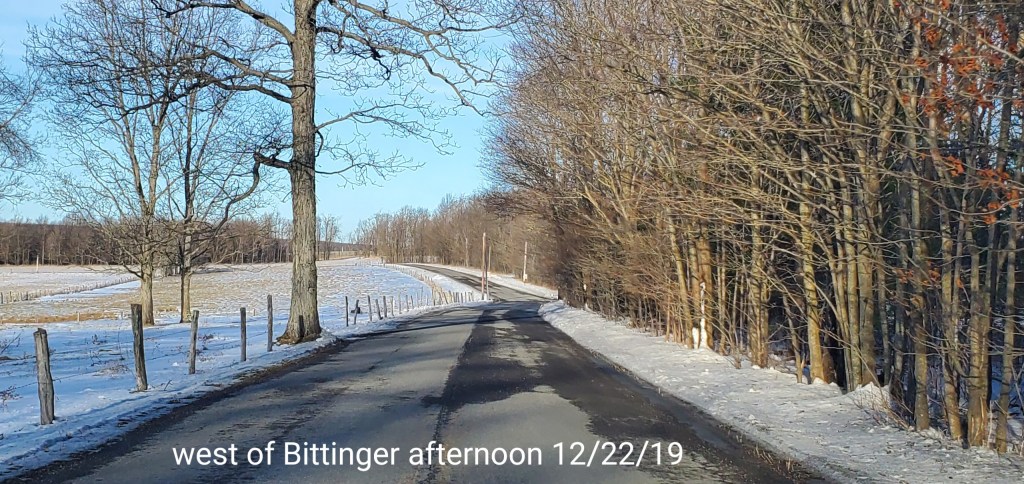
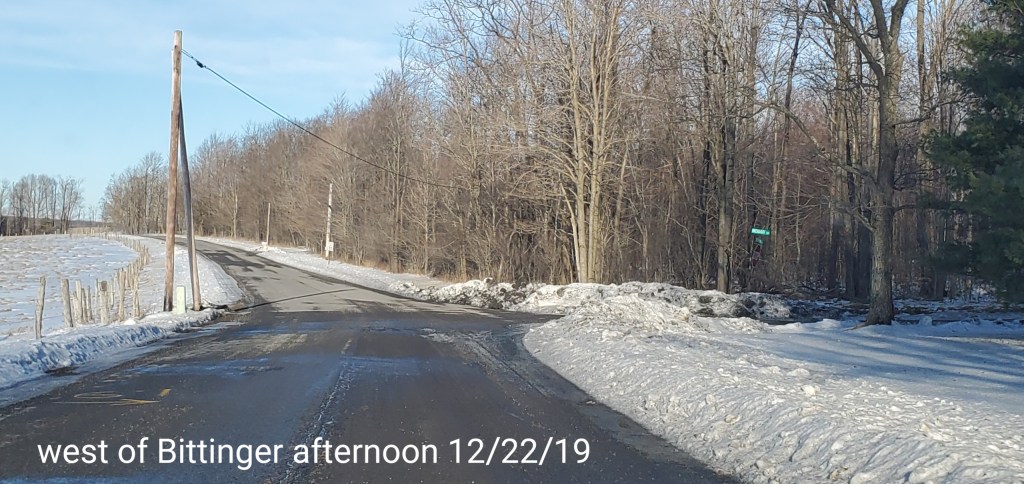
Pics today-
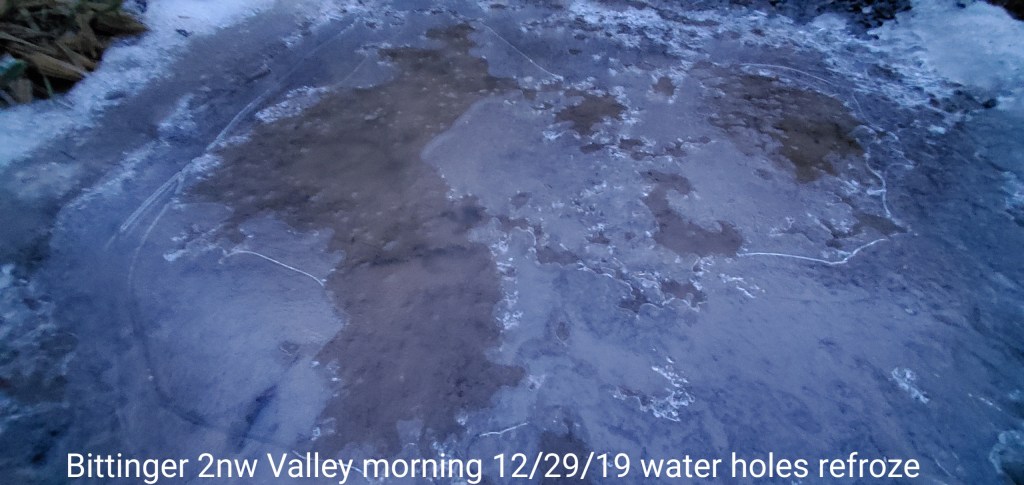
Bittinger 2nw
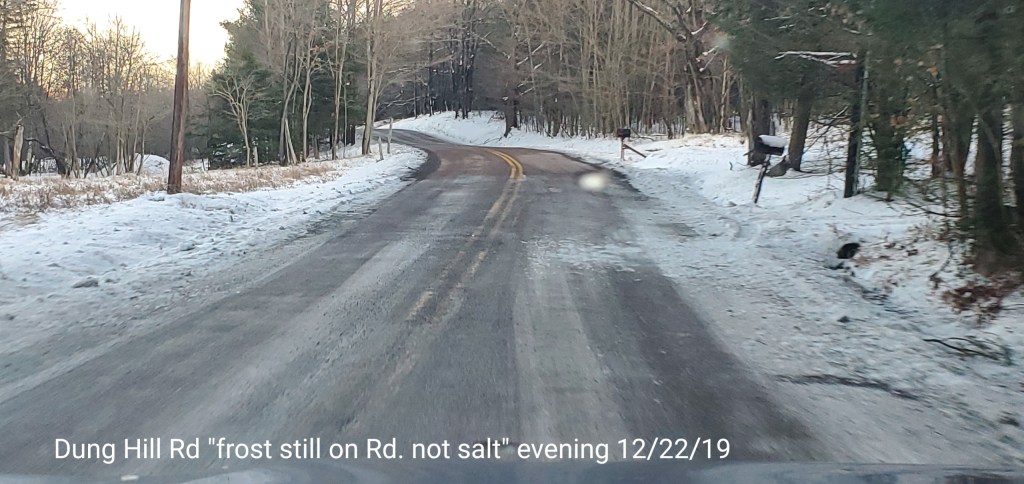
things even refroze overnight while many areas remained 40s
Making hay in a rainy pattern…
Post generated 10am
Making hay in a rainy pattern may be the equivalent to getting snow in a mild pattern. There is usually a break for it to occur. There is the light snow event to close out 2019 this week, that goes to meet its maker late week with the return of the SW flow.
However, the best chance that I still like, is a period around the 6-9th give or take a day for the chance to “make hay” in this pattern for those longing for snow. Cold air should be able to make a push in this period.
After that time, there is a lot of high pressure and very cold air in western Canada, unfortunately it does not look like it will push east, but instead sink into the west as the trough again pulls back west and allows the Southeast Ridge to flex it muscles and strengthen and we go back to square 1. Modeling supports that. Trough rebuilds west of Hawaii- Trough pulls back into the western U.S
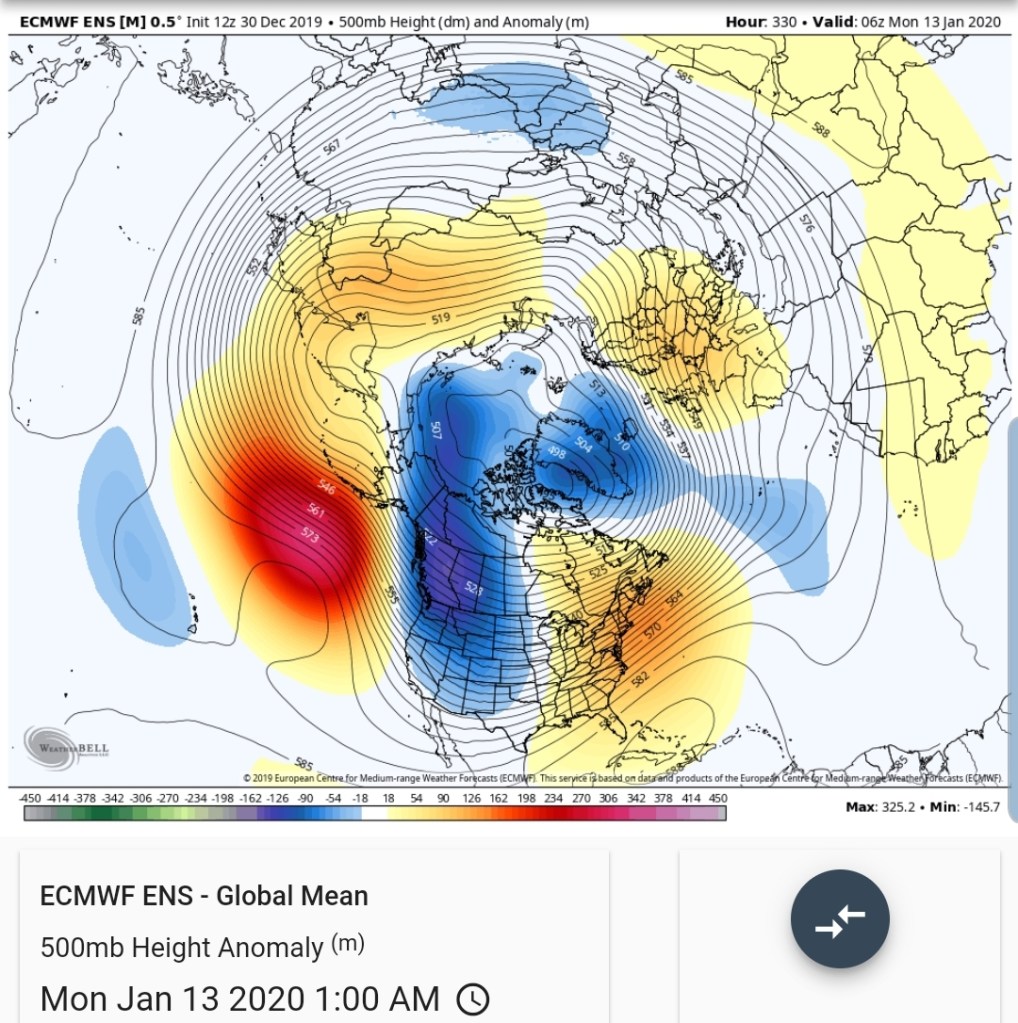
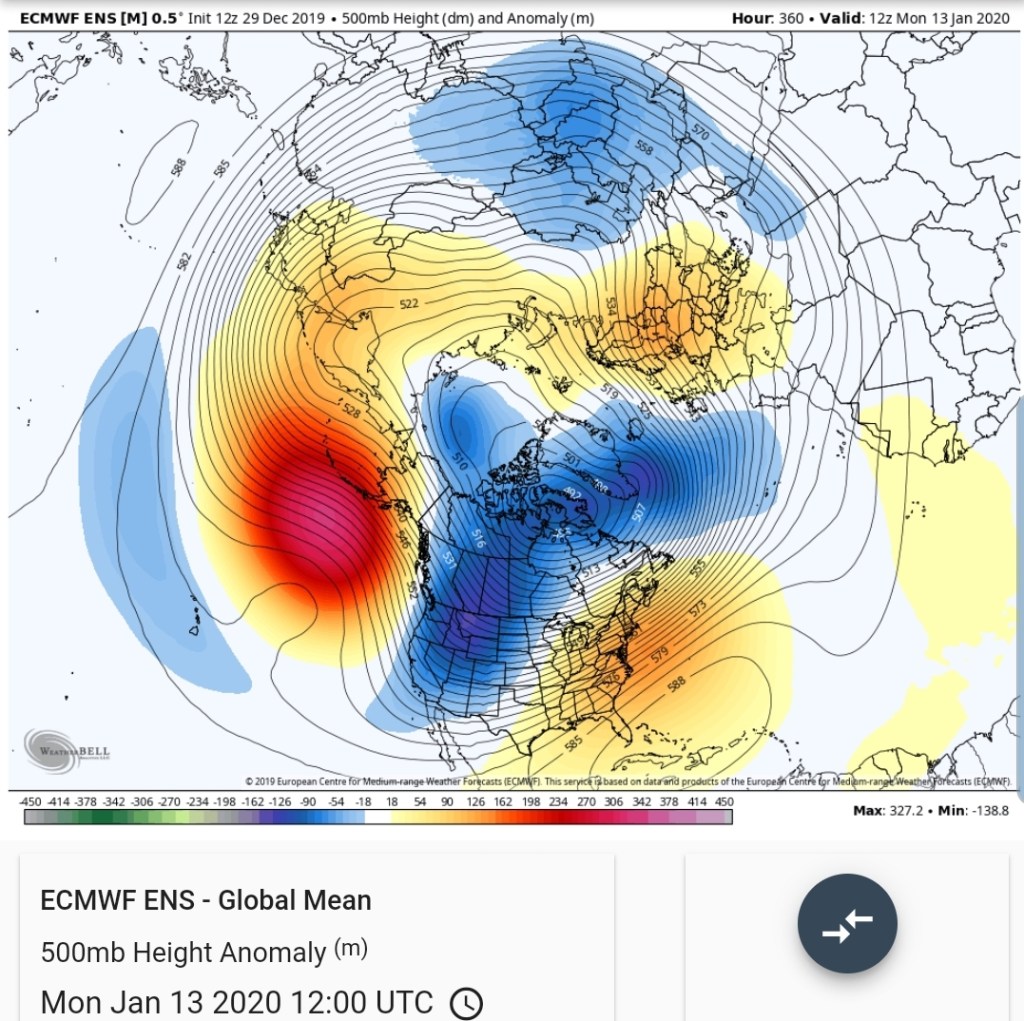
500mb Height anomalies off the 0z ECMWF ensemble
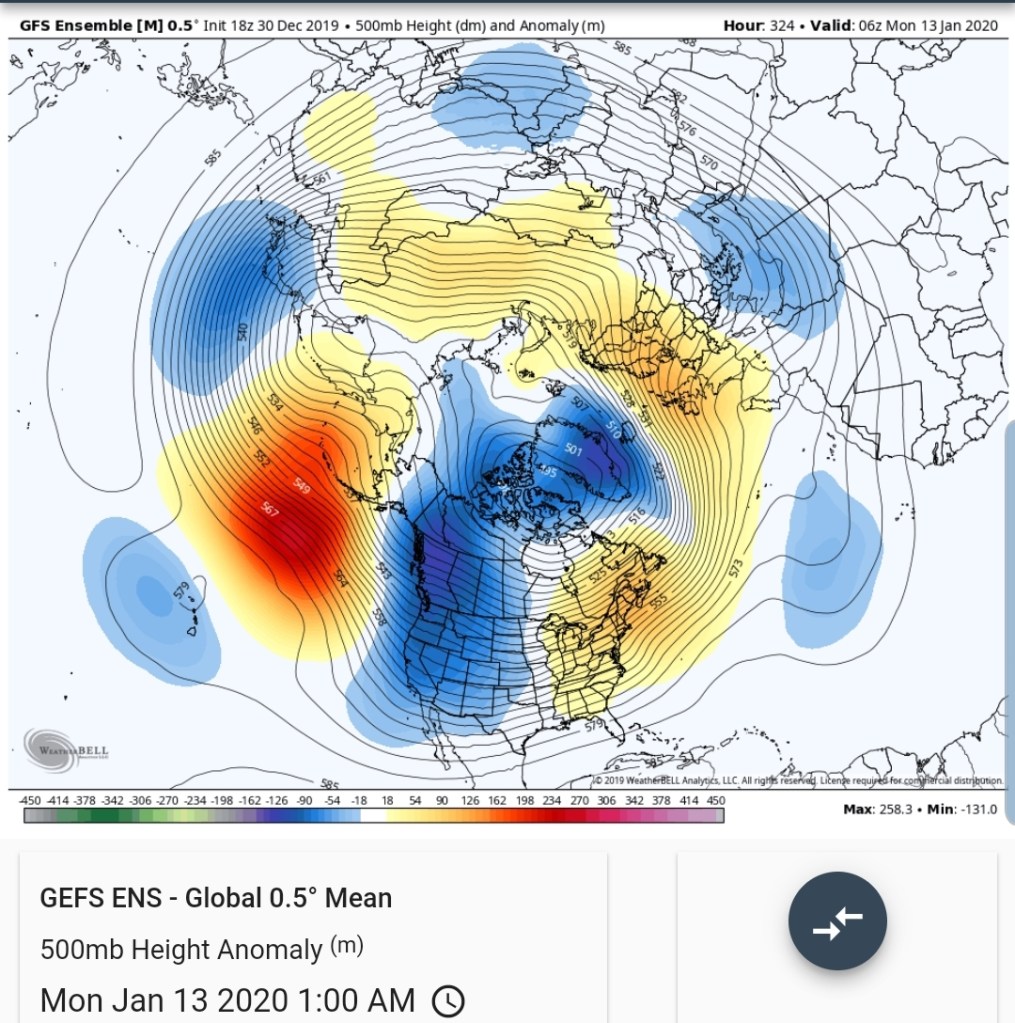
500mb height anomalies off the 6z GFS ensemble
500mb height anomalies off the 6z GFS operational
At the surface
MSLP/6HR/PRECIP off the 6z GFS
While most modeling is in agreement to watch the 6-9th period, in what could be the best snow of the season to date. In the model world that is a long ways out, but it is good to see agreement and some consistency. Hopefully we see adjustments after that period for the better, because currently it does not look good.
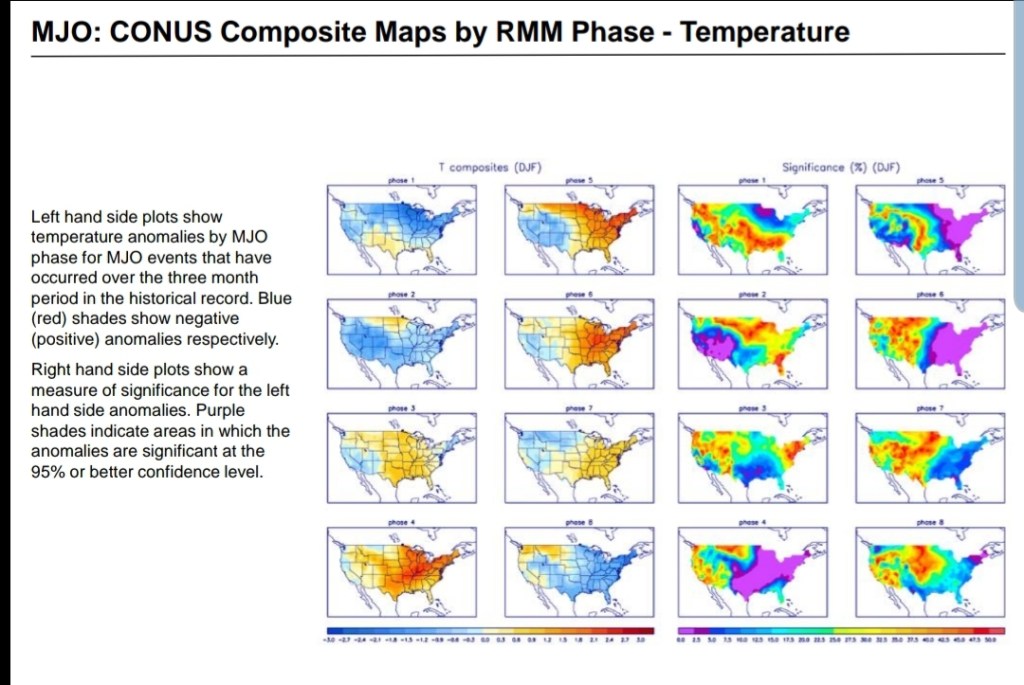
Along with the trough looking to sink in the west, southeast ridge strengthening backing support of the eastern ridge, this is also supported by the models MJO
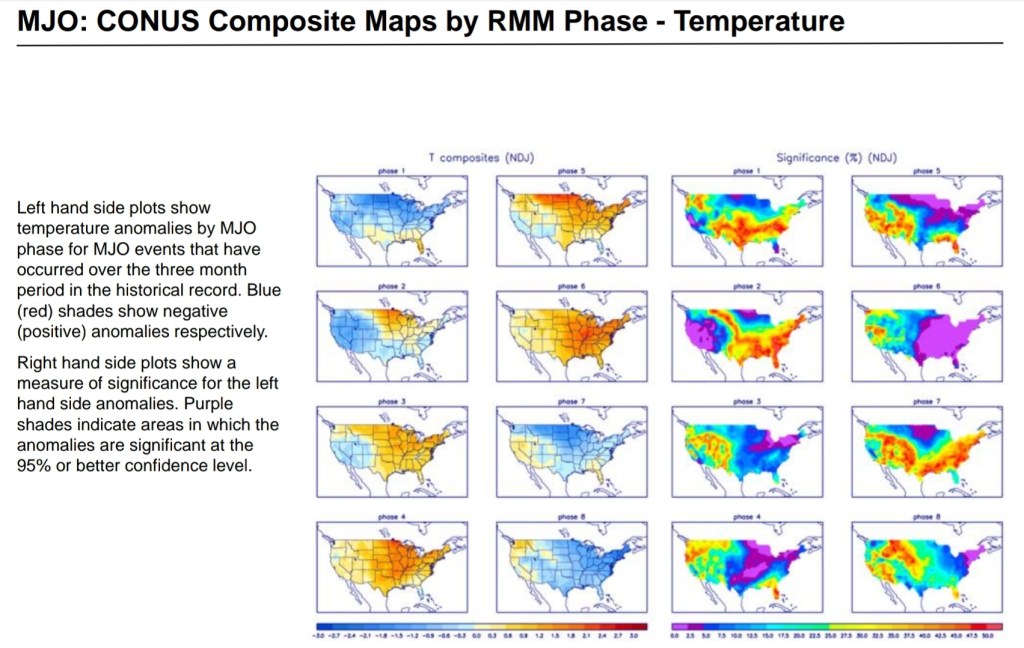
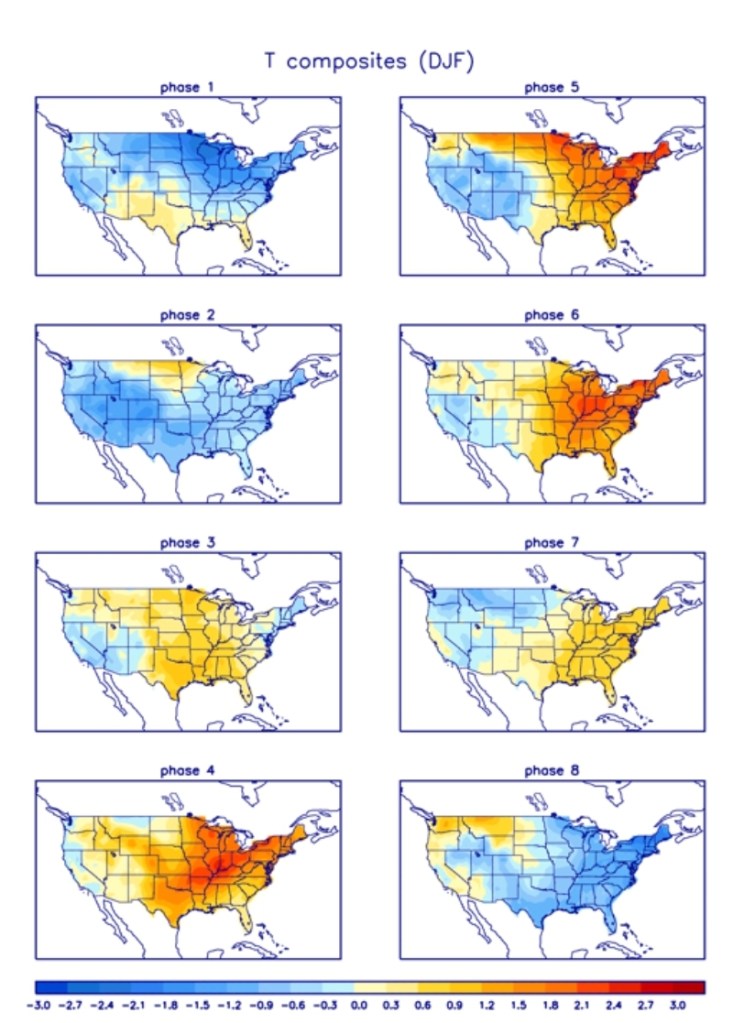
if we circle out into 4,5,6, that is just ugly. The correlation with those phases for the time of year are
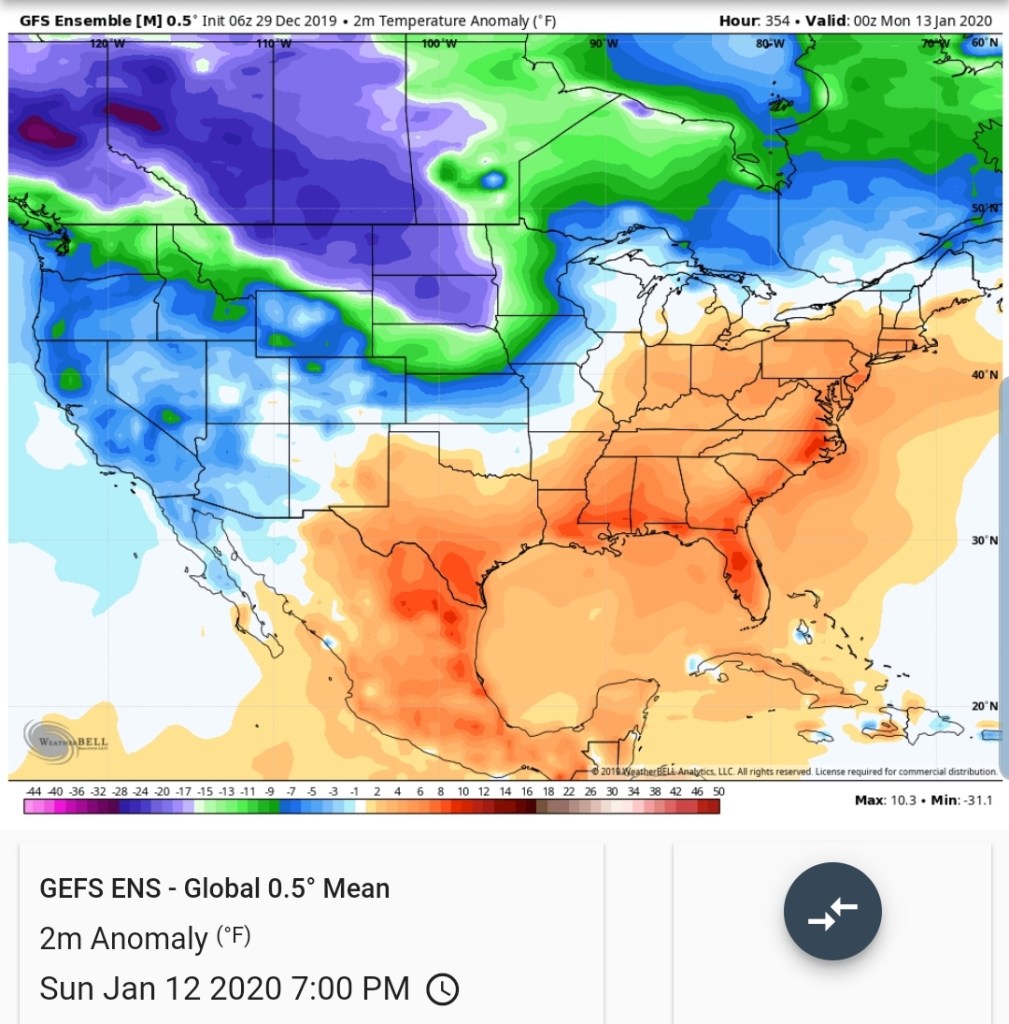
The Euro ensemble mean temps by the 12th look like
The GFS ensemble
Question is, when does it get kicked east?? Soon following that period in mid January or do we wait until later January or February? There is lots of cold back there to come of it can get east… With the Mjo looking ugly, trough west of Hawaii, trough western U.S, southeast ridge, this may not be in any hurry eastward. Things can change though. Never lose hope. While 1937 is one like example, and undeniably it does look a lot like it, and it may end up resembling it when all is said and done, but it is not etched in stone it that it will.
Evening addition to the 1937 theme
Day 15 ECMWF 500mb height anomalies
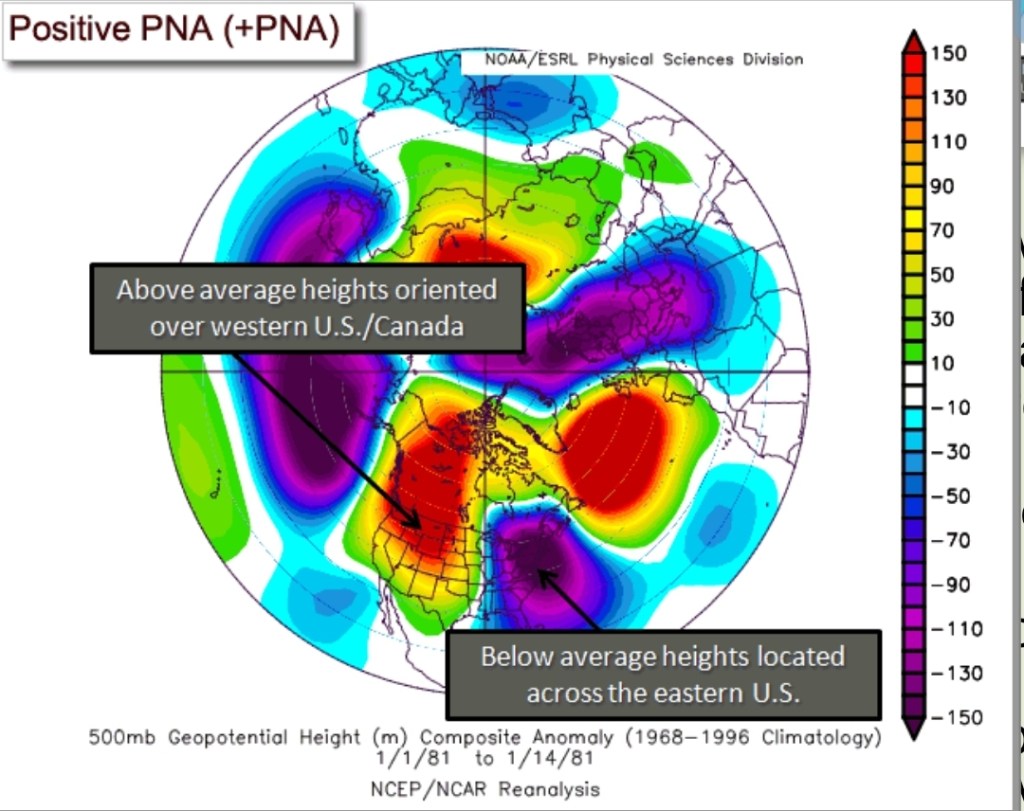
1937 Reanalysis 500mb Height anomalies. Strong positives off Alaska, trough west of Hawaii, trough western U.S, eastern ridging…
Back to the now:
Rainy today into tomorrow
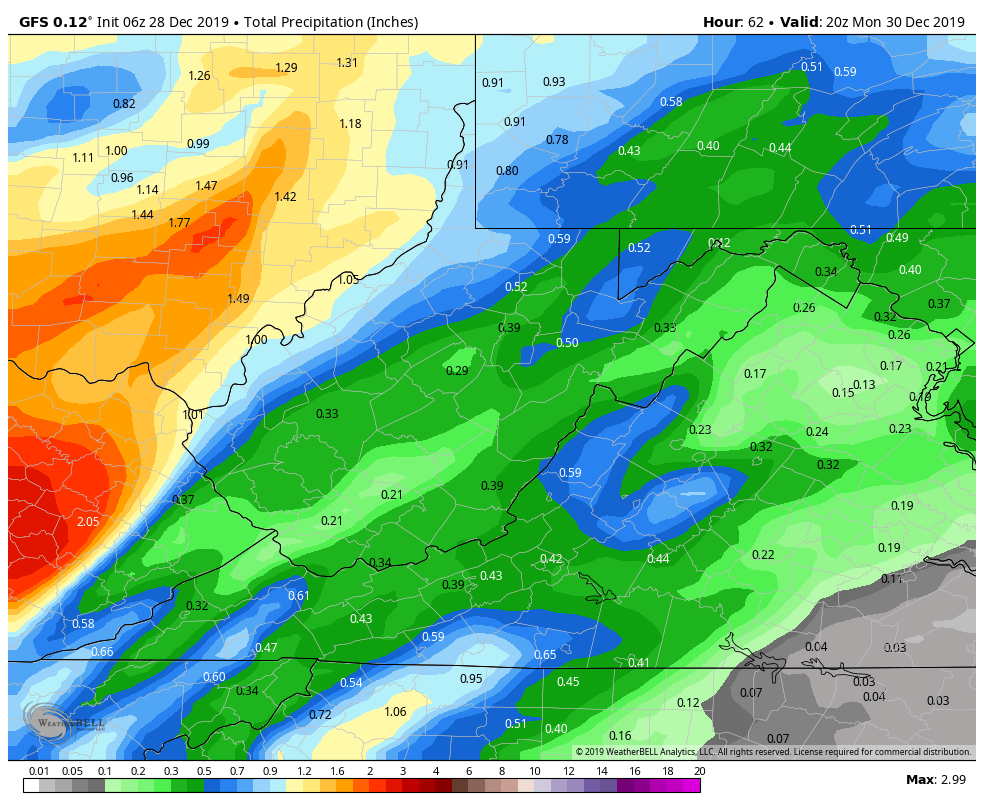
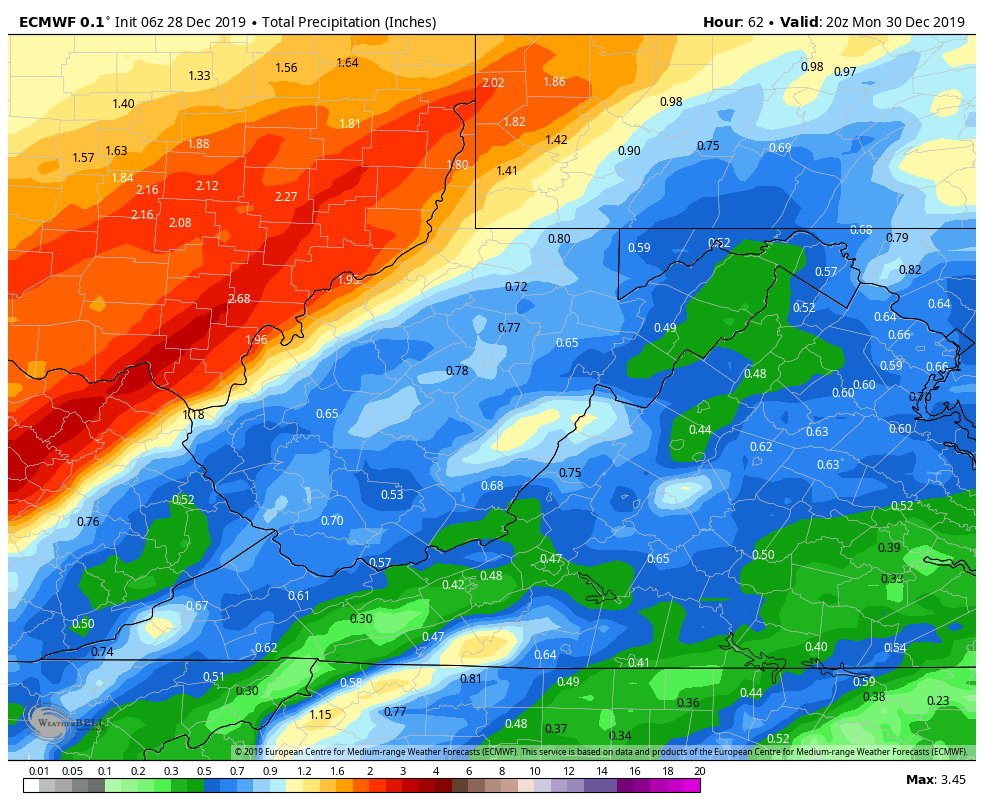
Models putting out +/- a half inch. More west
Temp begin falling later Monday and especially overnight. Maybe into the snow making realm…best snow making opportunity though comes Tuesday night straight through Wednesday night
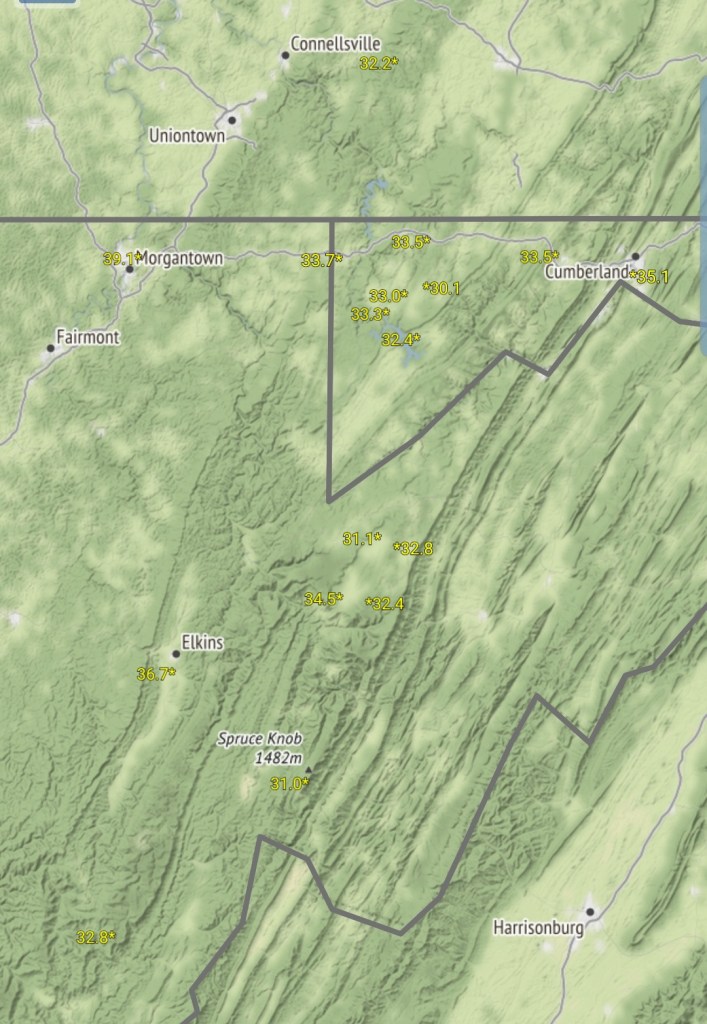
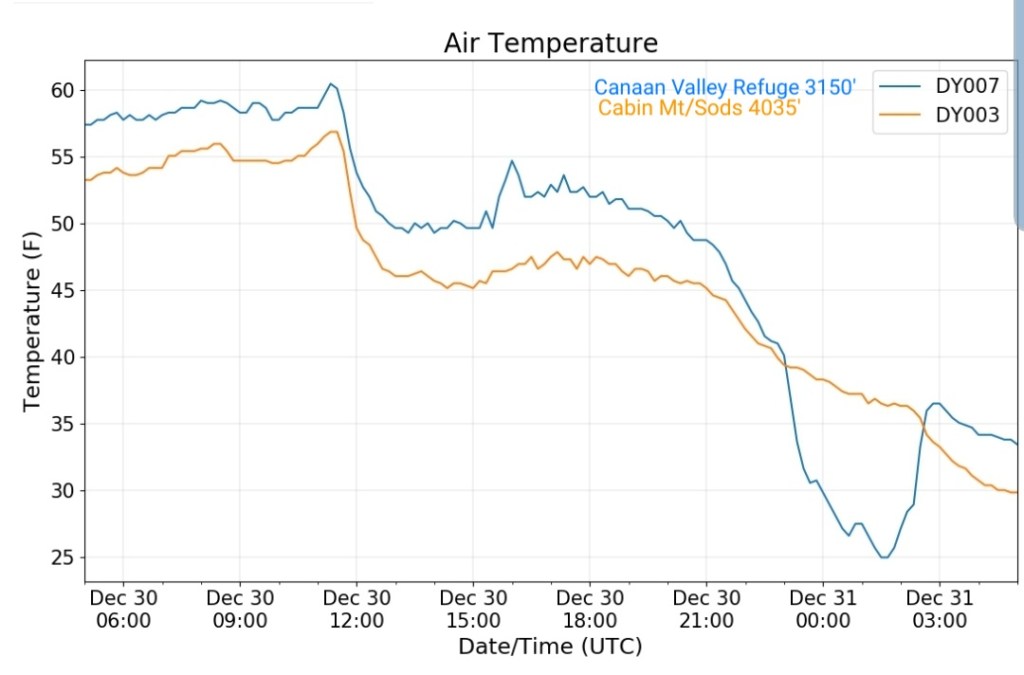
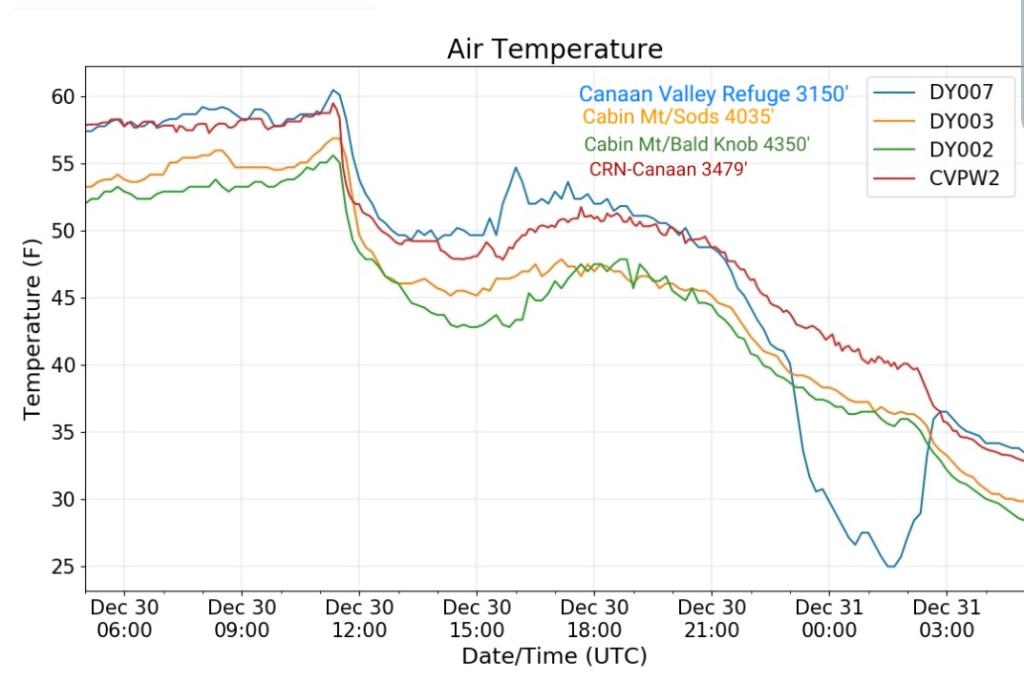
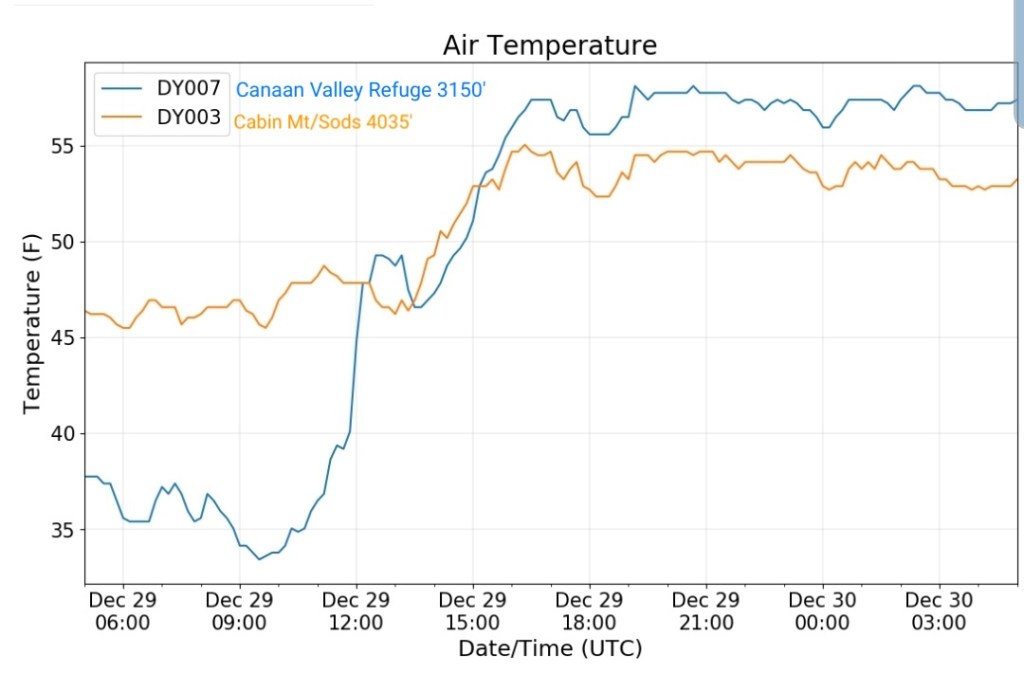
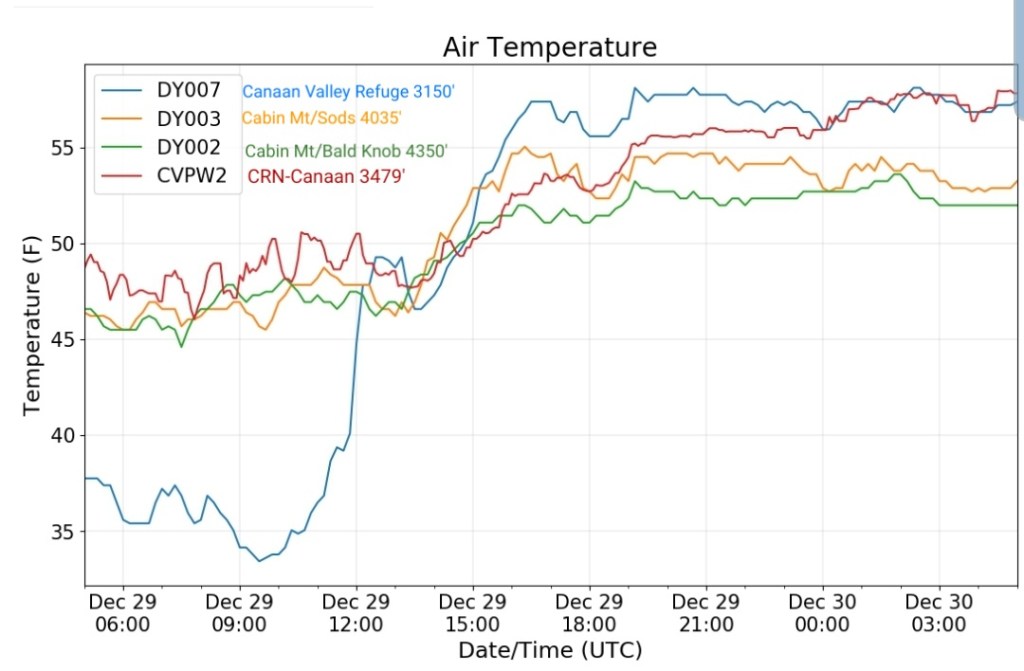
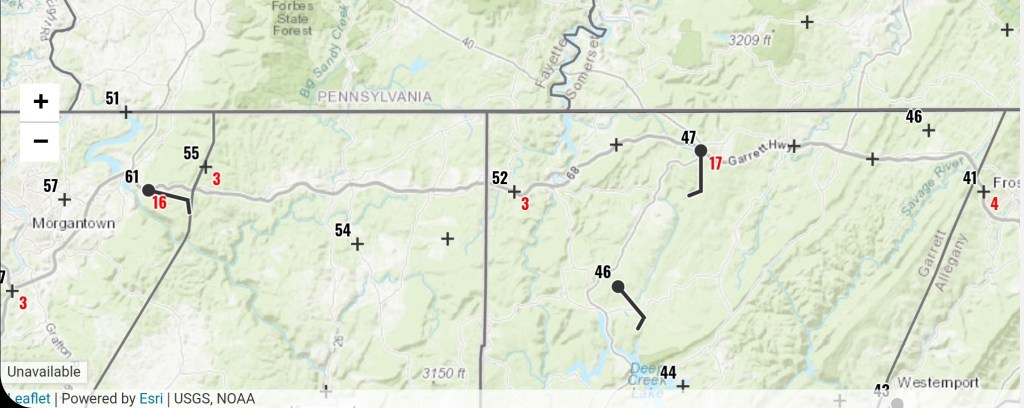
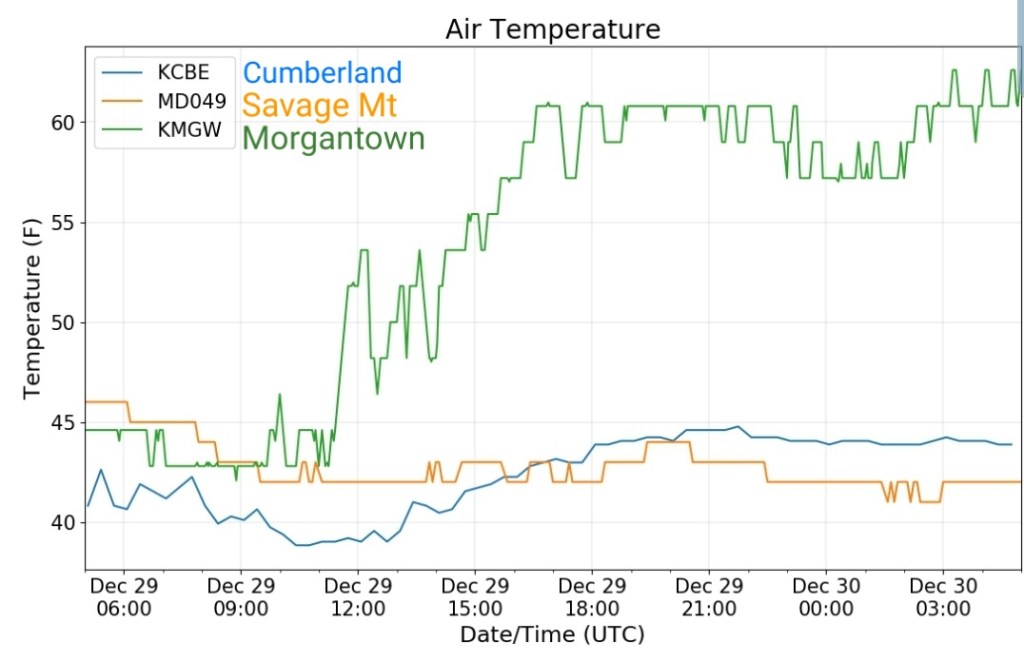
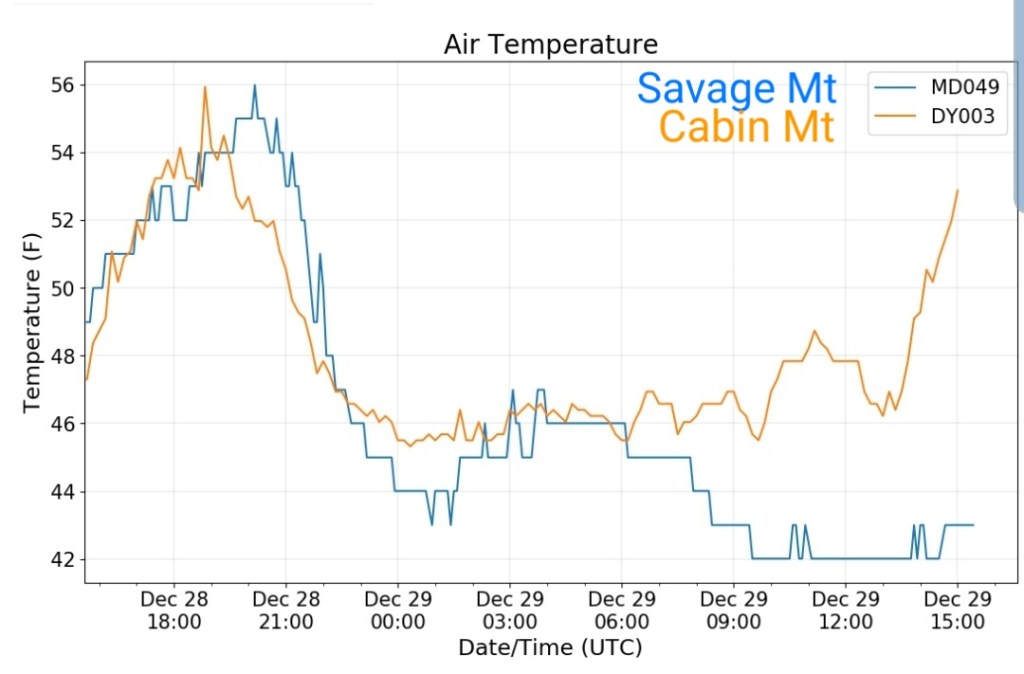
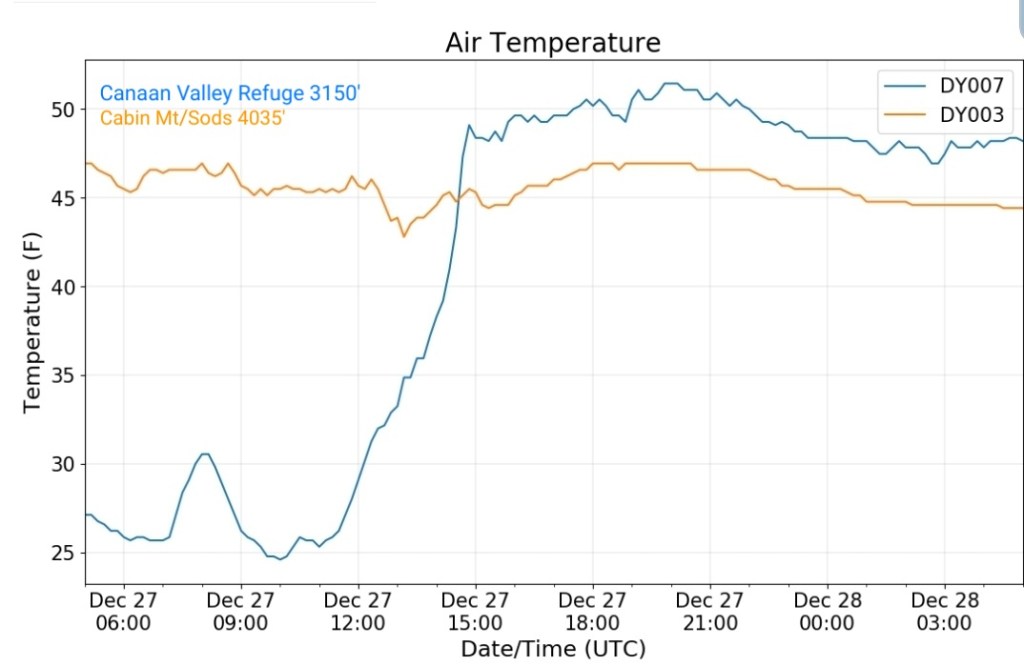
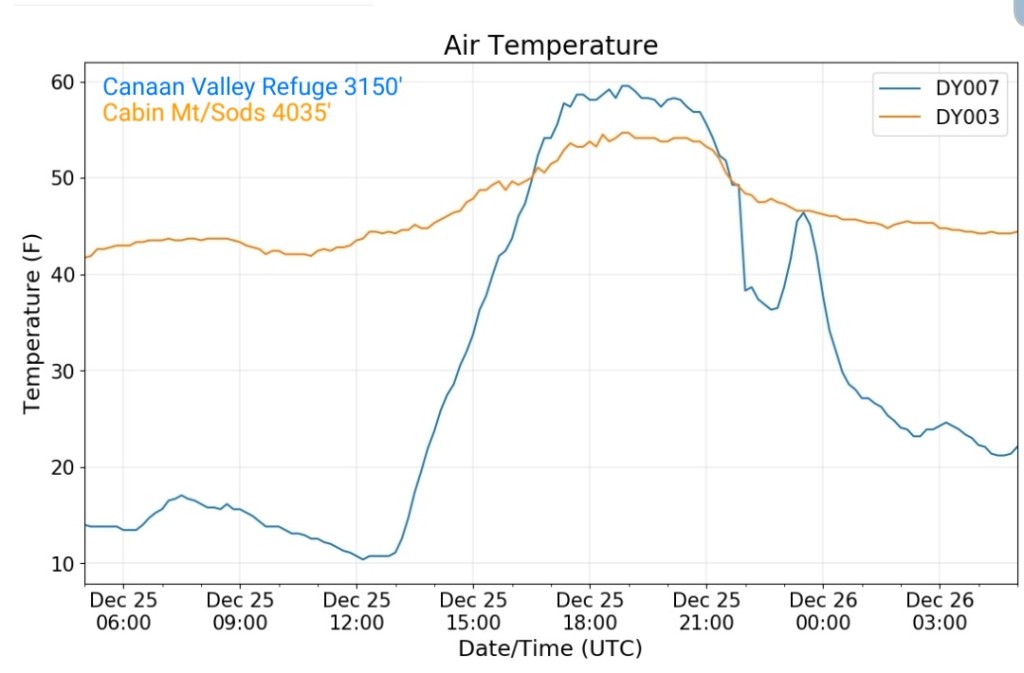
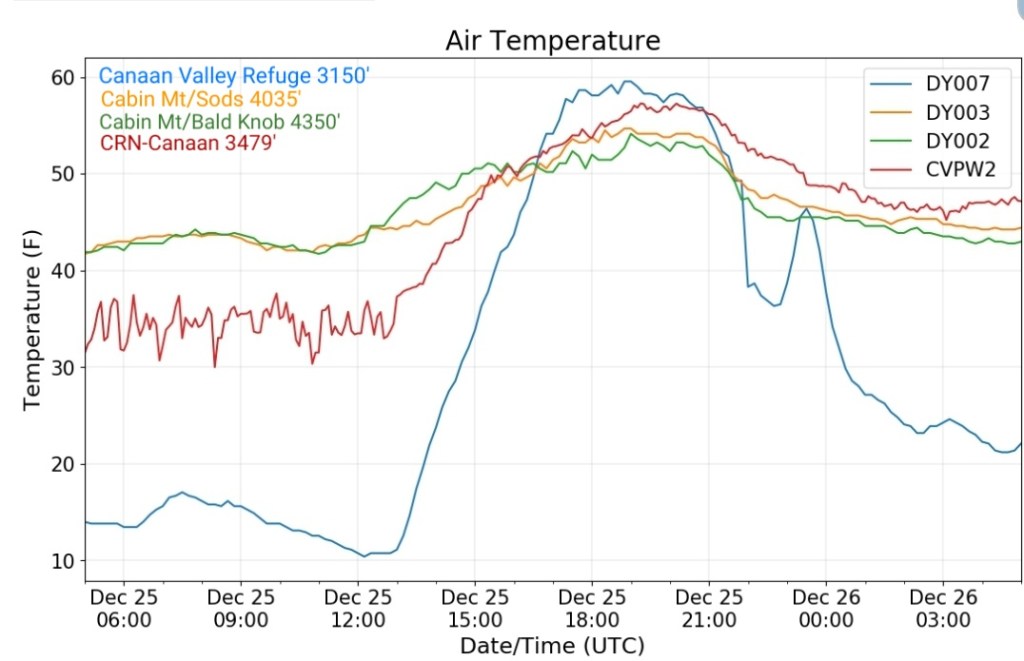
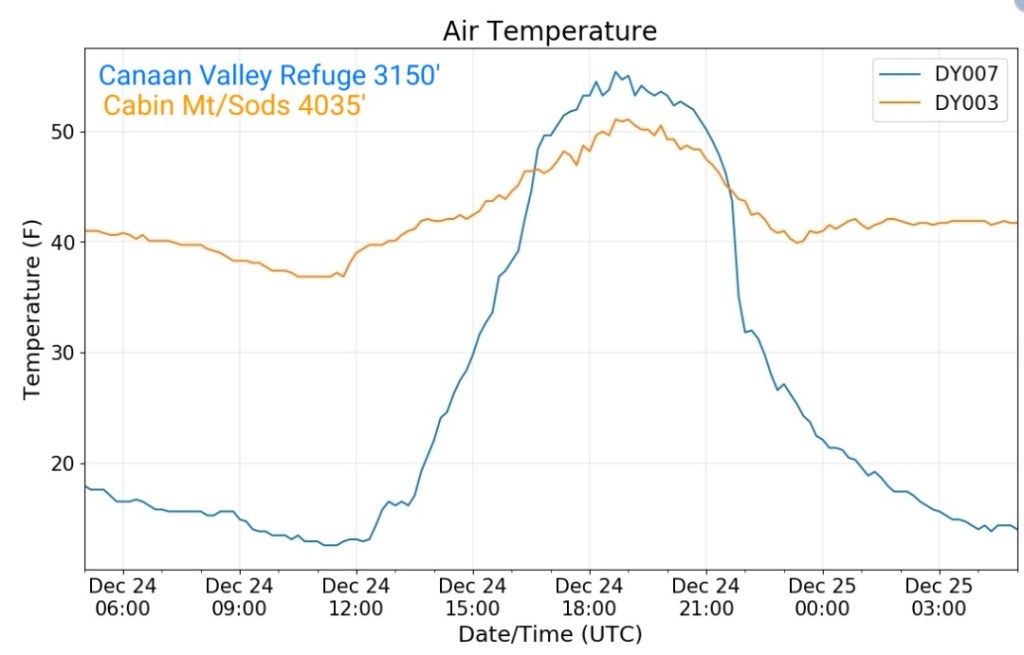
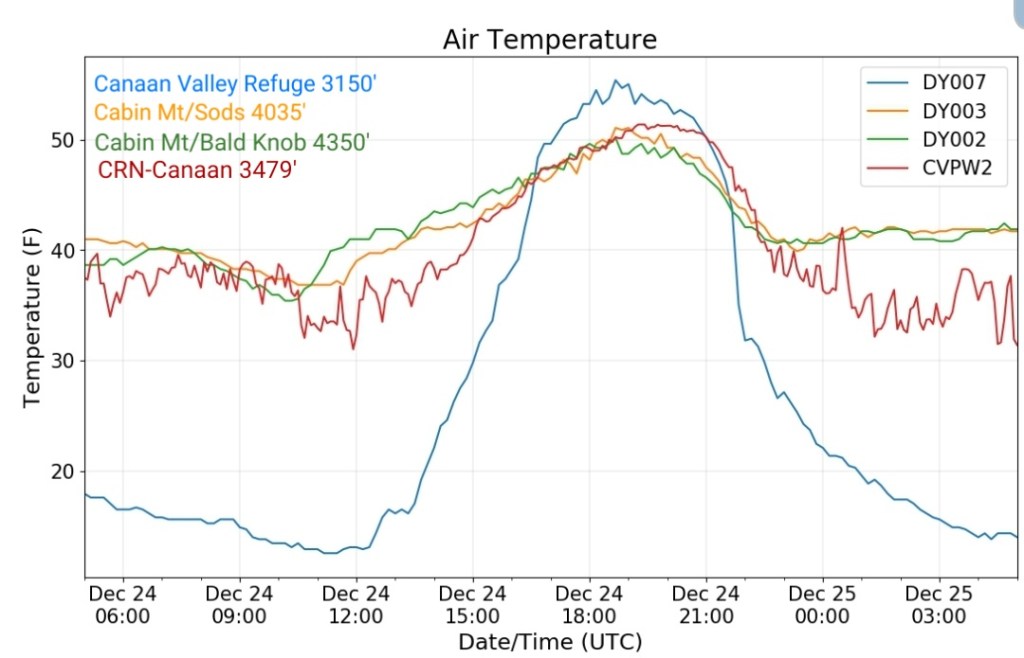
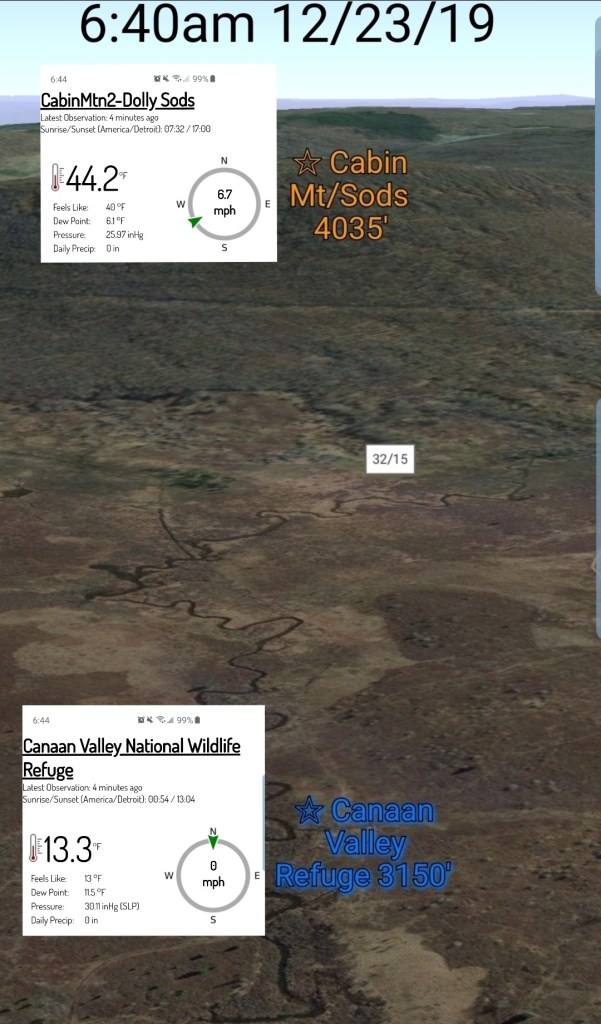
Temps off the 3km Nam. The fascinating boundary across Garrett today into early Monday, not cold, just chillier than areas south and west of the boundary. Those areas will be mild to warm.
Case in point, this morning the separation from Savage Mt in east Garrett to Cabin Mt in Tucker is evident
Clouds thinning to a high overcast and thinning by evening. Stars visible. A brief but rapid Valley cooling occured before cloud cover and light winds returned overnight.
Surface features and 500mb height anomalies and flow
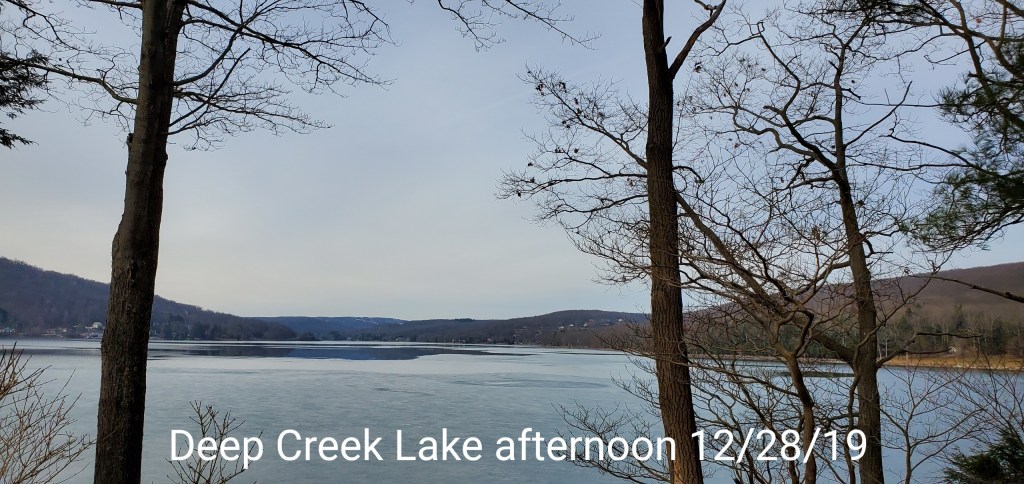
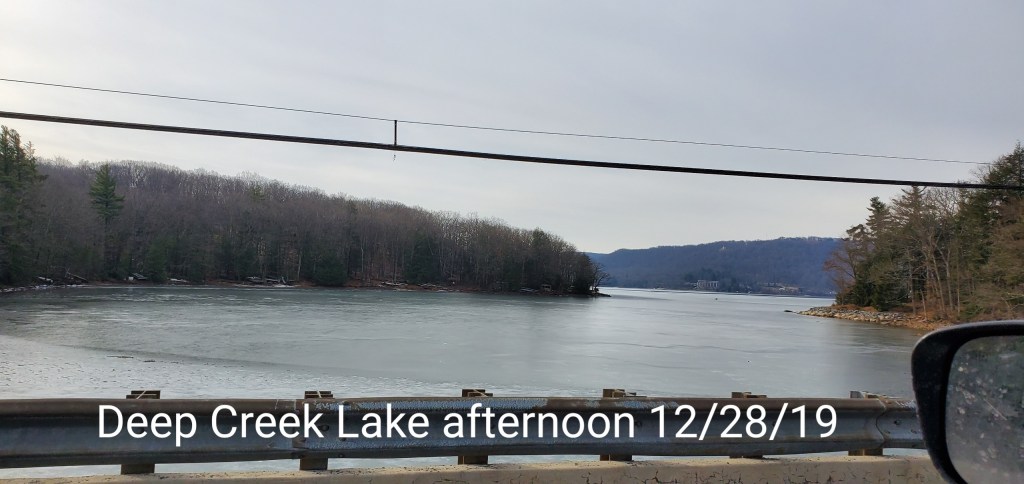
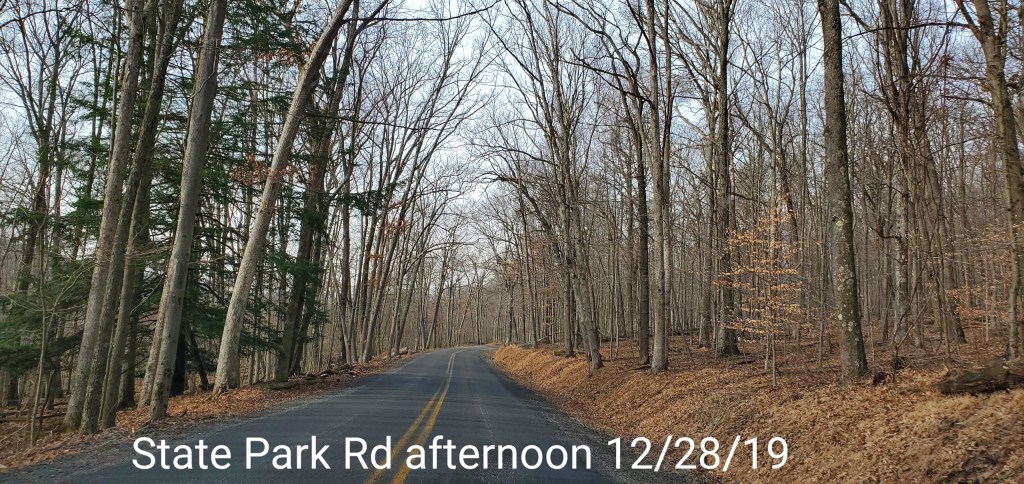
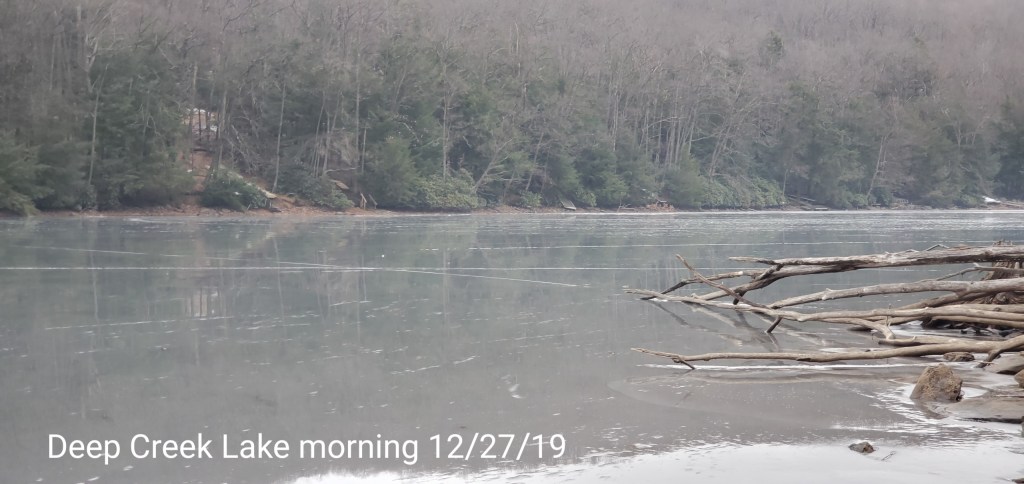
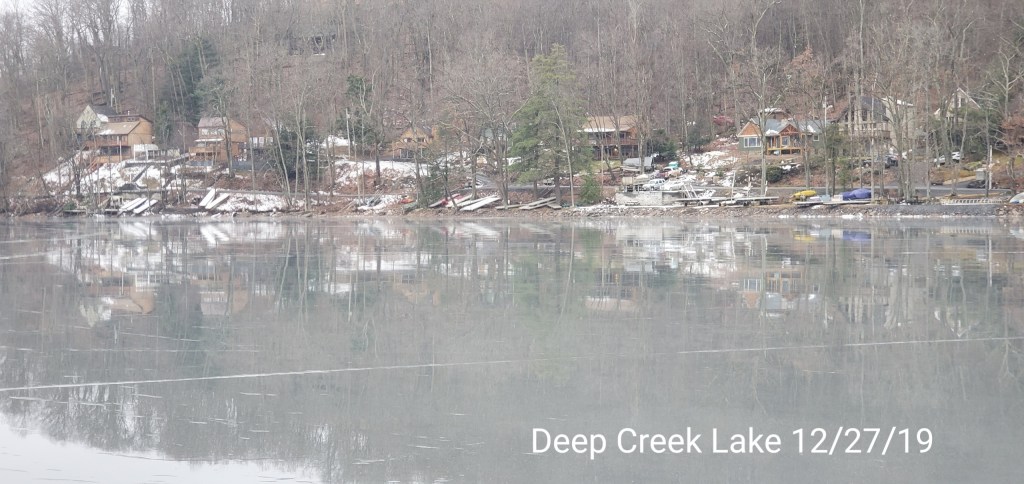
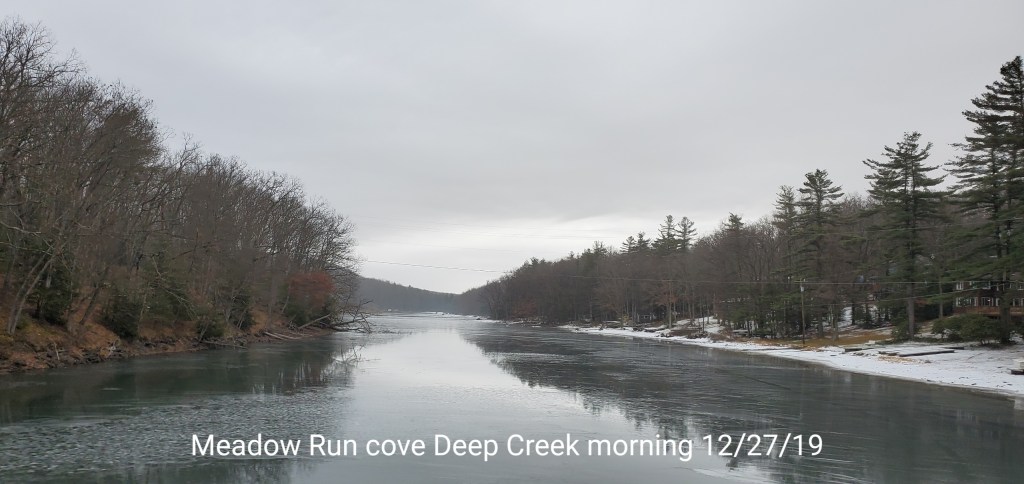
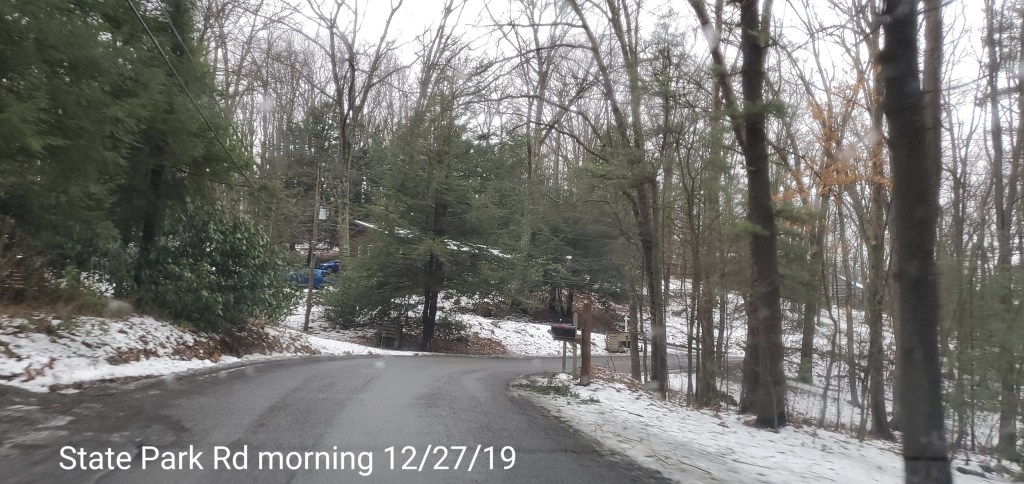
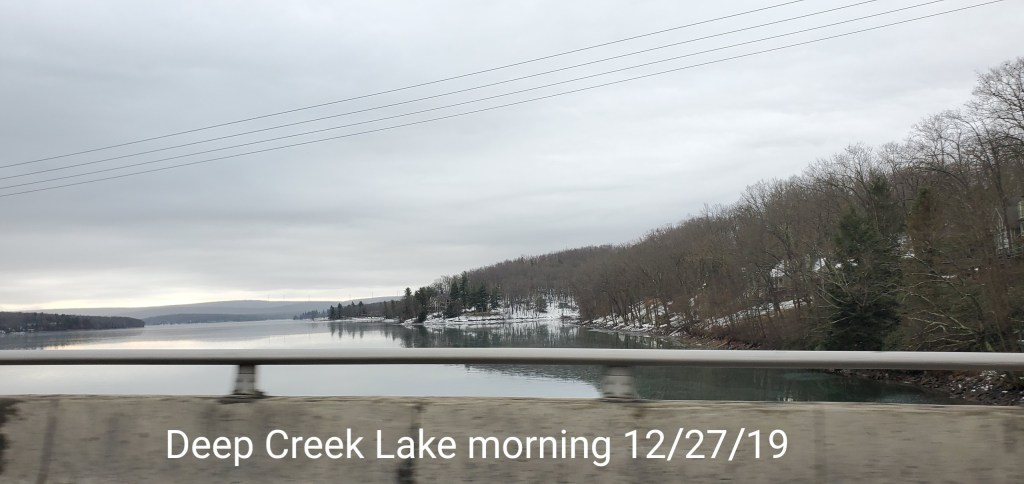
Pics today
Bittinger area
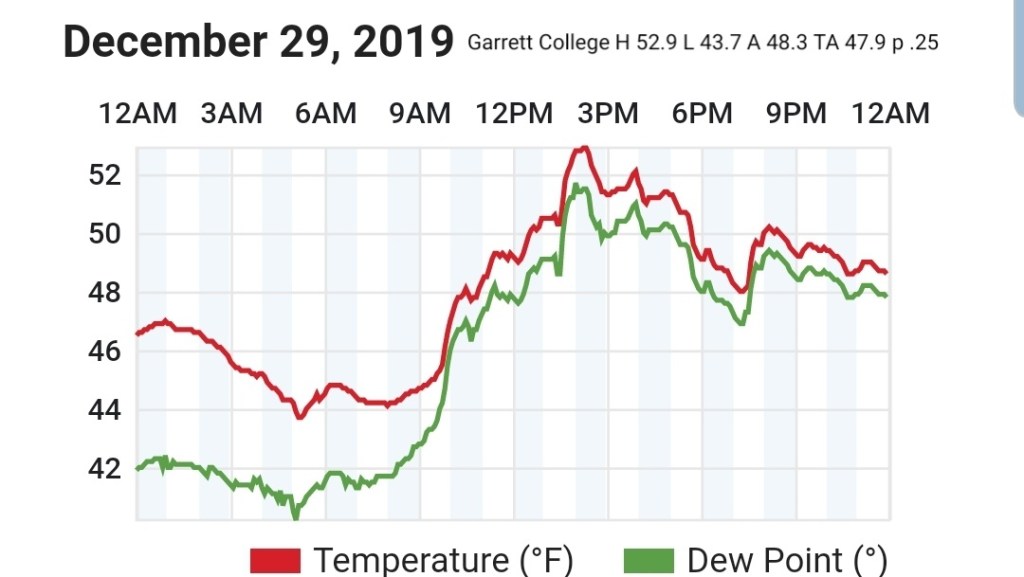
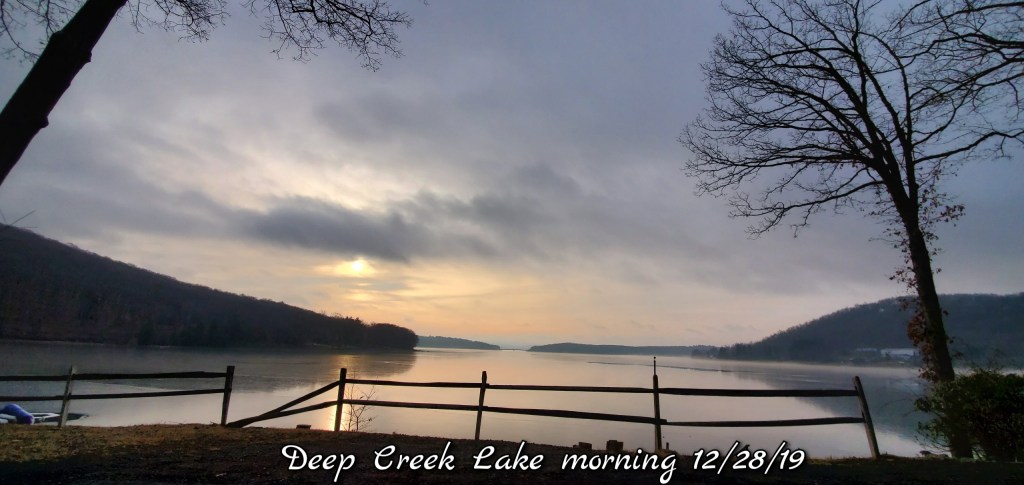
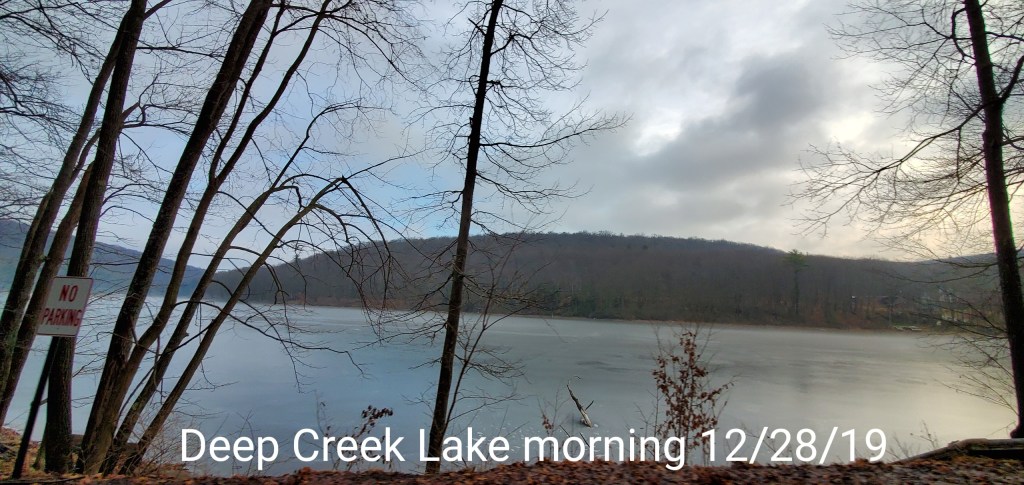
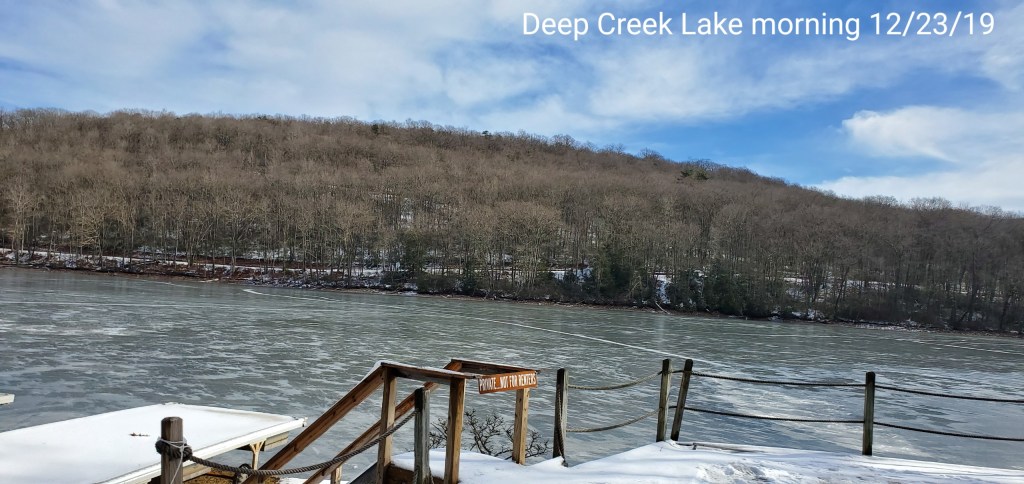
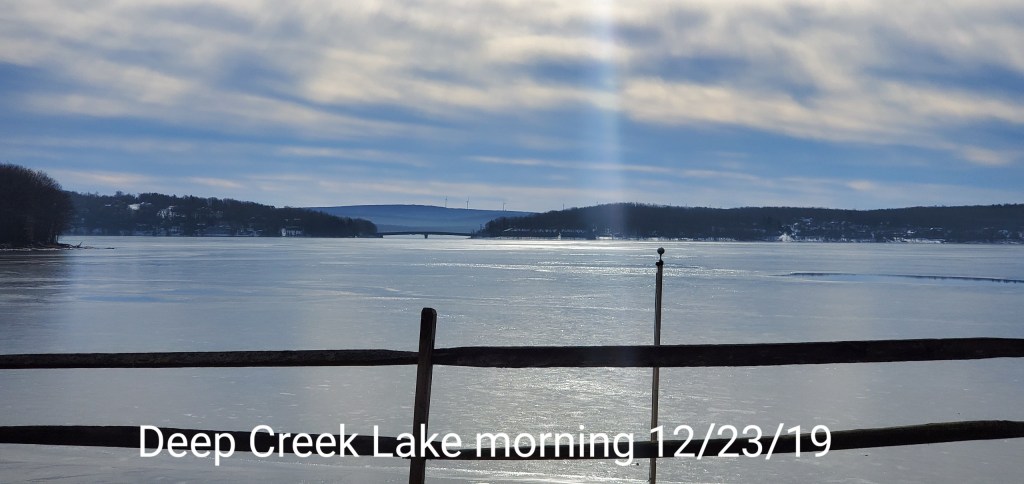
Deep Creek Lake area
Winter where art thou part deux…..
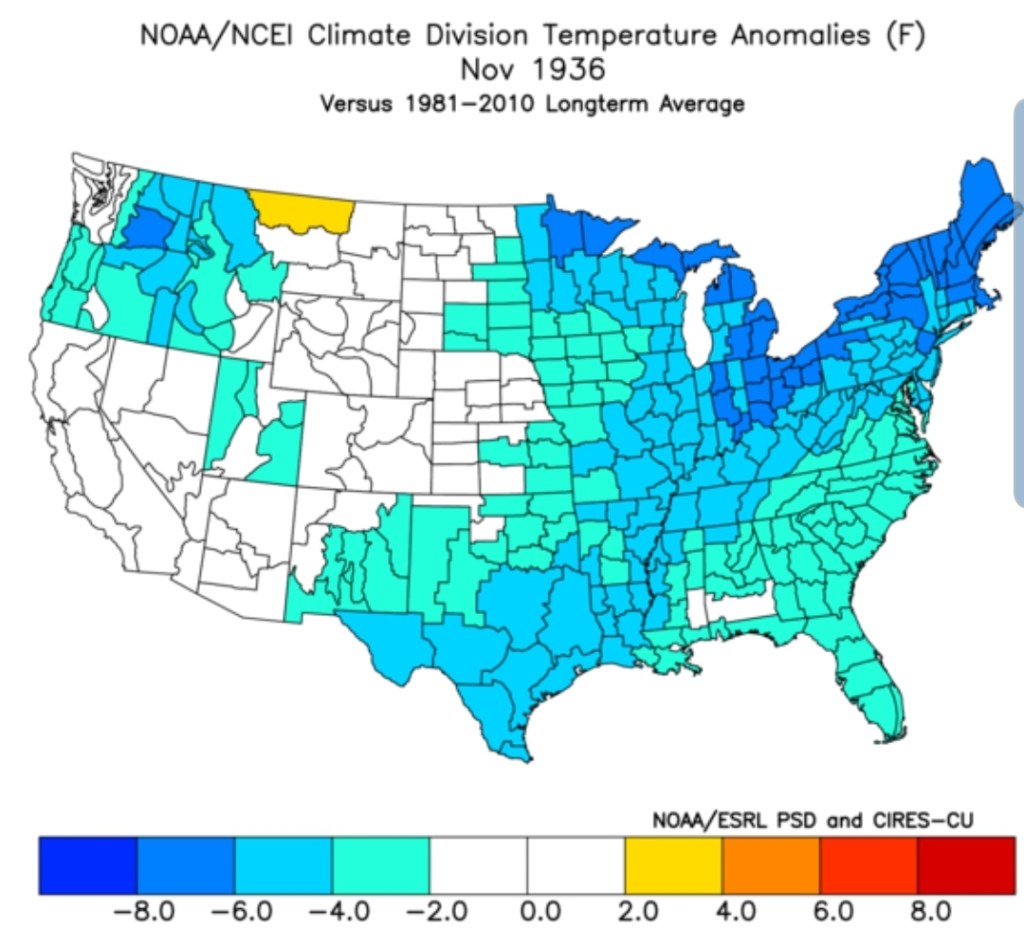
In yesterdays post, the 1936/37 winter was brought up, due to the similarities of the SST(sea surface temperature) anomalies of that year and this year. That year November was cold, and that cold was centered in the eastern 1/3 of the country
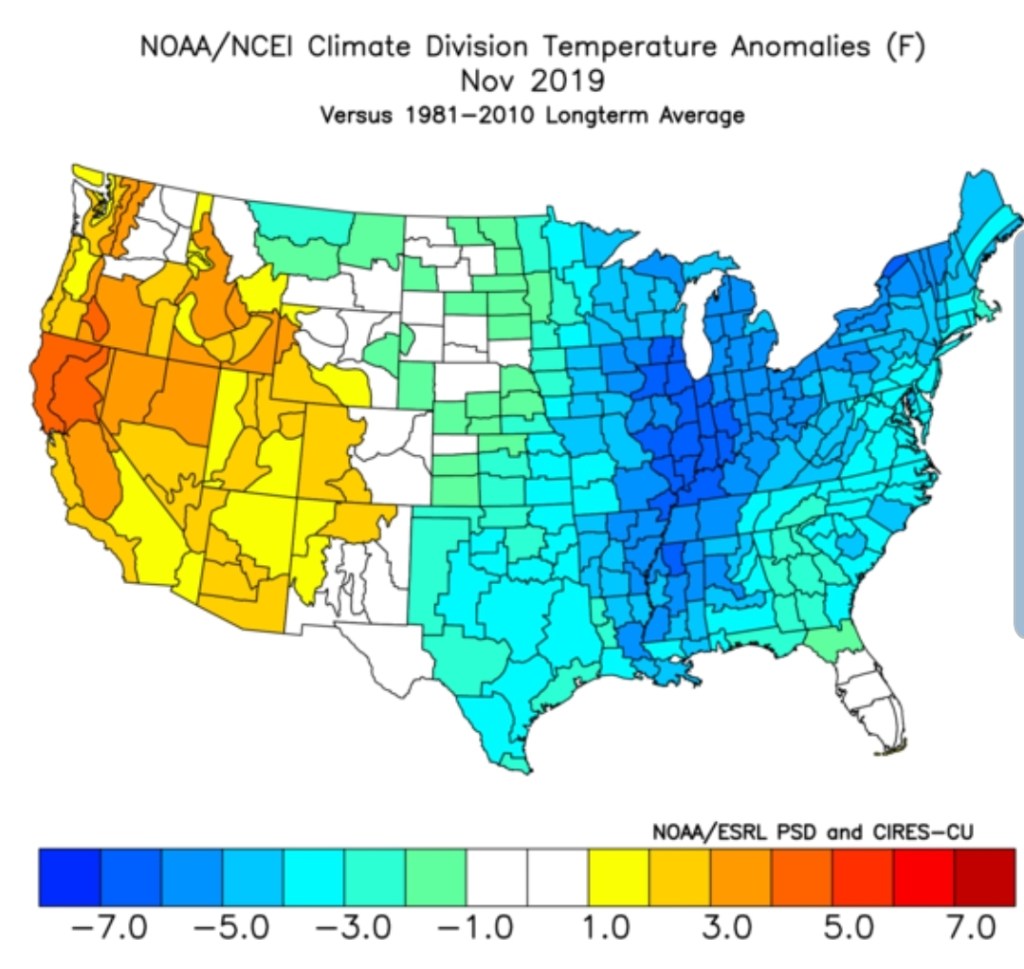
Along came this November, the cold centered in much the same area
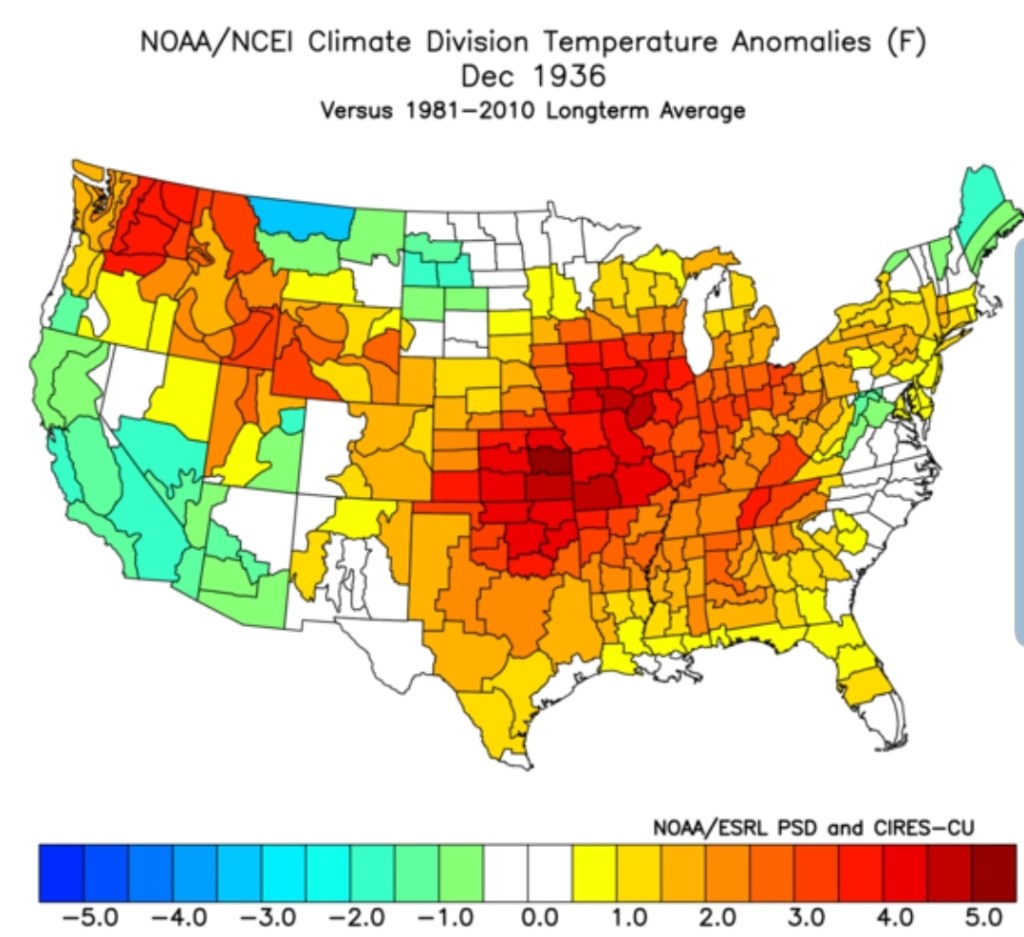
Then December came along and in 1936 went to this
Then this December went to this
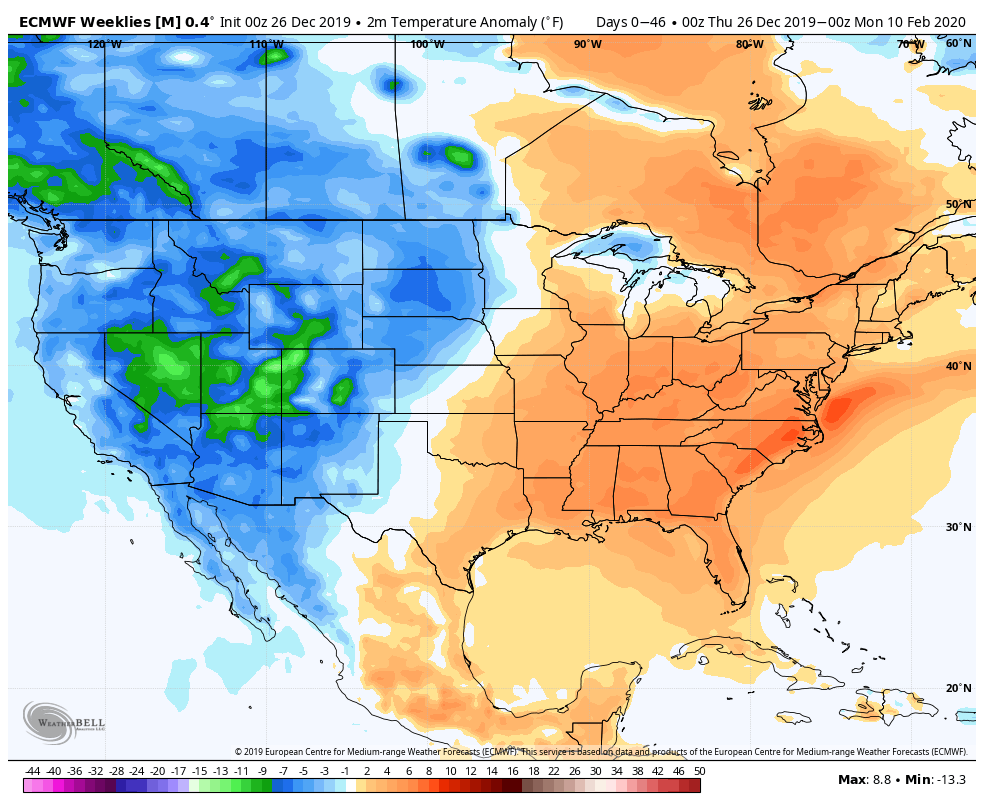
January on the most recent run of the European weeklies looked like this
January 1937 looked like this
Now part deux-
Nothing overnight looked promising for anything as far as sustained winter over the next 2 weeks. Yes, it can still snow and even be cold a day or 3 in this pattern, but the SW flow aloft quickly over spreads the Wv high ground and melts things off. That big 500 ridge off the Florida coast remains on the overnight models like a bully.
0z ECMWF
6z GFS
That look is not conducive for loads of winter time fun.
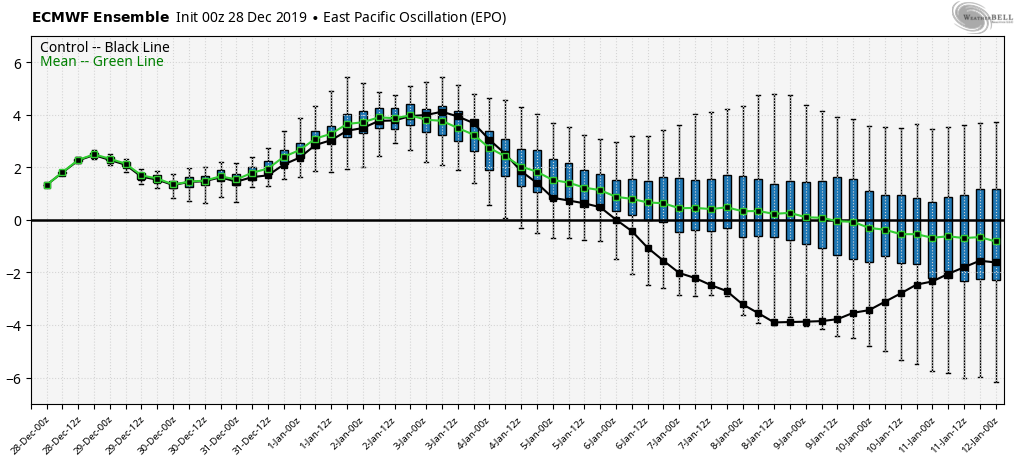
The 0z ECMWF Ensemble mean temperature anomaly outlook over the next 10 days.
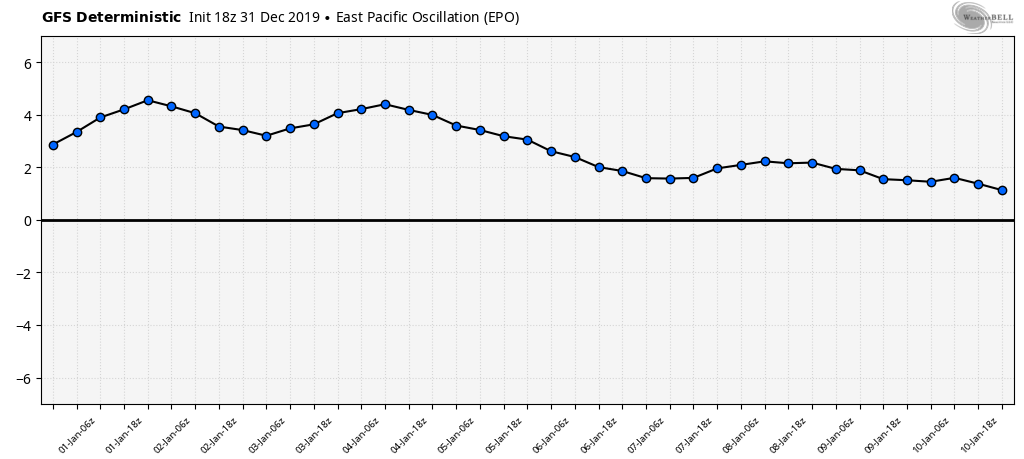
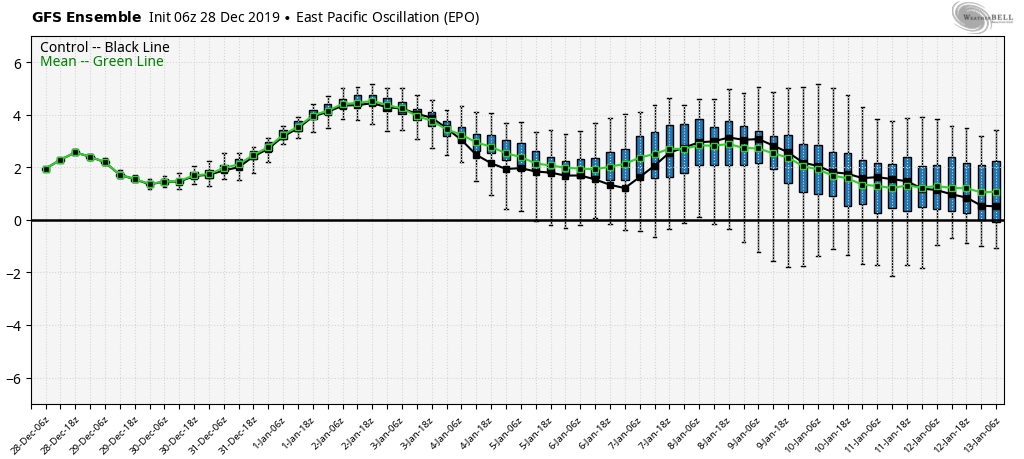
The warmth continously trying to rebuild in the east is a response to the big ridge in the southeast. The push of cold around the 6th-8th looks to be a response to the model having a negative EPO at that time. If that occurs, odds are it bounces back positive rapidly.
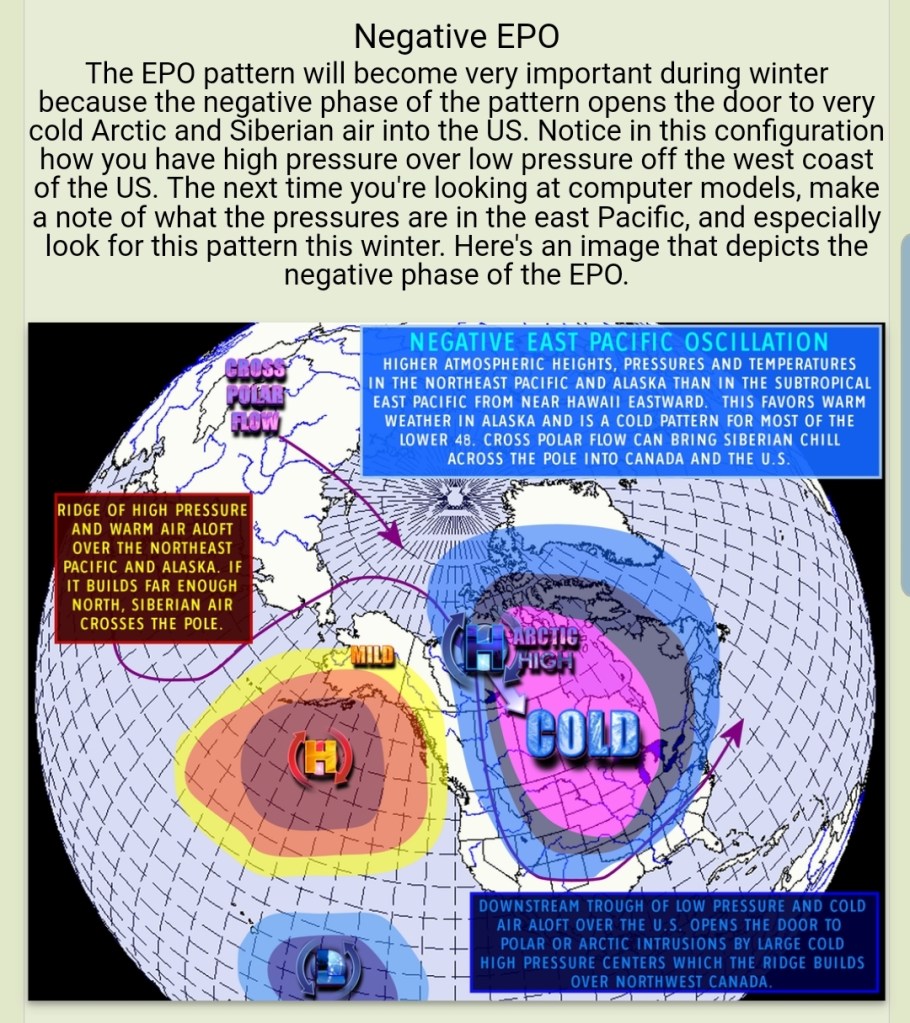
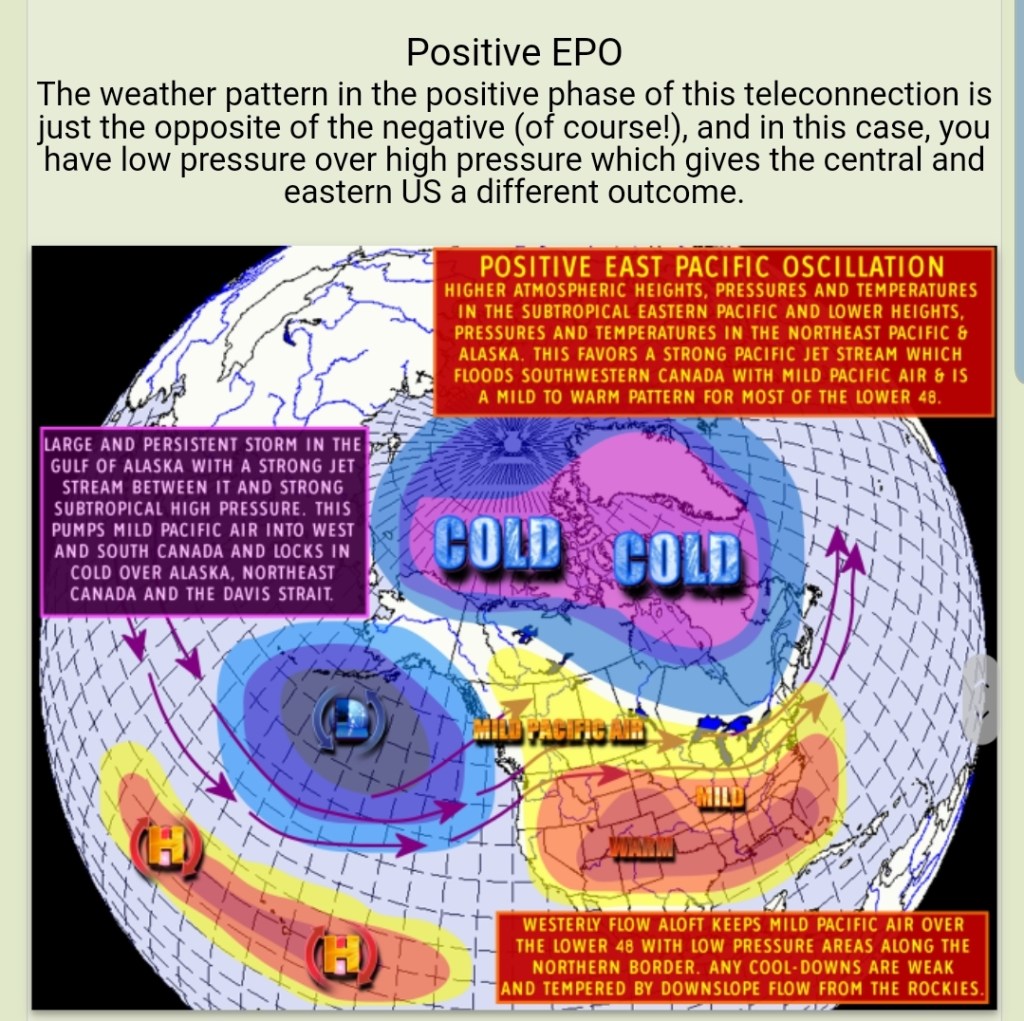
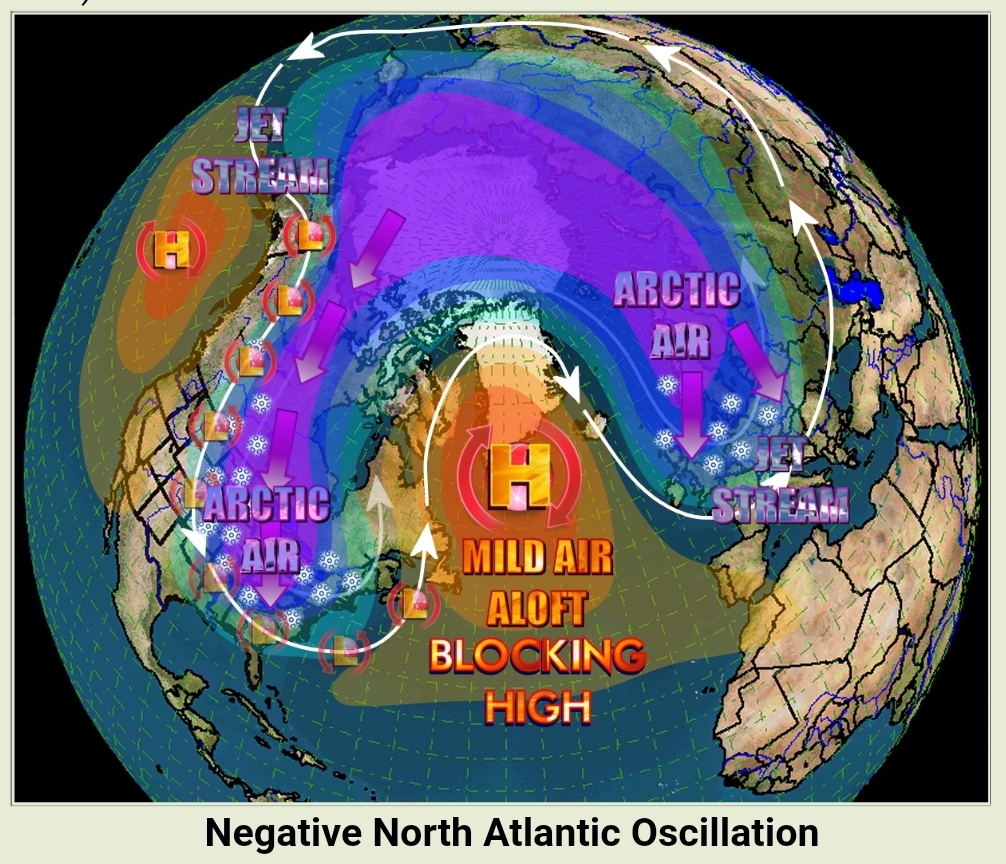
The EPO, nice description of it from Dacula weather site
However the GFS holds the EPO positive, but it does fall some in that period. The GFS is also slightly less bullish on the southeast ridge…
6z GFS Ensemble temp anomaly next 2 weeks
Models however have continously tried to bring cold in the long term only to see it disappear in the time leading up to it.
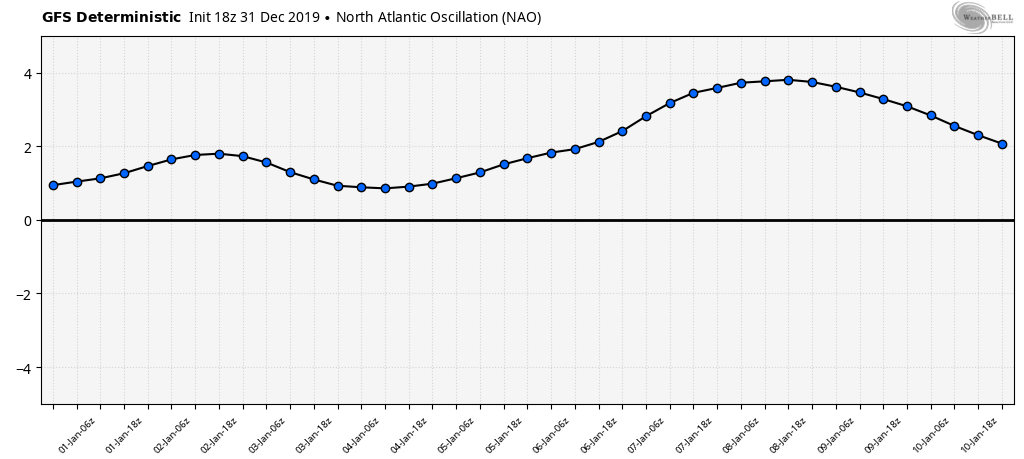
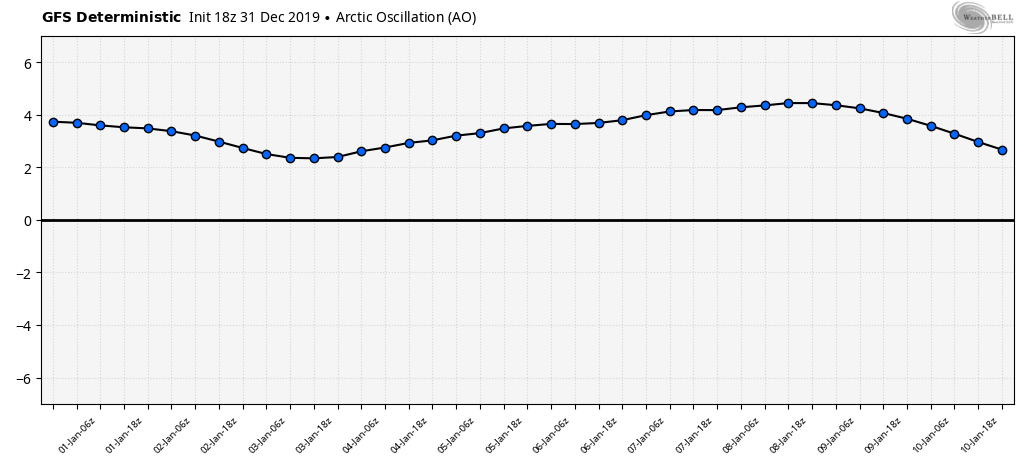
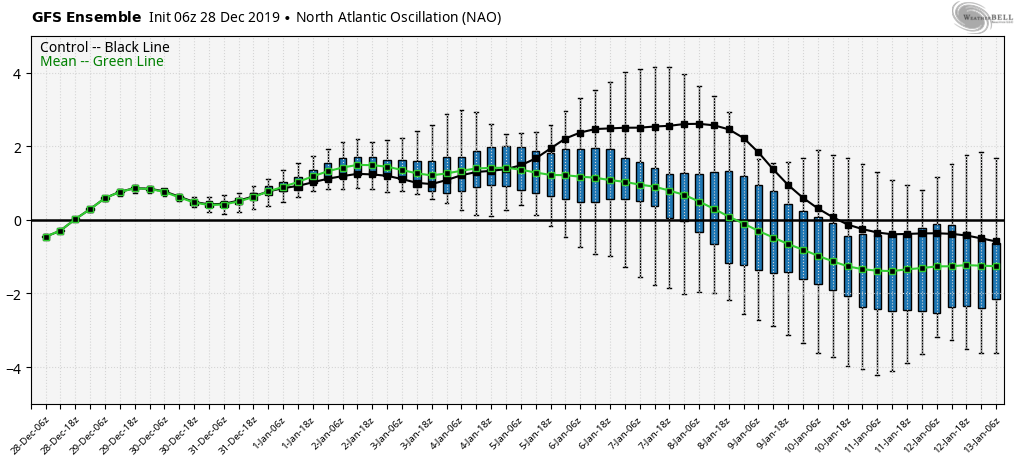
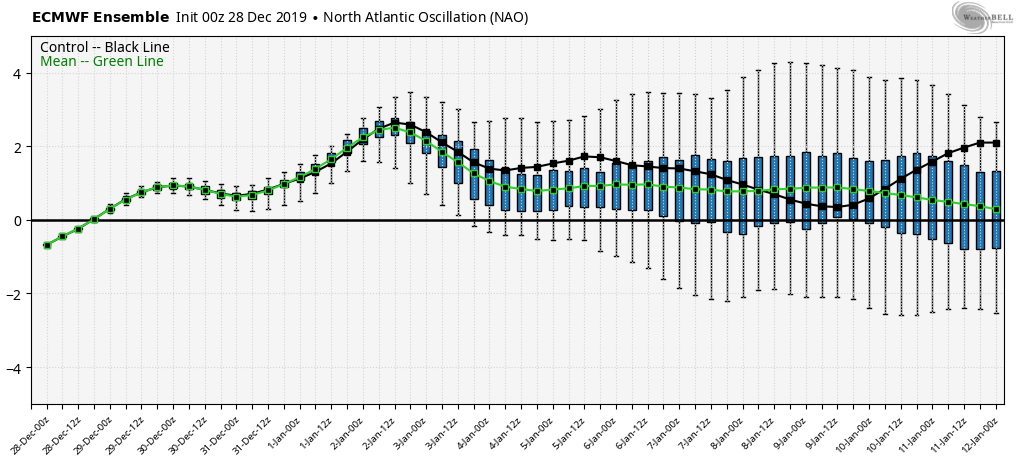
The NAO overall looks poor with a bit of a favorable trend of the GFS. Models do struggle with this .
The GFS and ECMWF ensemble
Again a nice graphic from the Dacula weather site
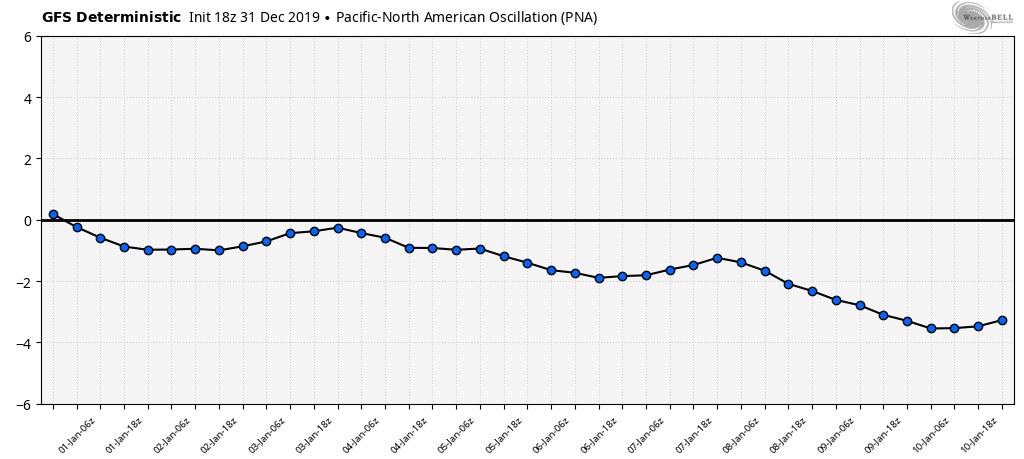
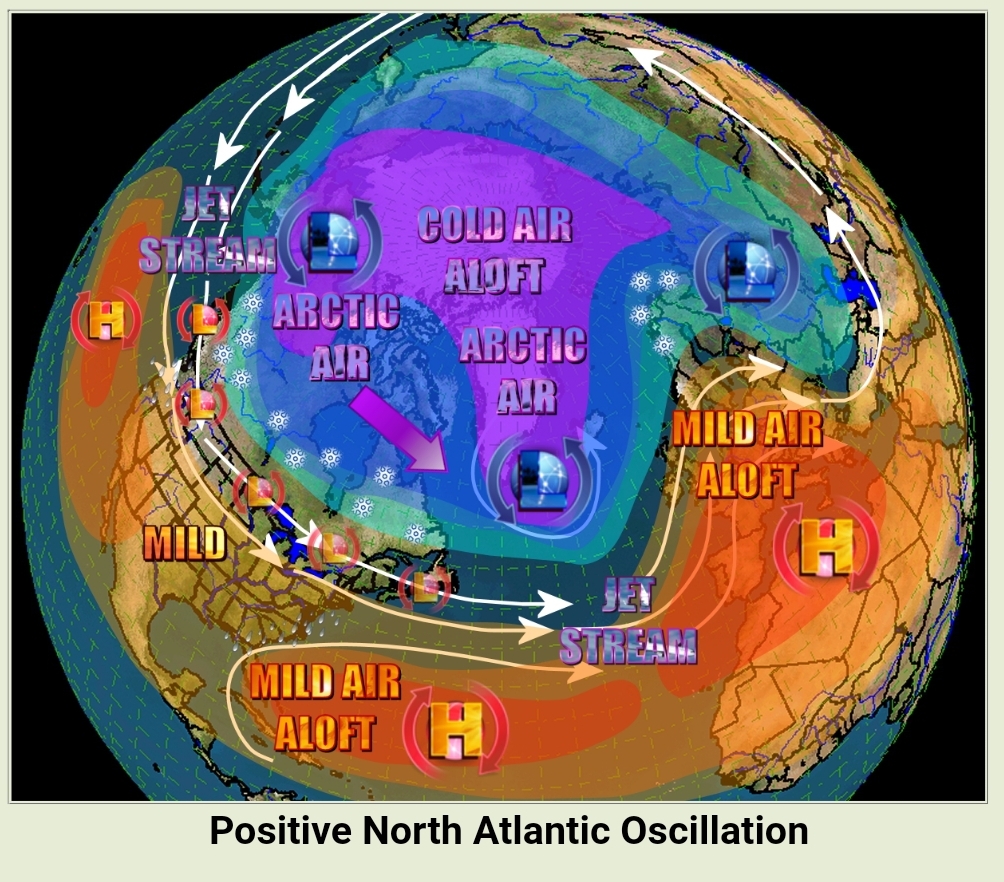
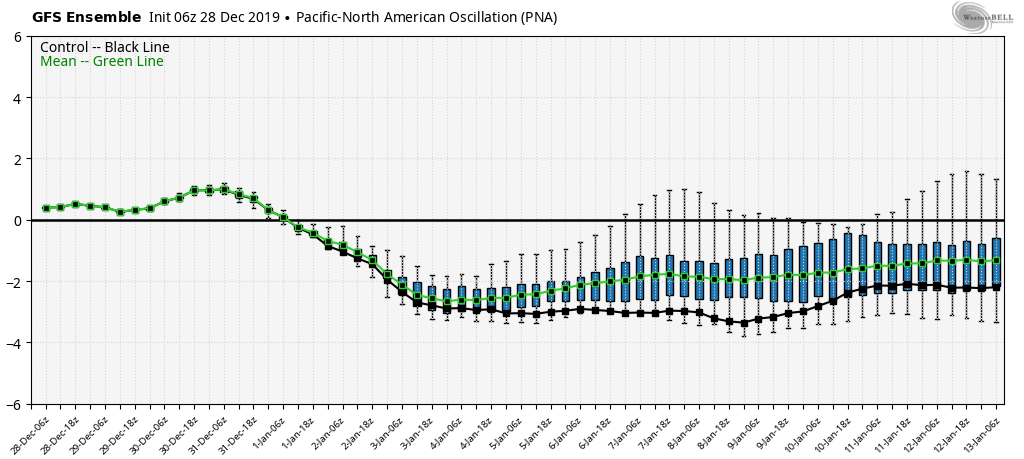
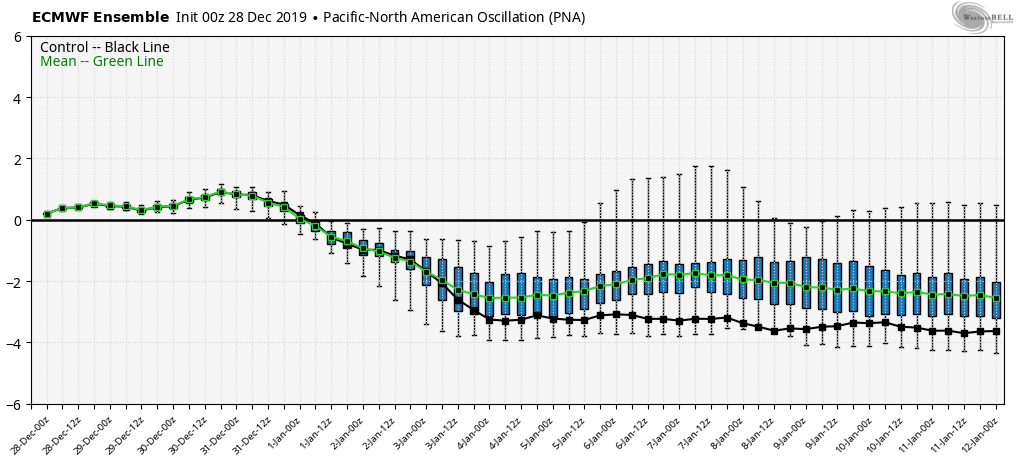
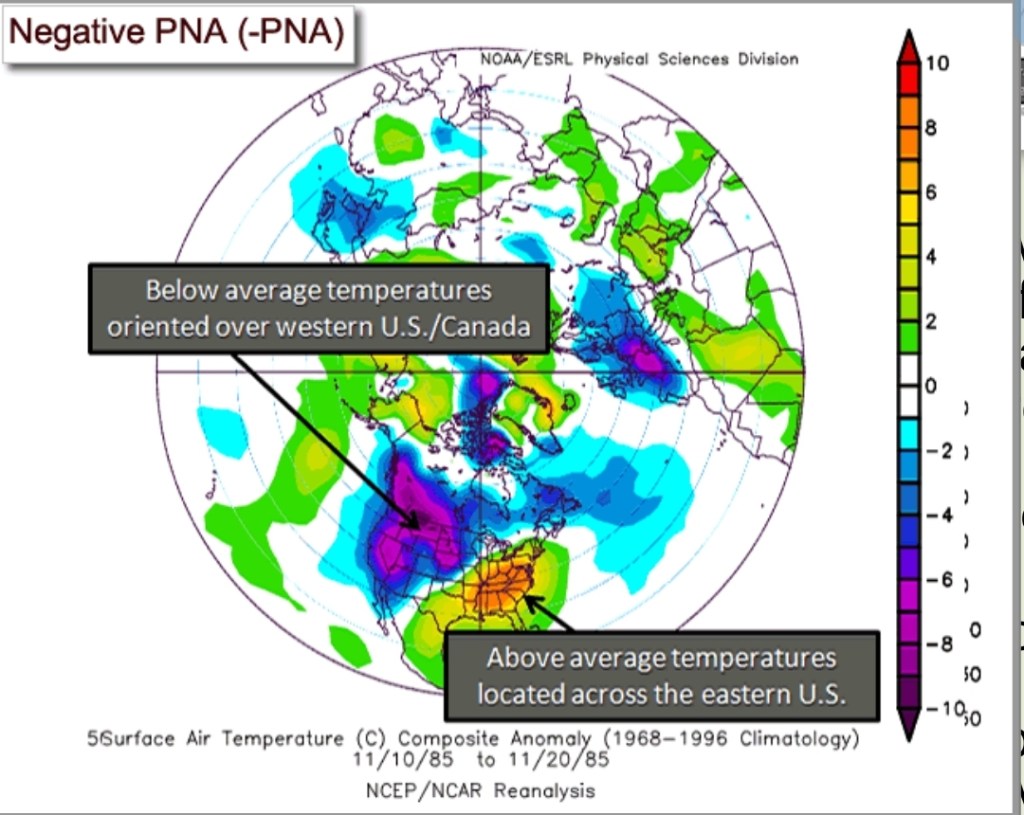
The PNA is unfavorable
Again the GFS and ECMWF ensembles
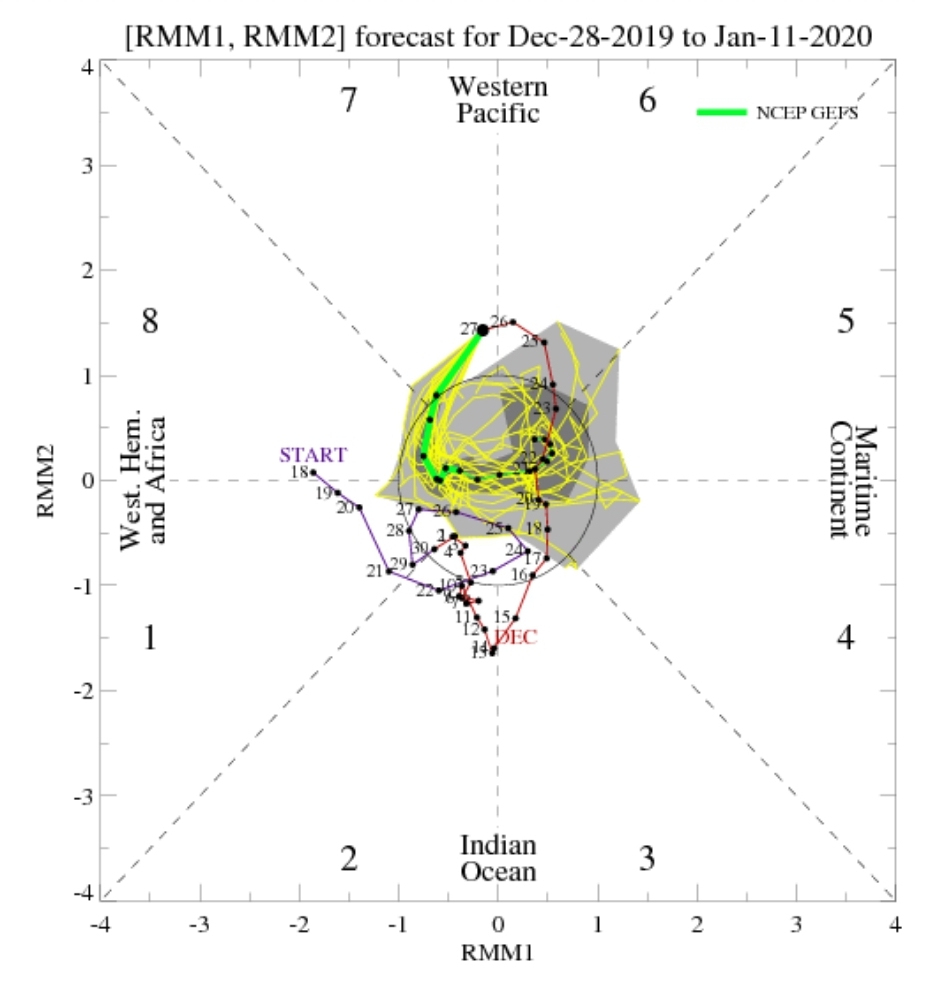
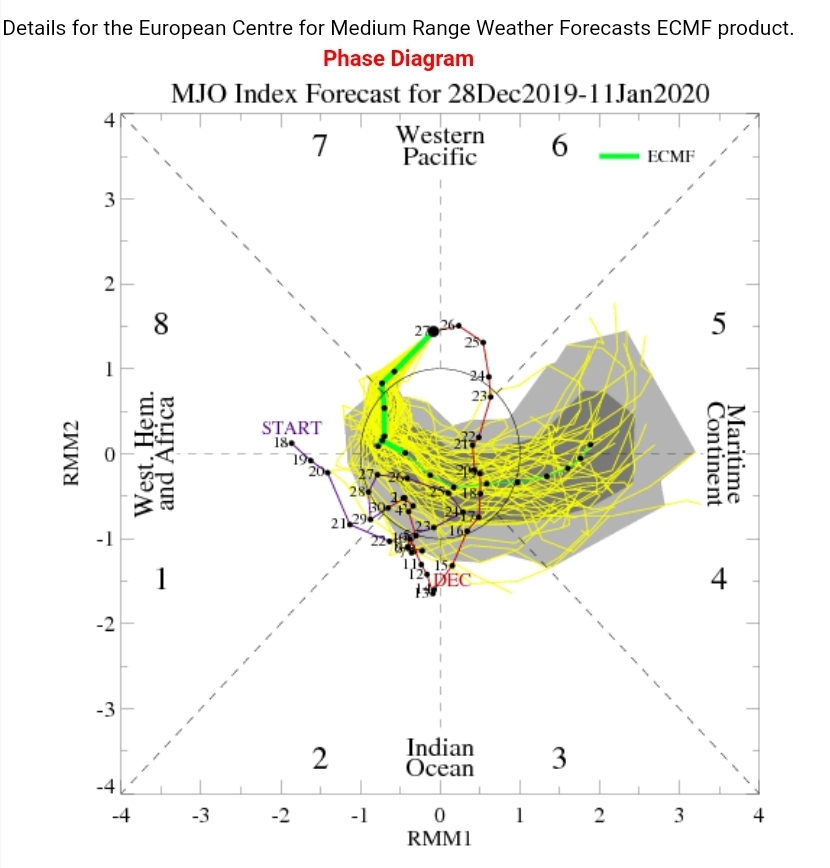
The MJO in 7 and headed to the null phase and modeled to circle back out into 4, 5,6… that’s a anti winter look
The GFS MJO and ECMWF MJO outlook
Correlation
The overall dominant appearance of all these features gives a look that favors this.
The hope is the EPO can hold negative and the ridge breaks down. That’s the hope anyhow if you like sustained winter.
Onward-
So, 1937 with more similarities. Admittingly this is for fun, but interesting to see the likenesses. Snowfall data sets are the least valuable datasets as observer technique is unknown for some of the data. At any rate-
Snowfall to date at the Oakland site in 1937
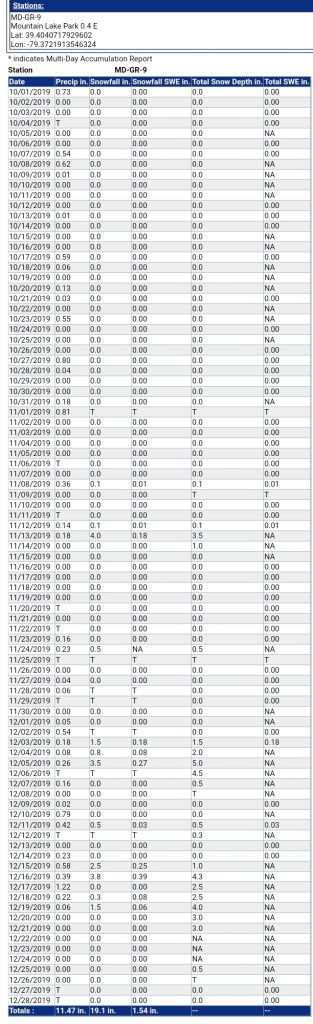
Current snowfall from the Mt.Lake Park observer who is much better than what’s out of Oakland now days
18.0 then, current observer at 19.1. Obersever technique and error can cover that.
Oakland snowfall through January 37. A monthly jump from 18 to 22.
How about some other sites
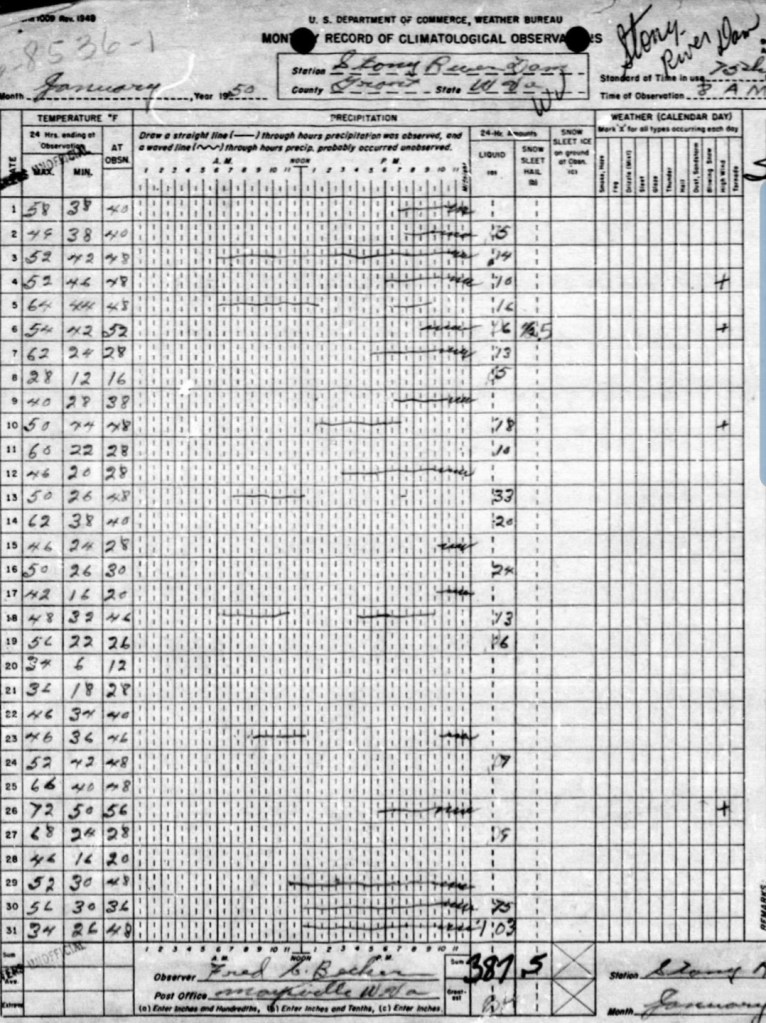
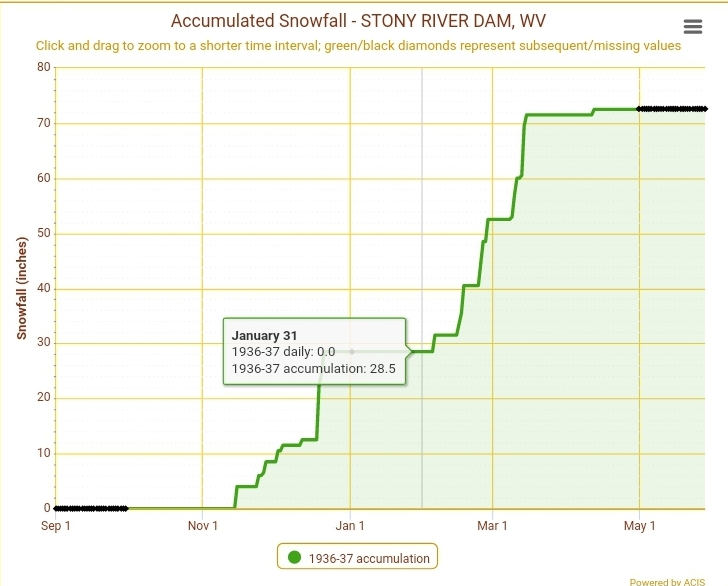
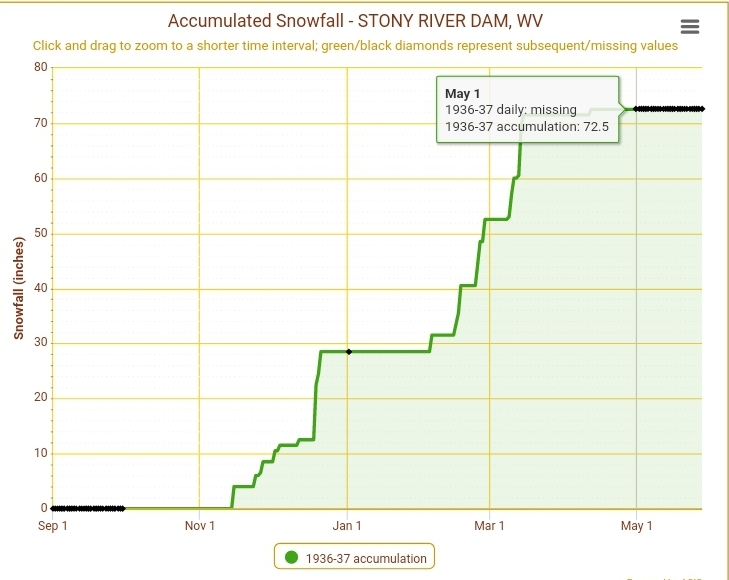
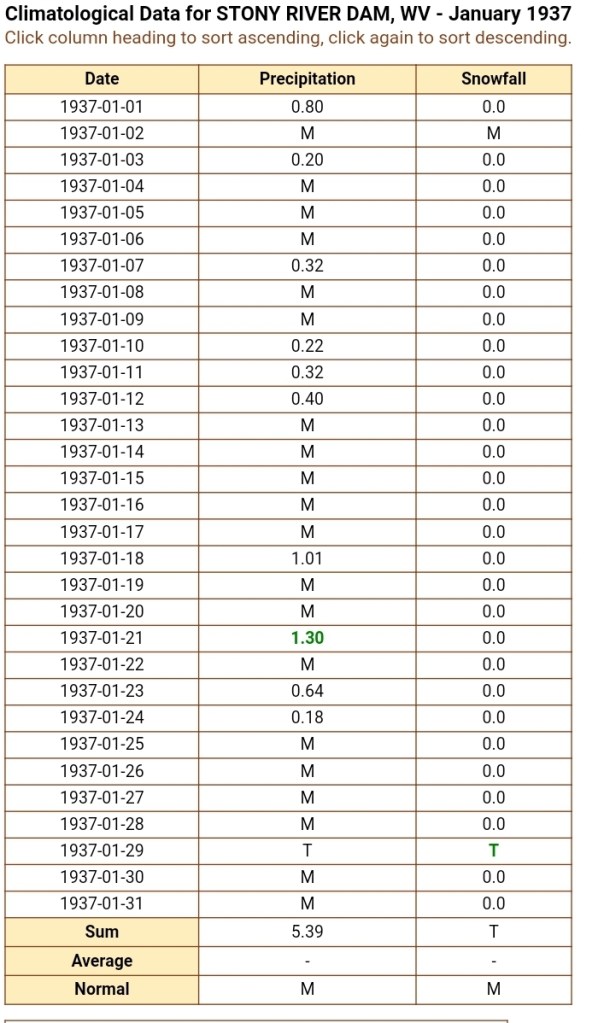
Back up to the Stony River Dam site. No longer in existence, but it provides some data pre Canaan co-op days
Through today’s date, 28.5″ was recorded on the season in 1936
Now, through December 28 of this year, Dave Lesher at Davis 3SE is at 28.6″
Through Jan that year, Stony River site added 0
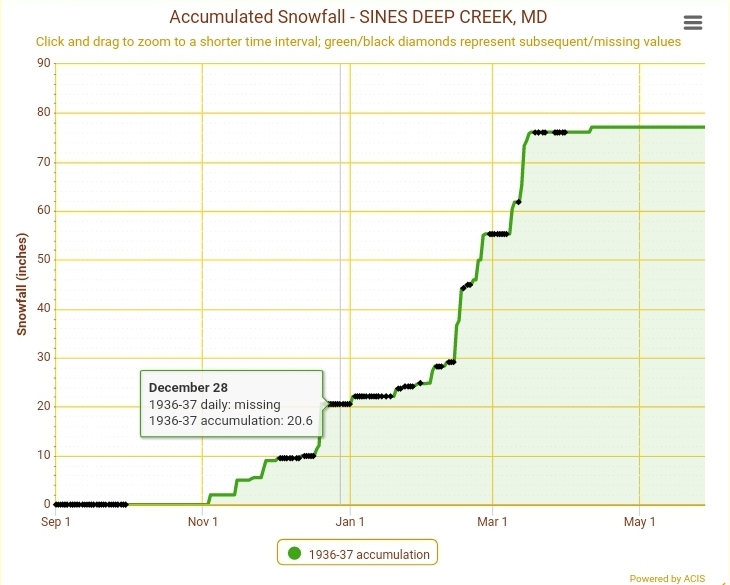
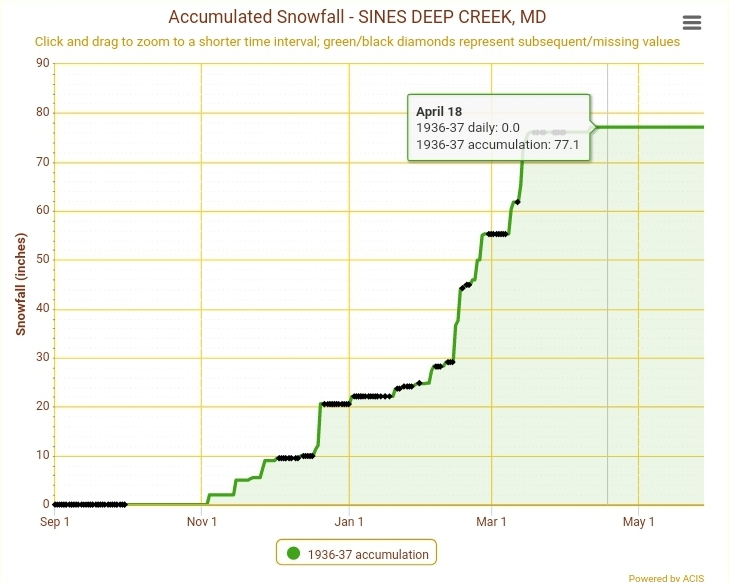
Station at Sines Deep Creek, not exactly my location- was at 20.6″ on the season
*this site has missing data. In all appearances it’s highly likely they only recorded in snowfall obs when it occured.
So far this season to date, I’m at 20.8″
through January they gained only 4.7″
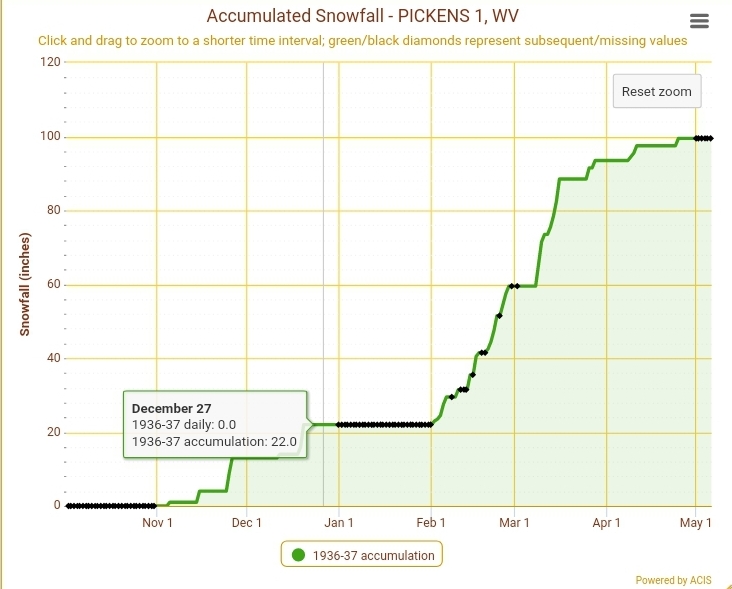
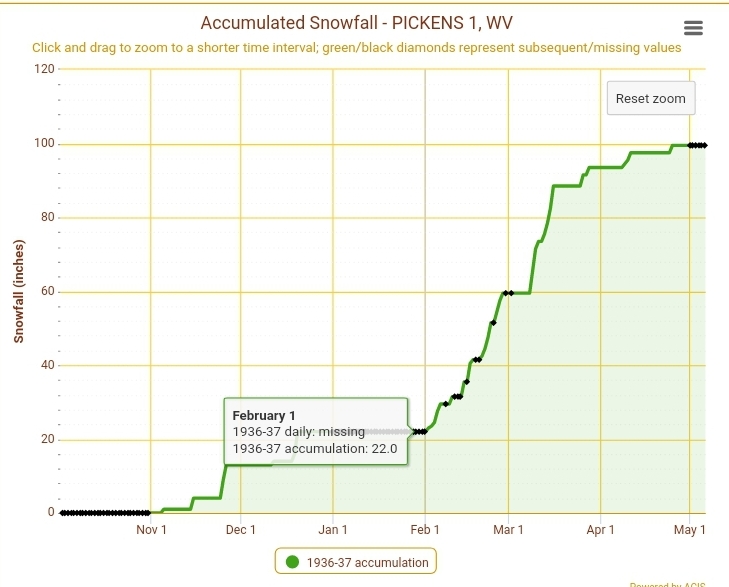
A jump down to Pickens Wv. Unfortunately there us no good comparison site currently.
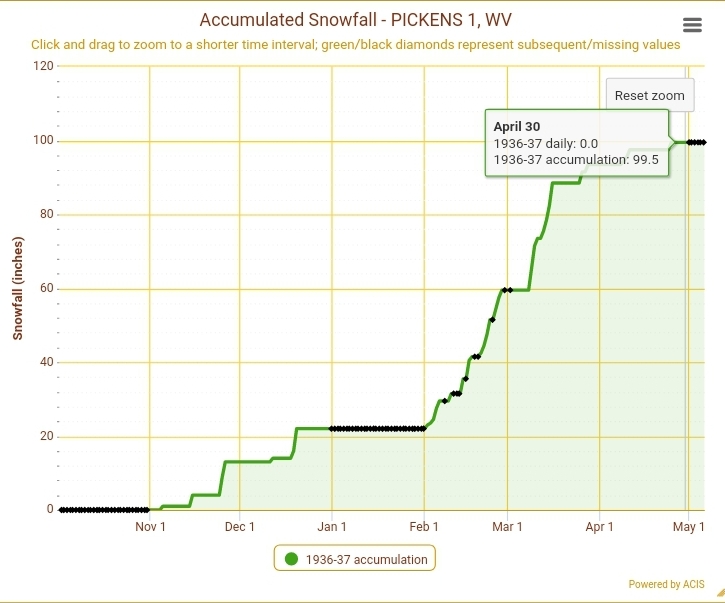
At Pickens through the date on snowfall for the season
At 22.0″
Through January of 37… reason to believe the missing days were simply due to no snowfall occurring and it goes right along with other sites.
Marching forward-
Where did 37 go in February and March
Feb of 1937 seen some variability in temps, that ended in a overall normal month
Some of that variability in temperature can be seen here at the Oakland site. Each bar representing the max/min. Lots of up and down swings through the 2nd half of the winter with colder air outweighing the warmth, but even then, some warmth was still existent.
Then in March
And April
As far as snowfall
Oakland ended up seeing most of its snowfall post Feb 1, jumping from 22″ to 68″ to end the season
Stony River Dam
Jumped from 28 Feb 1 to 72 to end the season
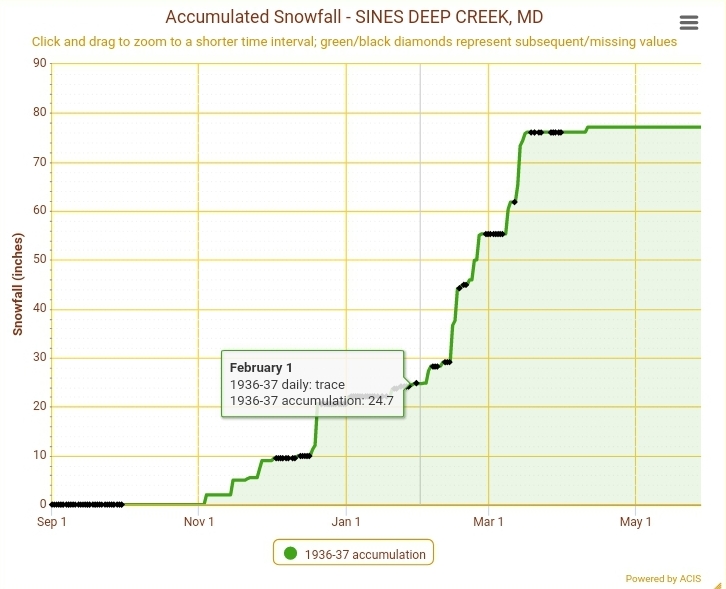
Sines Deep Creek jumped from 24.7 Feb 1 to 77.1 to end the season
Pickens jumped from 22 on Feb 1 to 99.5 to end the season.
As far as the ” least of winter” , that season, nor this one likely will go to that territory. Some late 20s winters, the winter of 26-27, 31-32, 41-42, 48-49, 51-52 are some example of ones even worse(if you like snow)
In the end, hopefully all of this rambling is for not and winter turns on a dime much sooner and offers a January surprise.
Upcoming several days
Tomorrow we see the local climatology boundary come into play. Easterly flow. That north central Garrett area and points east, north, northeast hold much chillier than the Wv high ground and points west. 3km Nam does a superb job in the setup routinely
Showers through Sunday increasing late
Precip amounts to be .4 to .8 range, locally higher. Heaviest remains west.
6Z GFS and 0z ECMWF
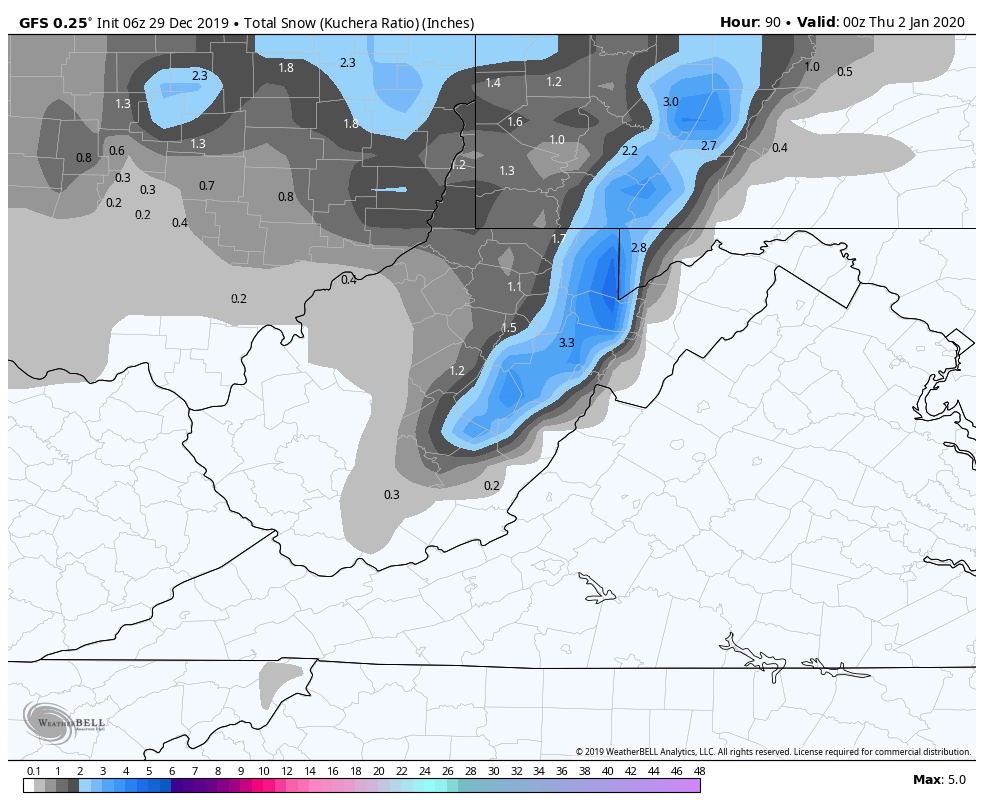
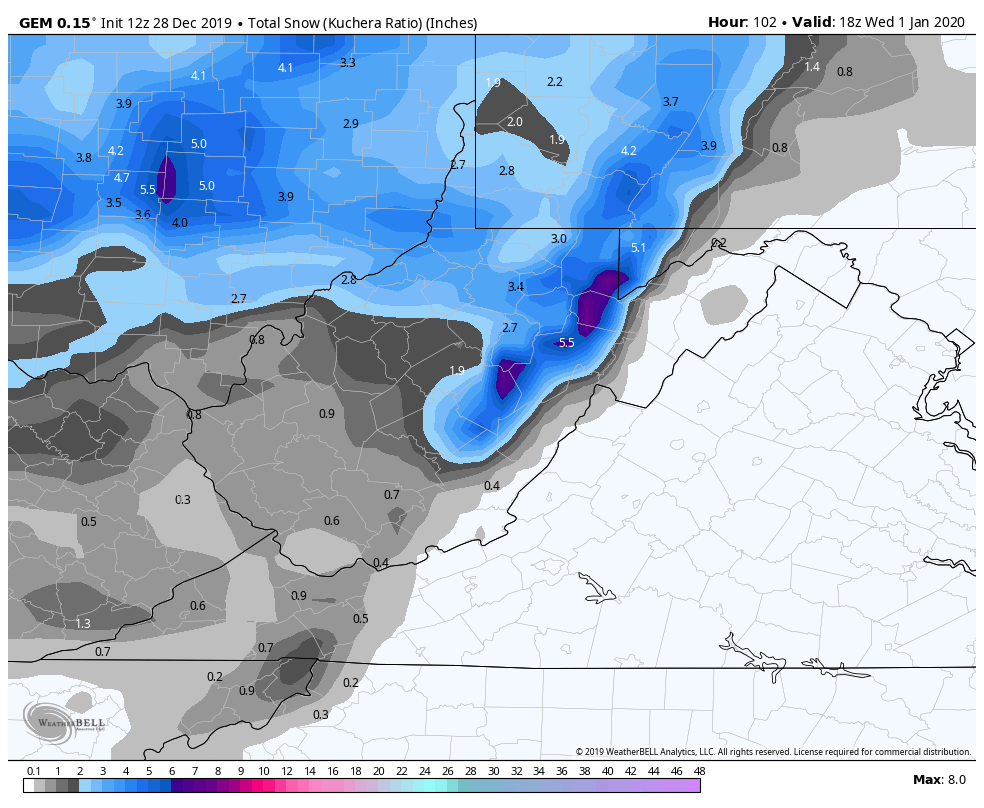
Colder air begins to ooze in later Monday and borderline temps for snowmaking late Monday night, better Tuesday night through the day Wednesday and Wednesday night before things rebound under the SW flow late week. Snowfall, the GFS has ticked down, the ECMWF ticked up, and the Canadian remains most generous Tuesday into Wednesday.
A widespread 1-3″ looks likely with up to 5″ across the Wv high ground. Tweaks to come, but likely minimal either way.
The theme has changed. From a dry air mass, tranquil, still air mass, has now seen a increase in dew points and breezy conditions and this continued into the overnight. This ate some residual valley snow that remained.
Surface features and 500mb height anomalies and flow
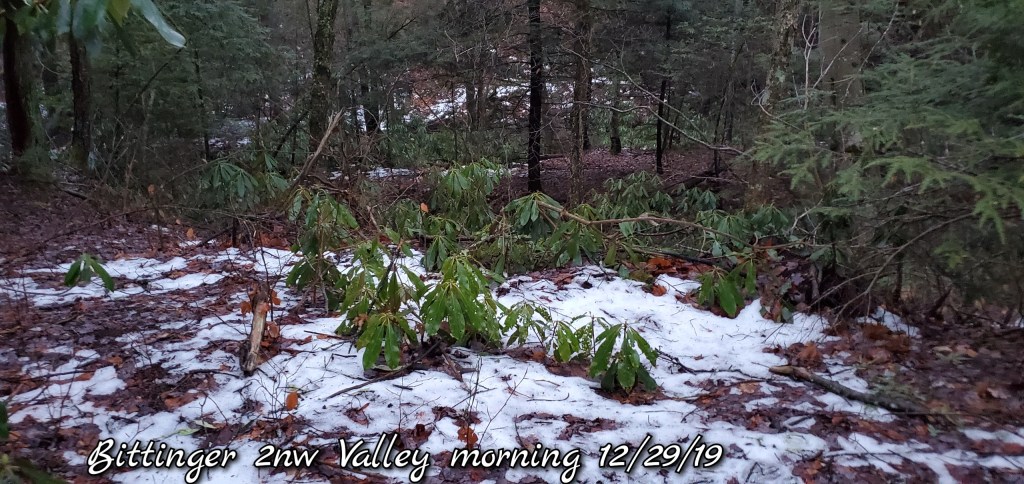
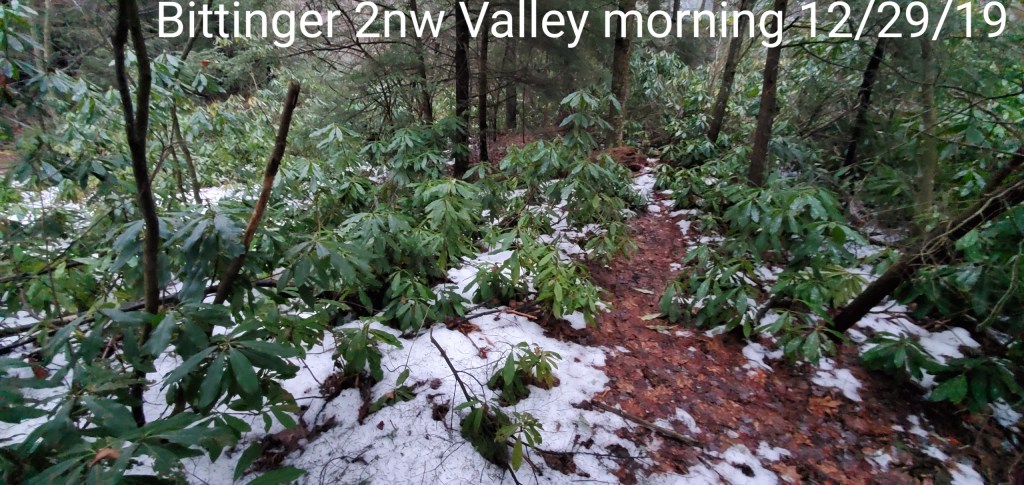
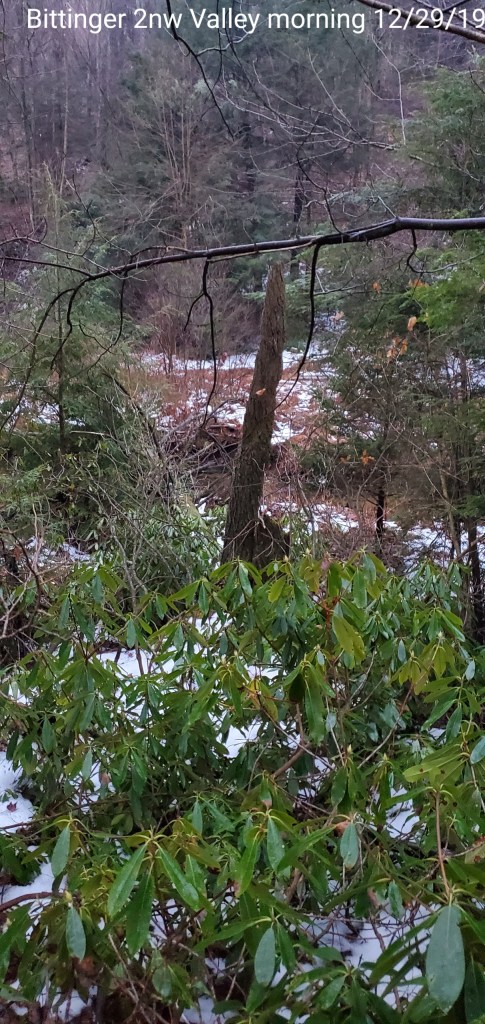
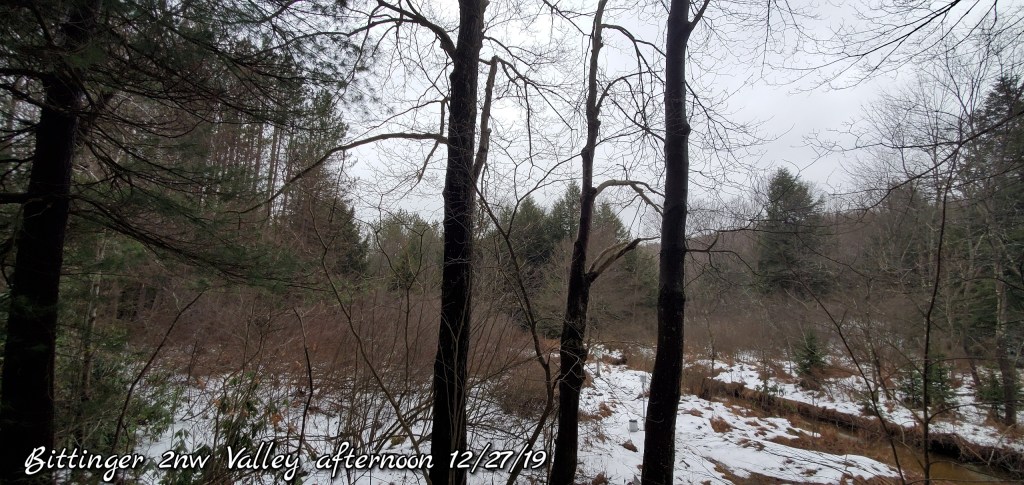
Pics today
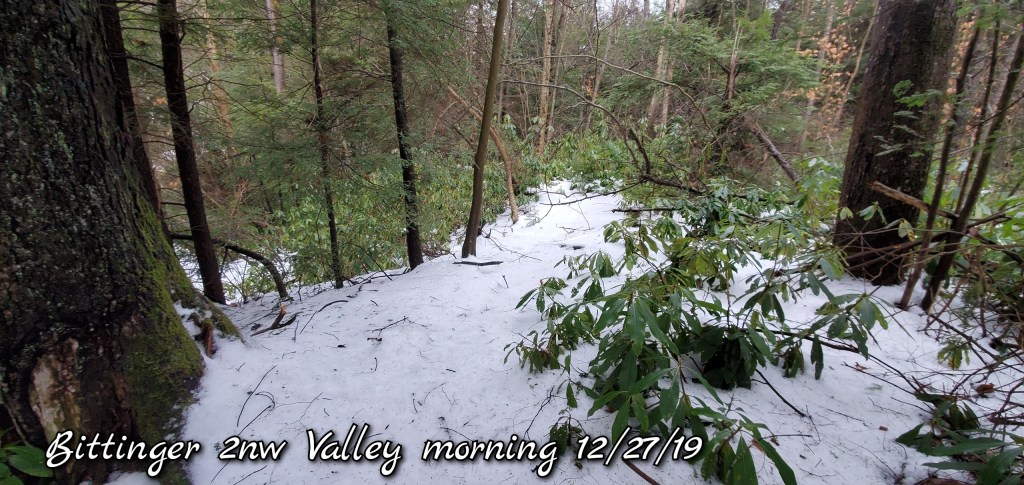
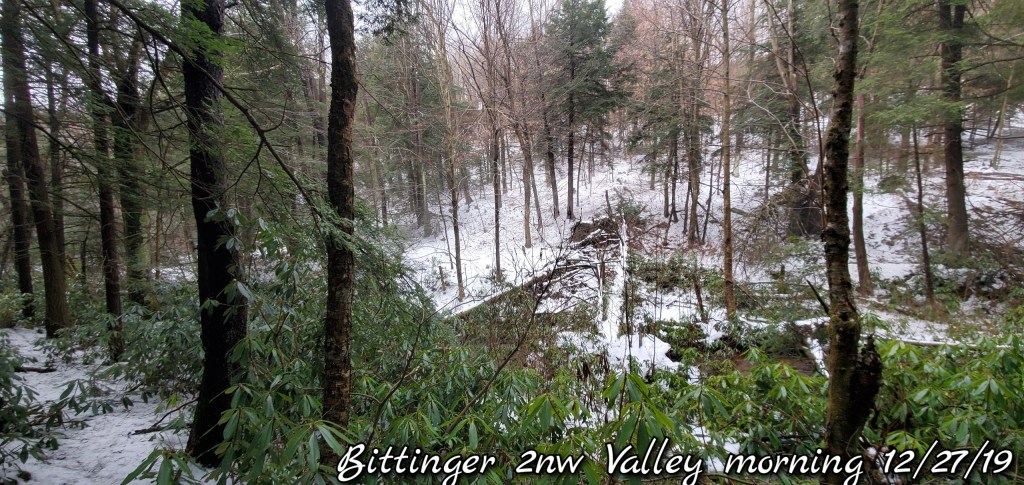
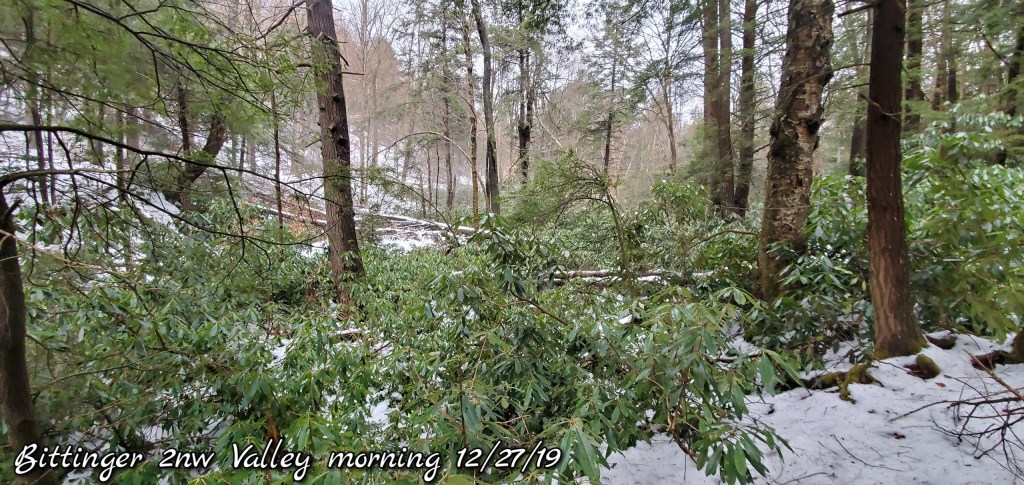
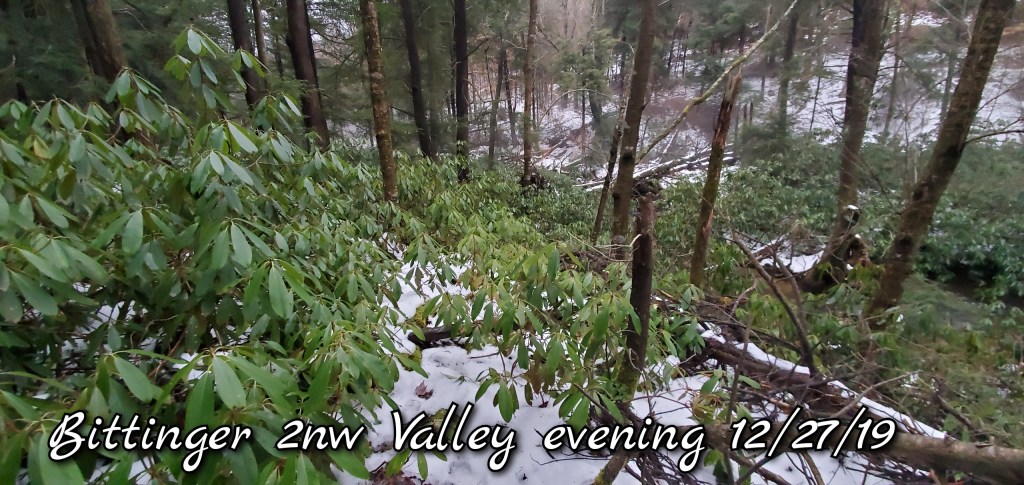
Bittinger area
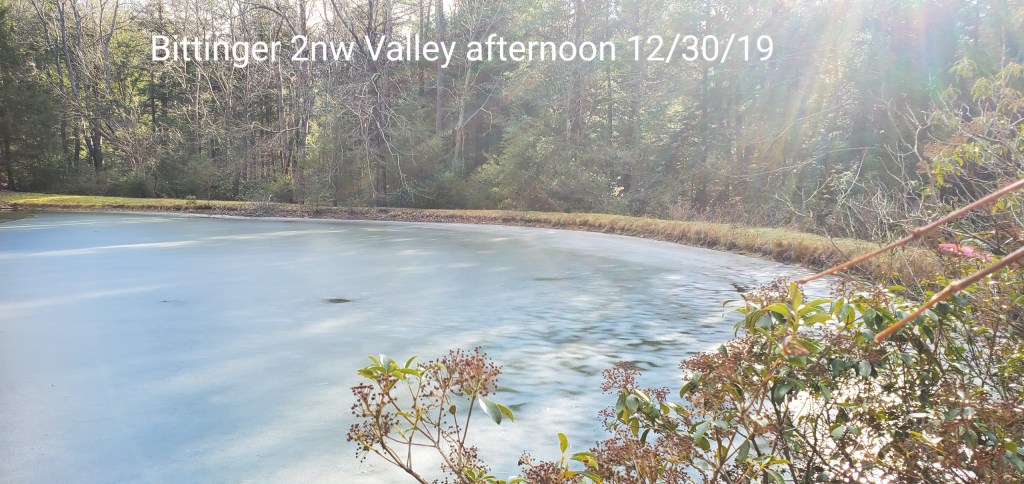
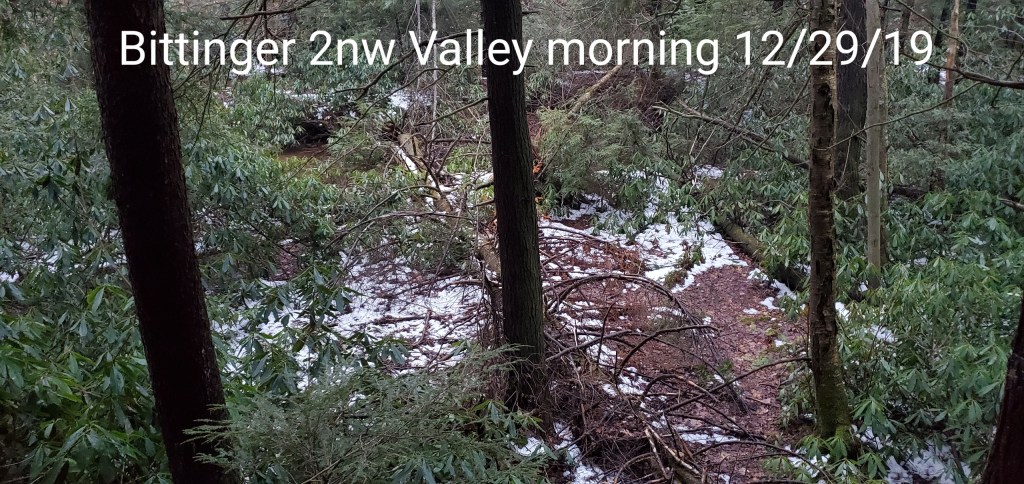
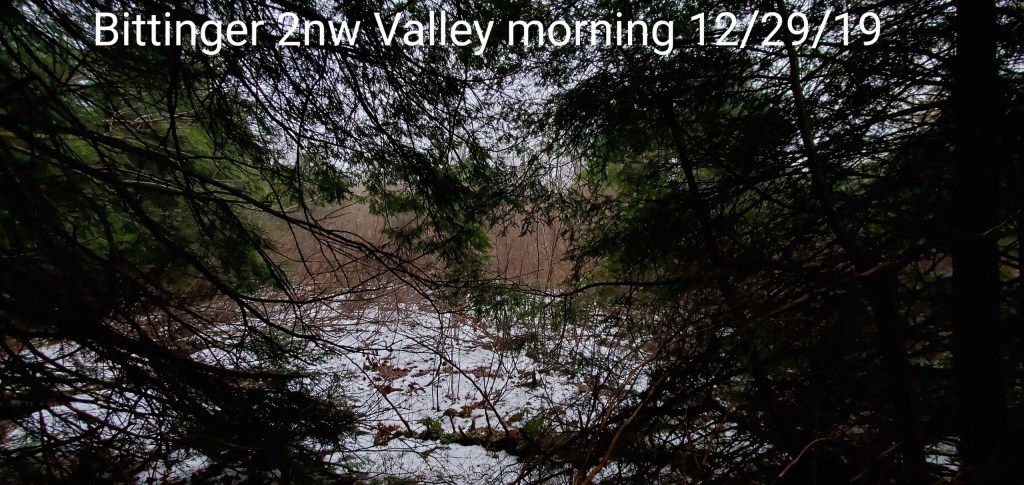
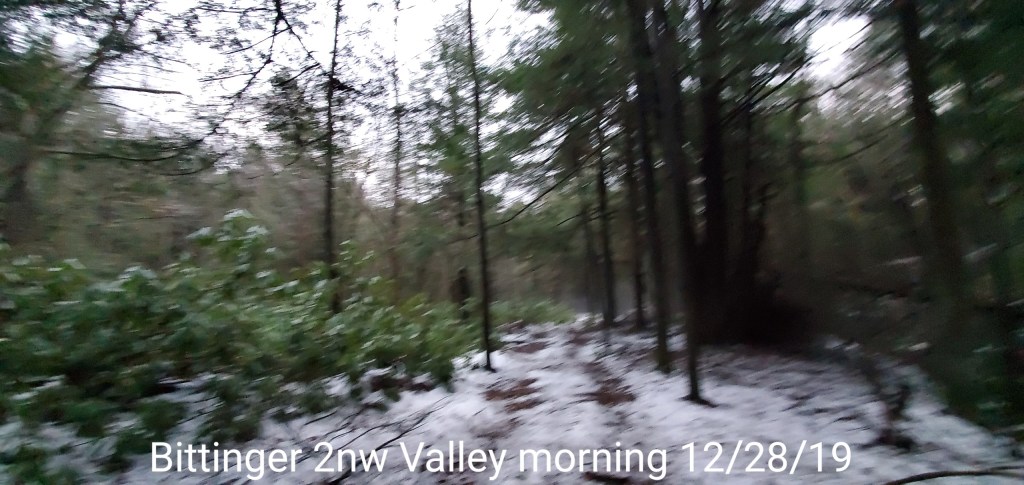
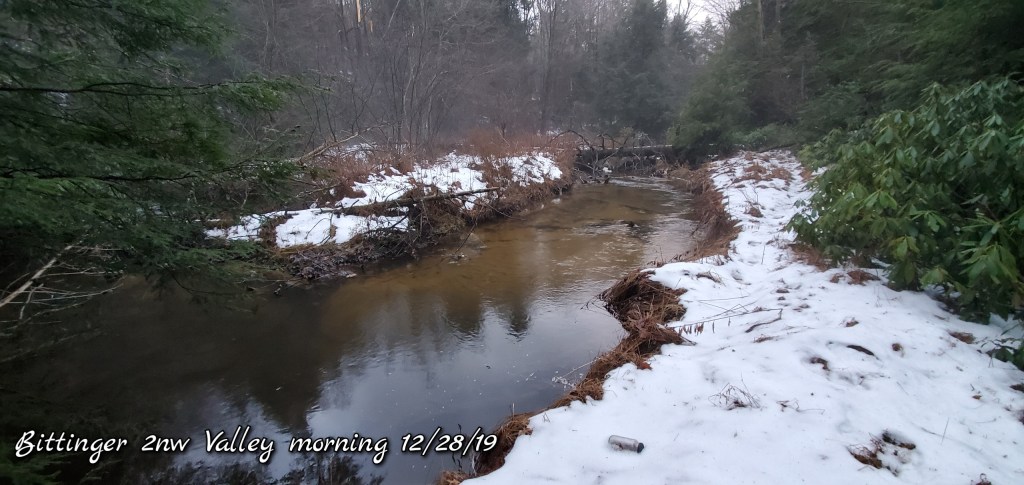
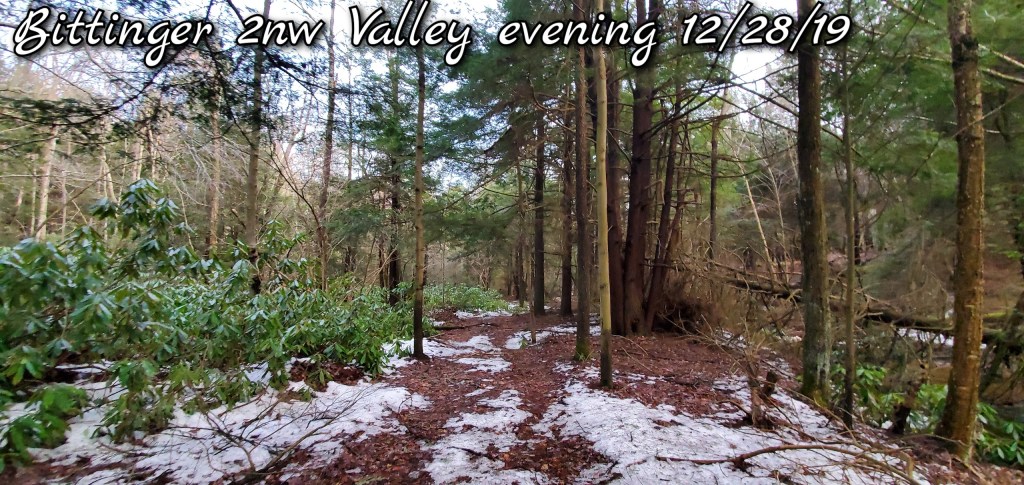
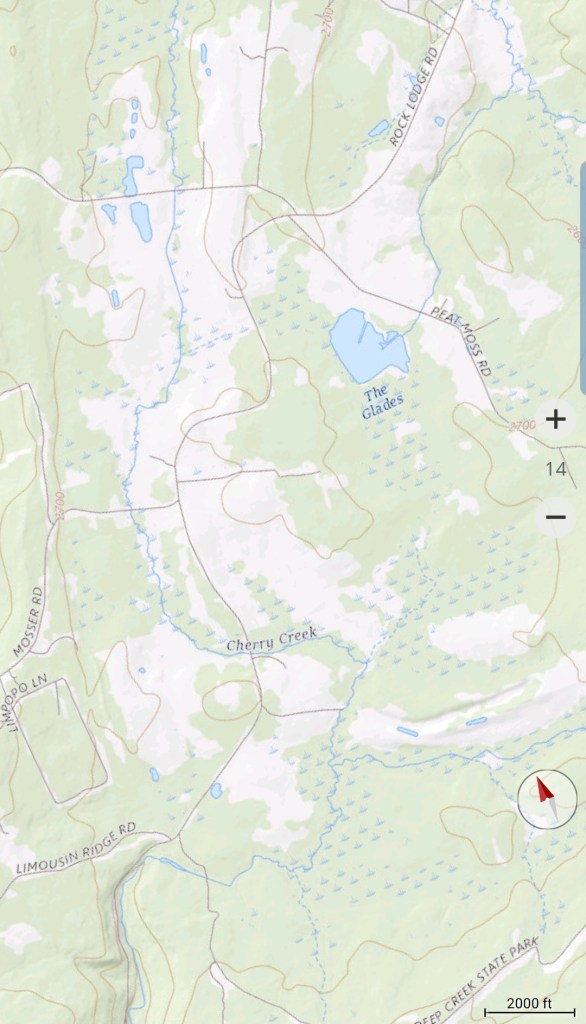
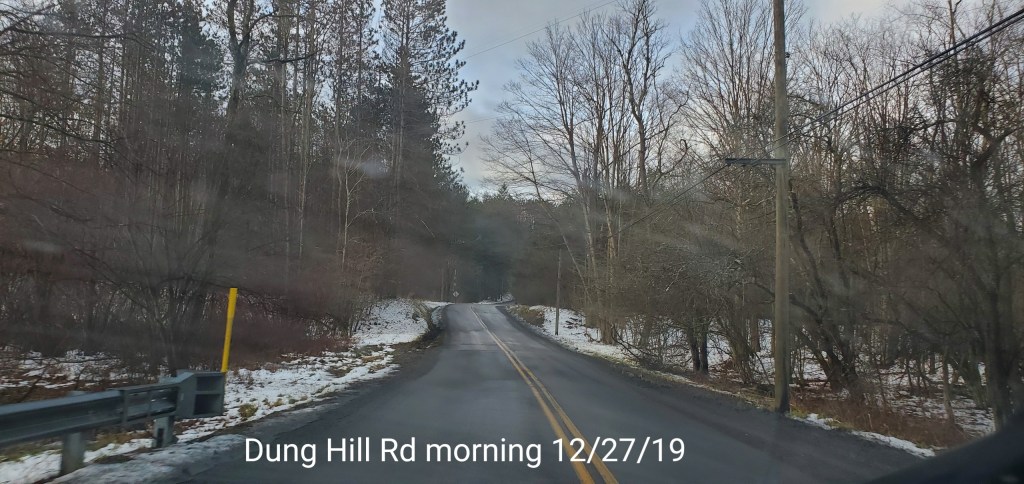
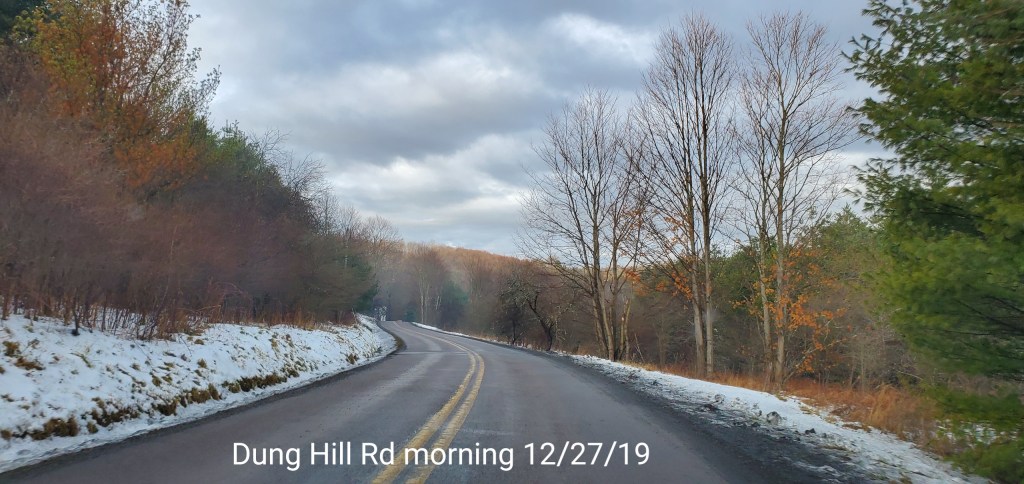
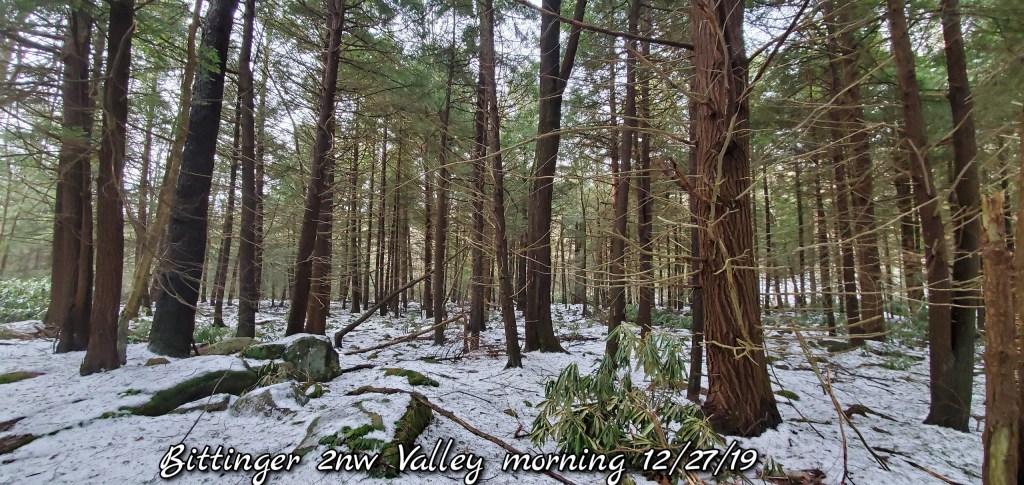
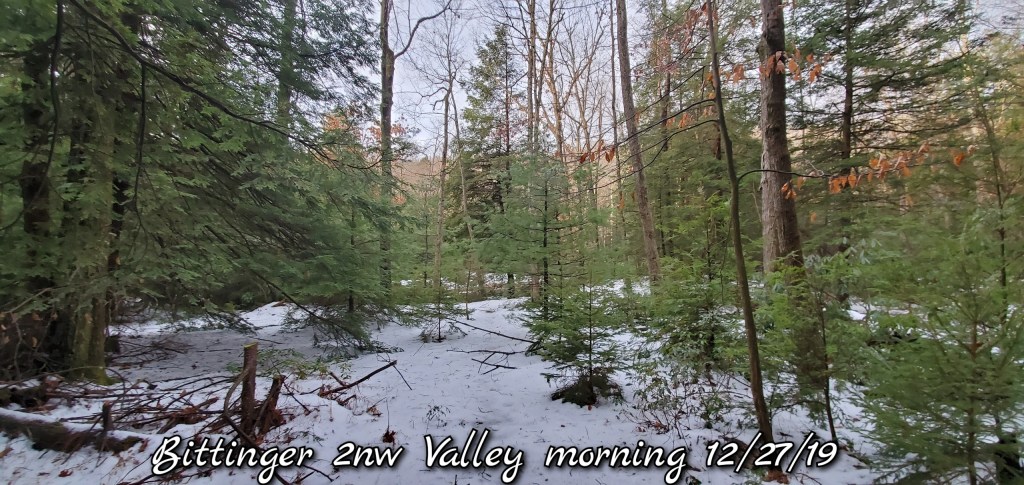
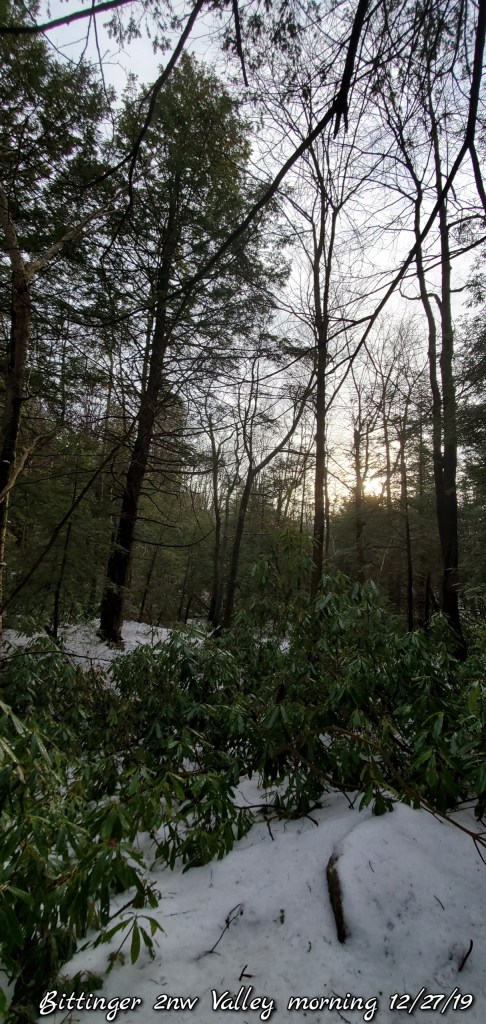
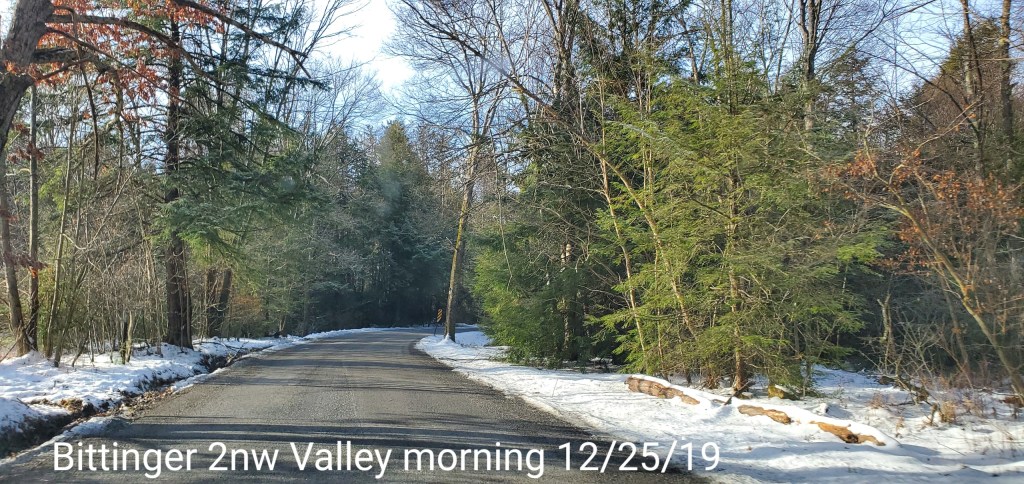
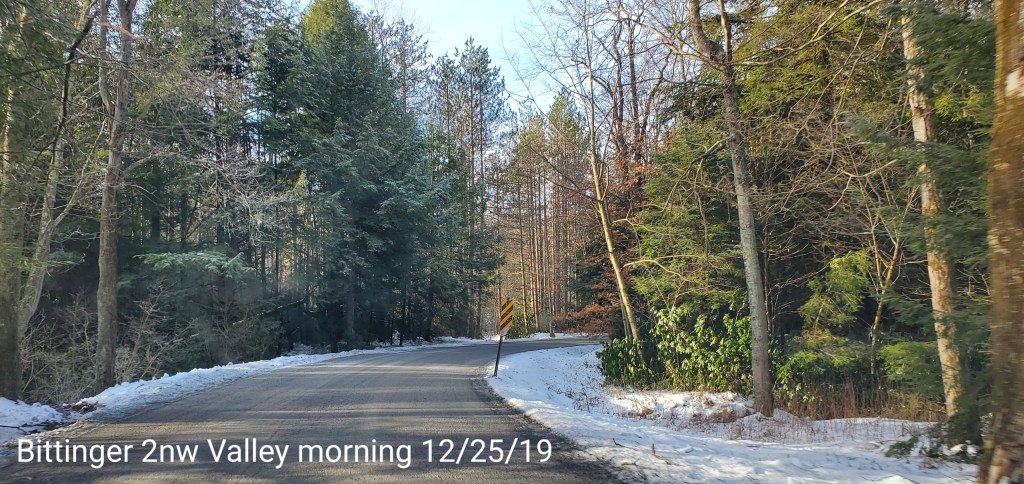
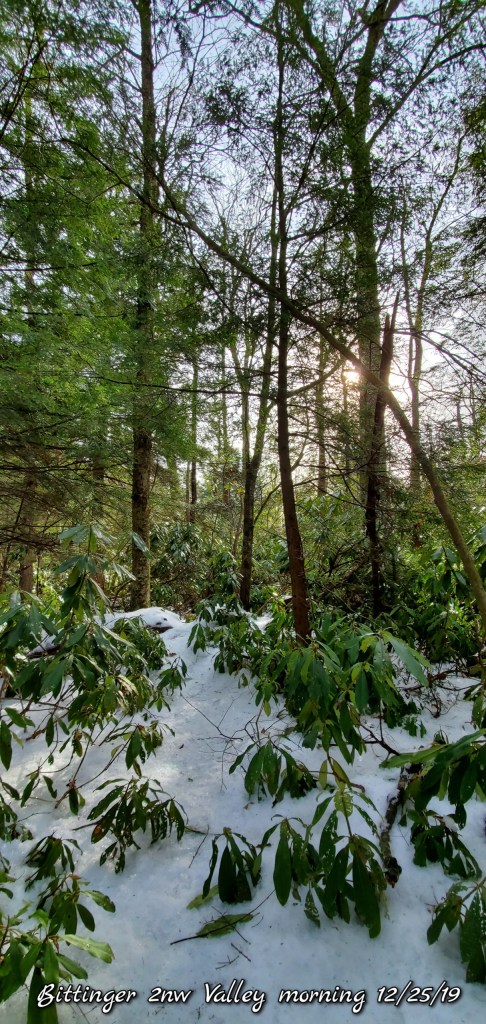
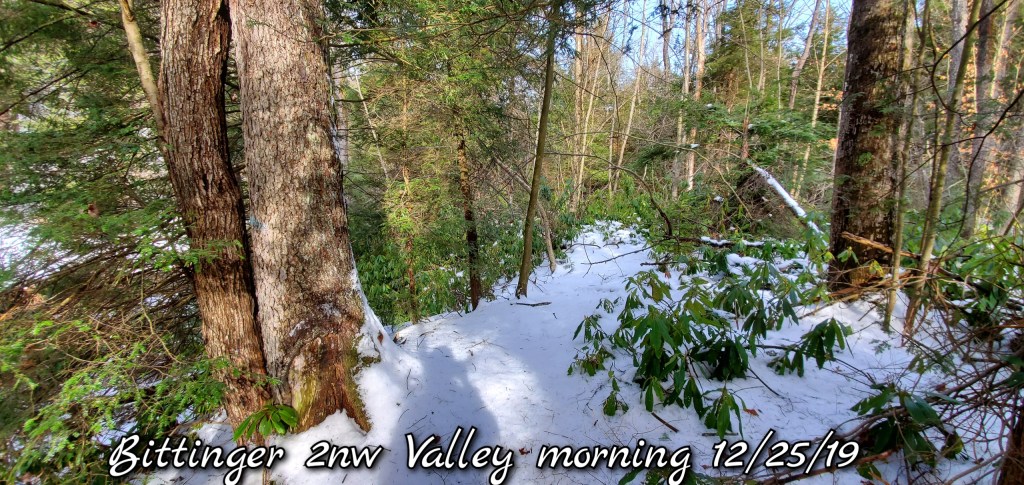
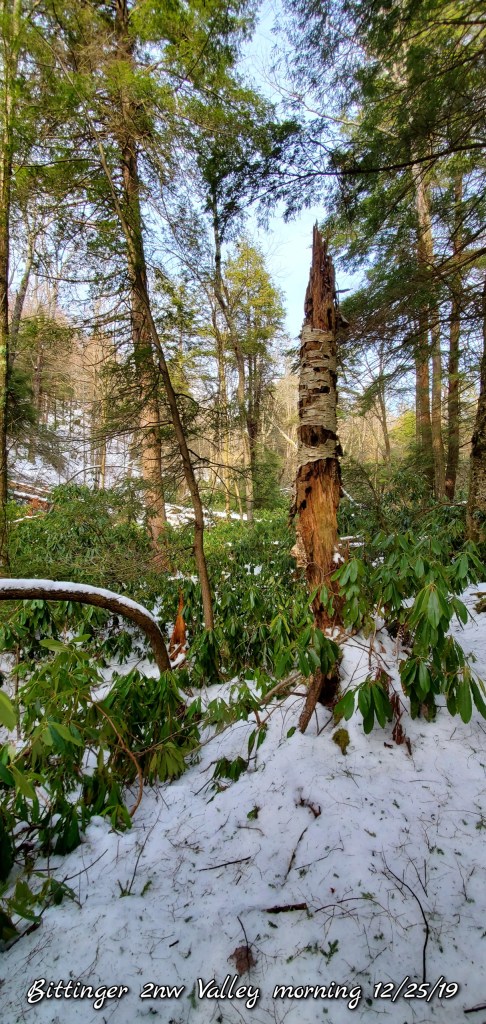
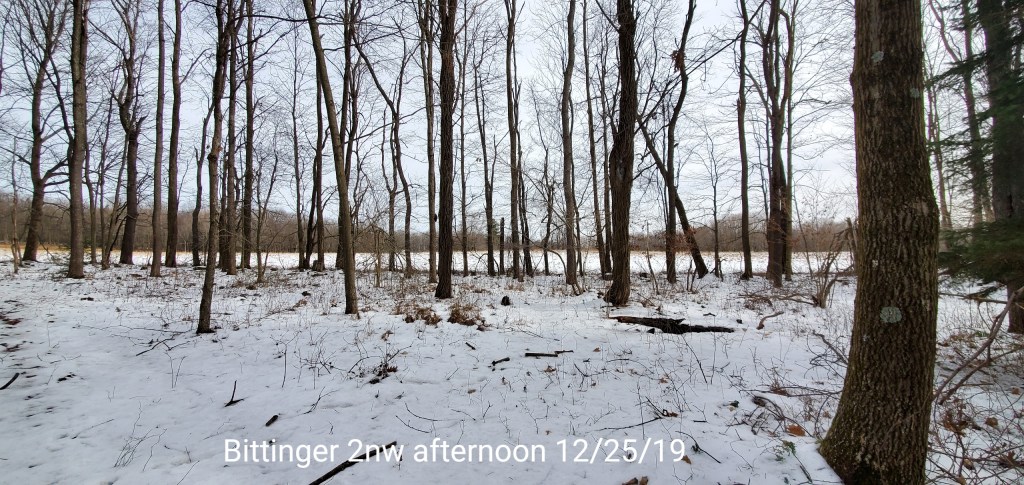
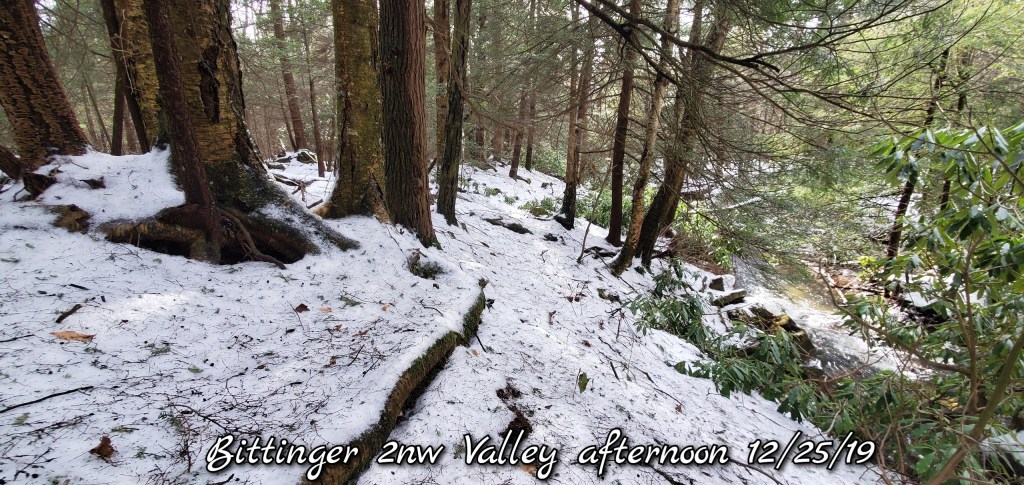
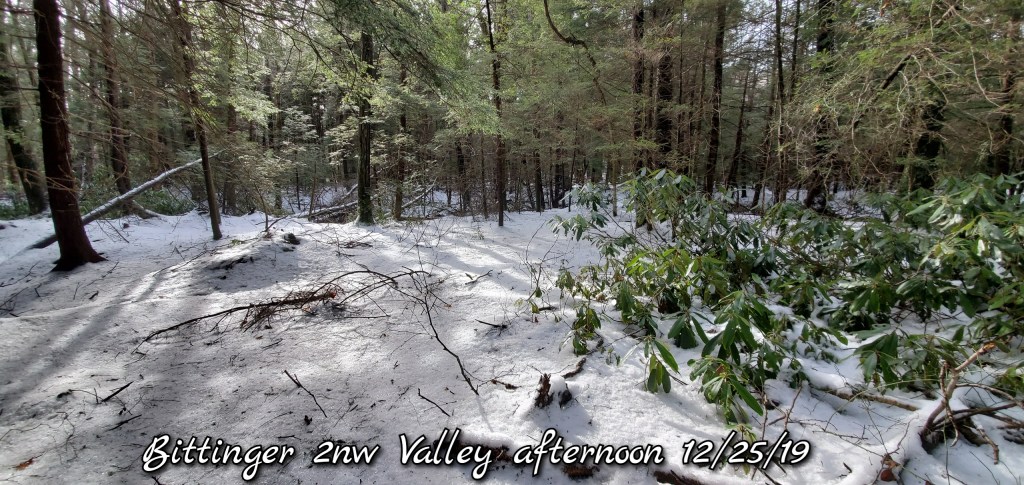
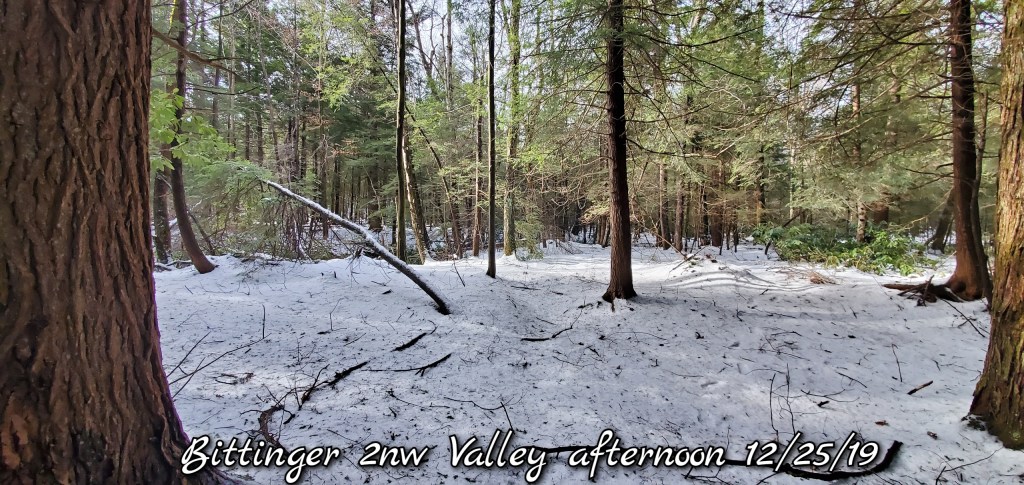
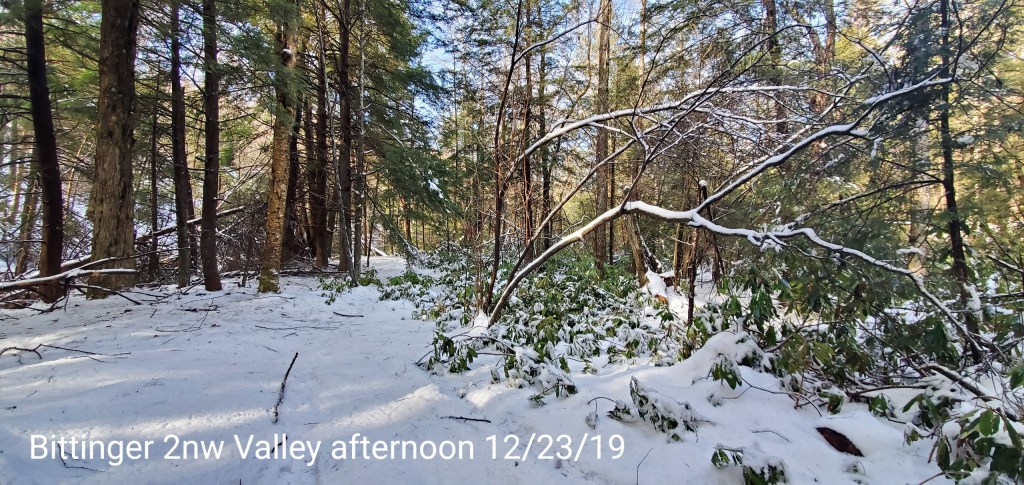
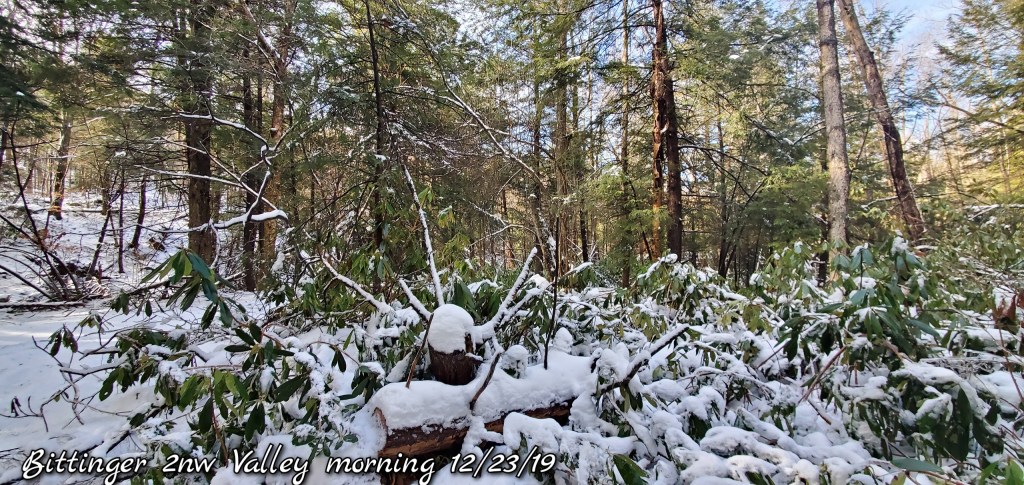
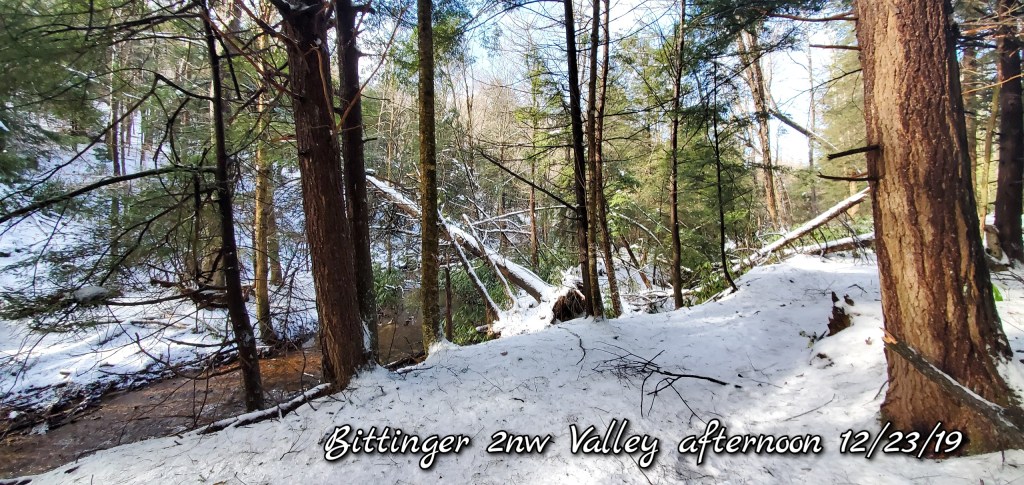
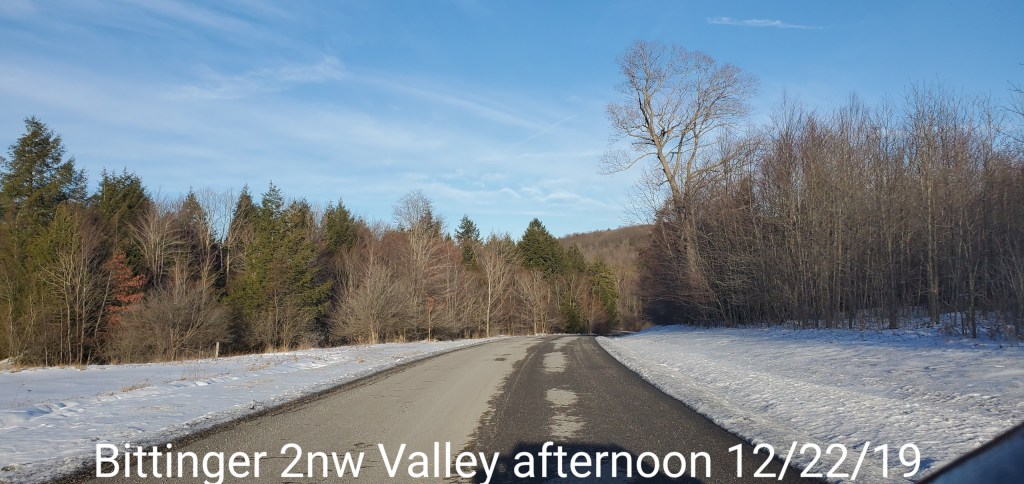
This is mainly the Bittinger 2nw Valley area with exceptions. The fascinating micro climates. Snow cover in a sheltered valley that refrigerated itself prolonging its existence well beyond surrounding areas.
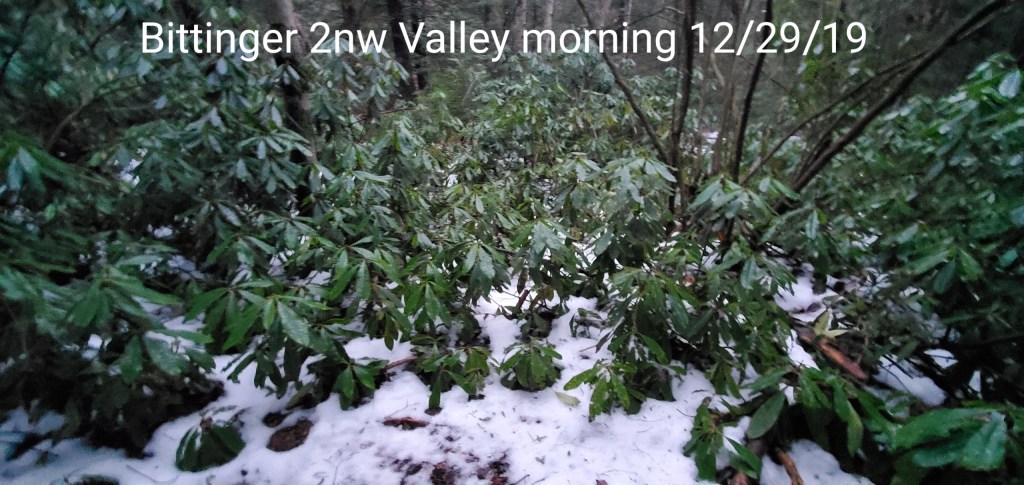
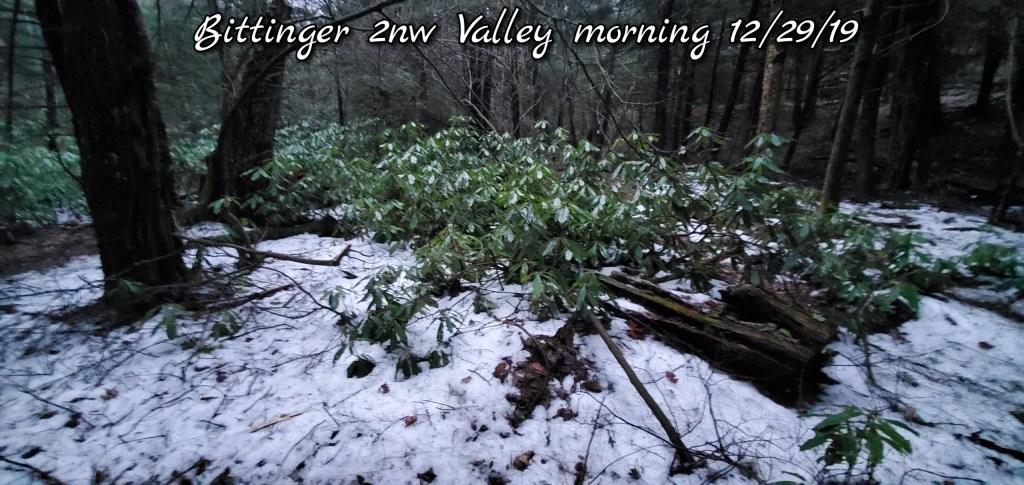
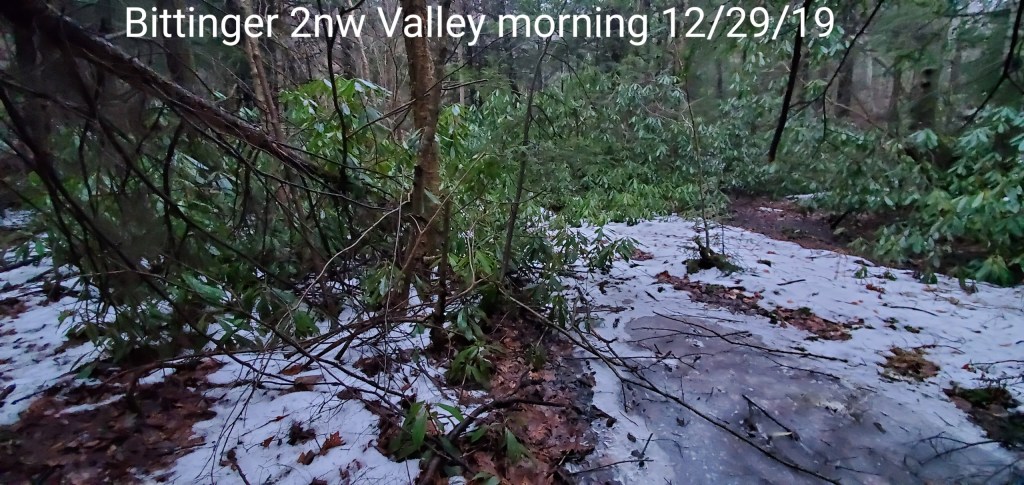
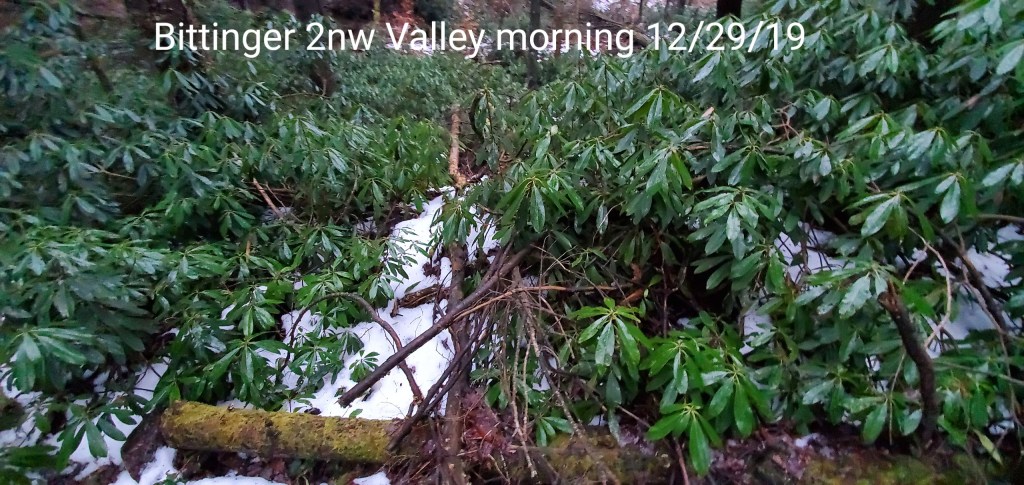
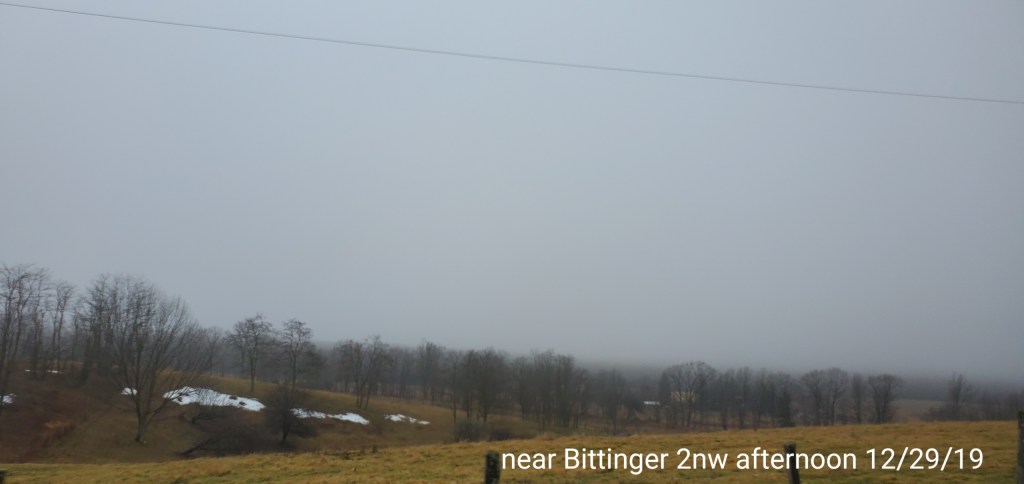
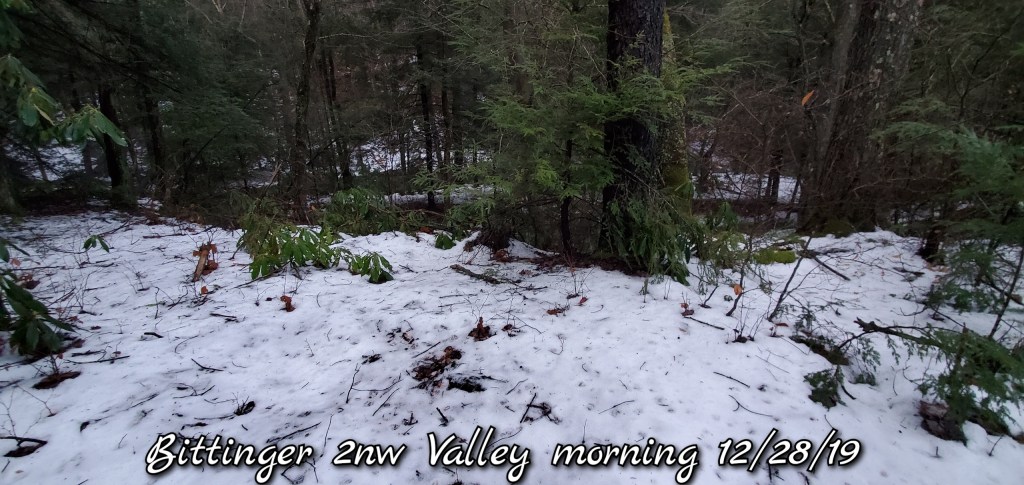
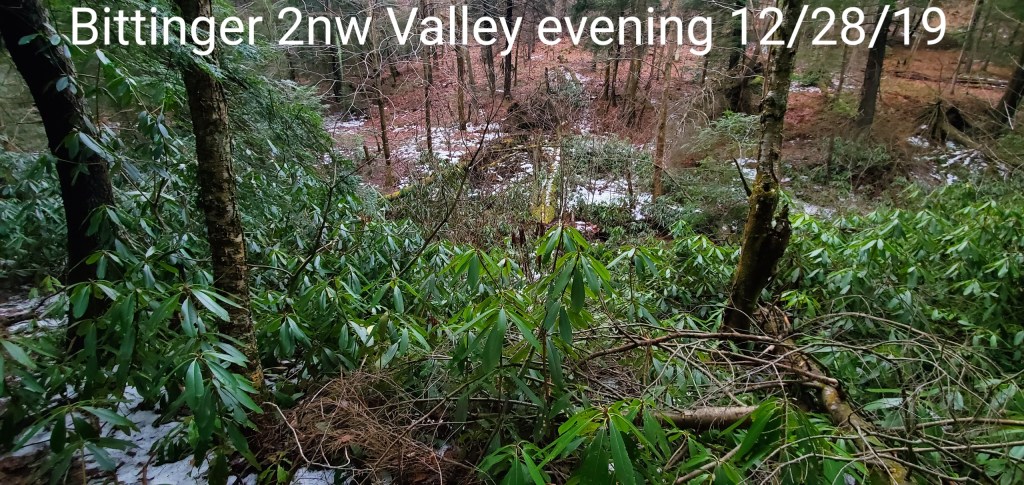
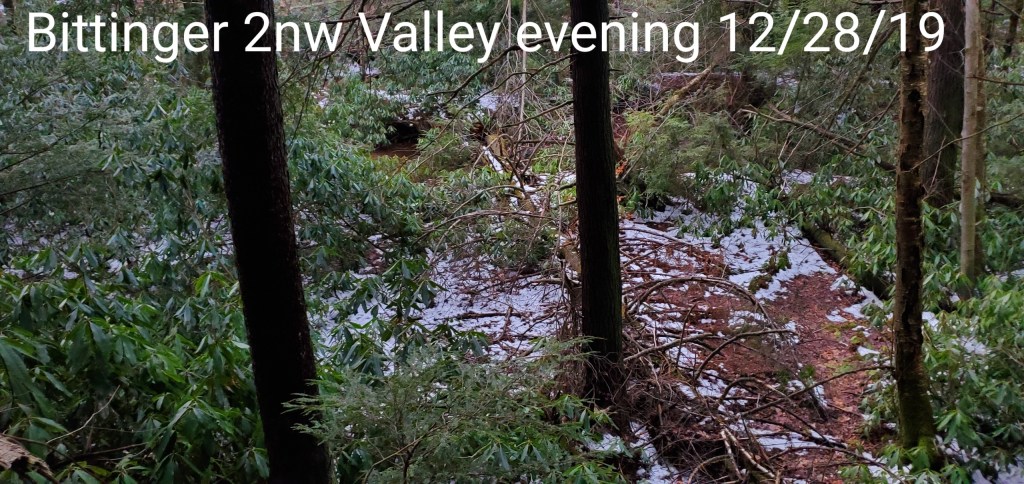
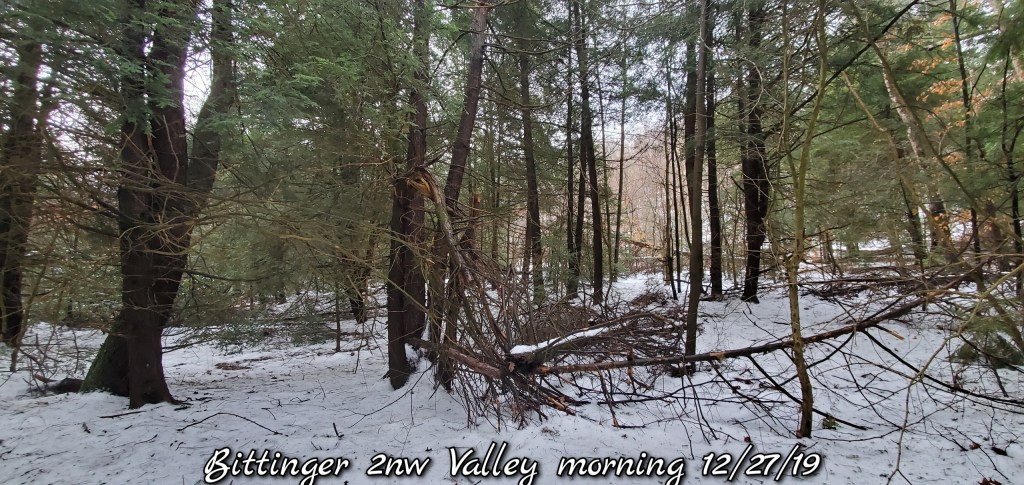
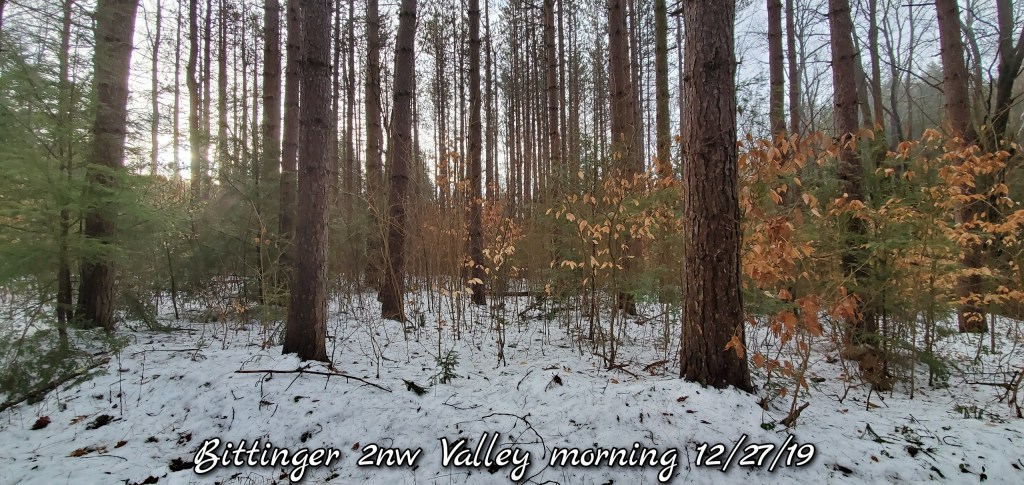
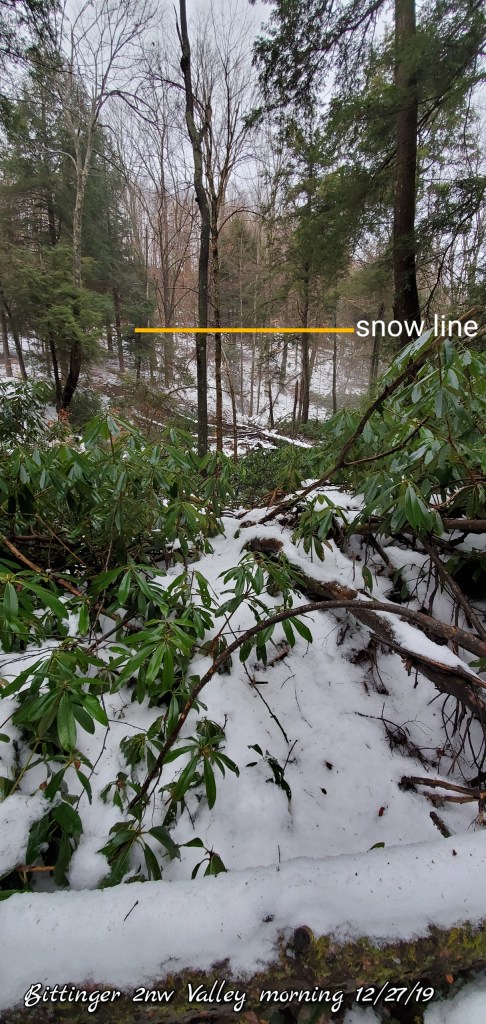
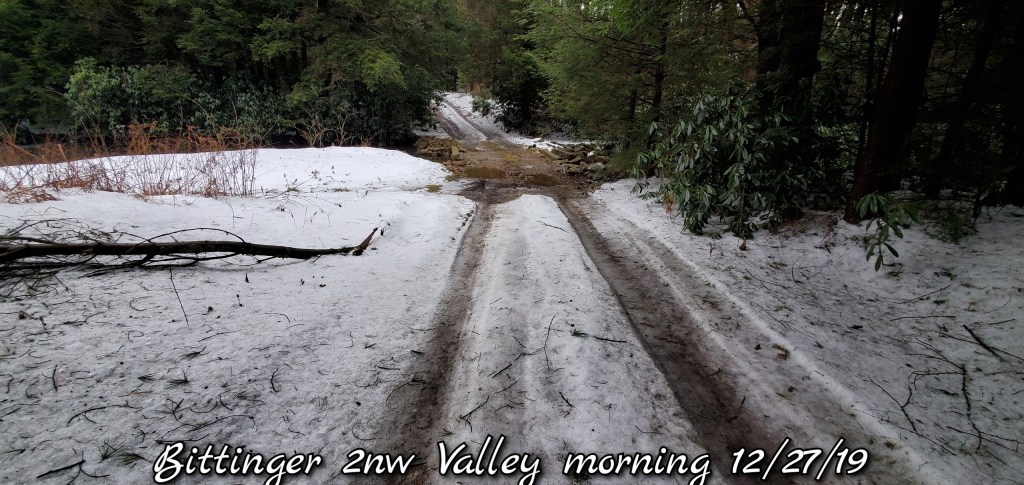
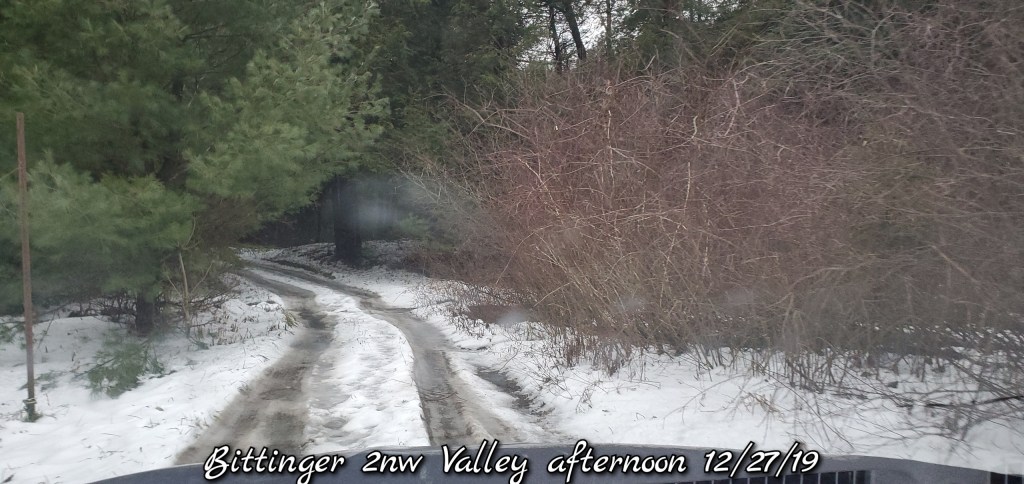
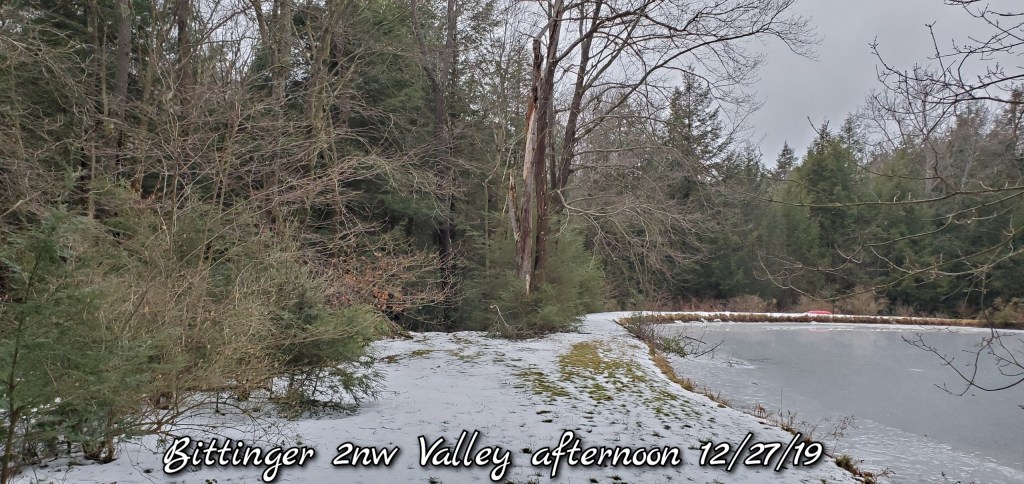
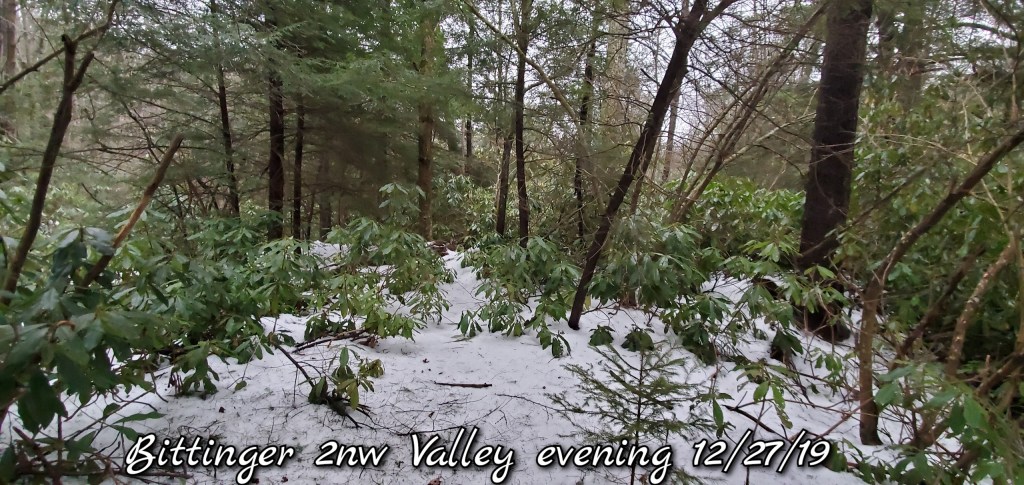
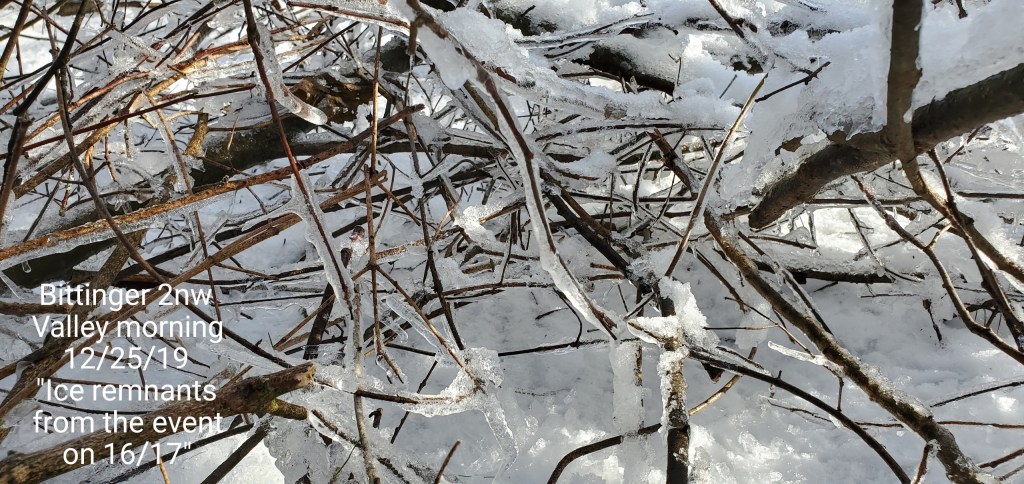
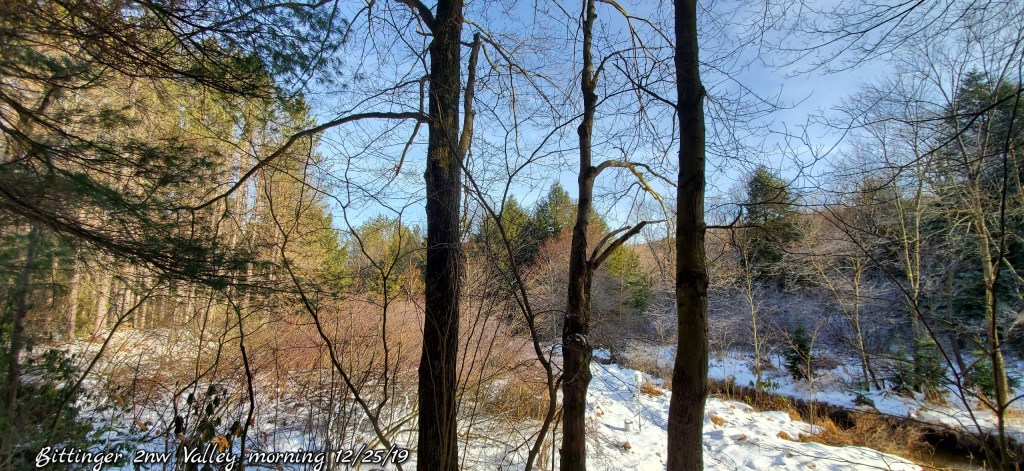
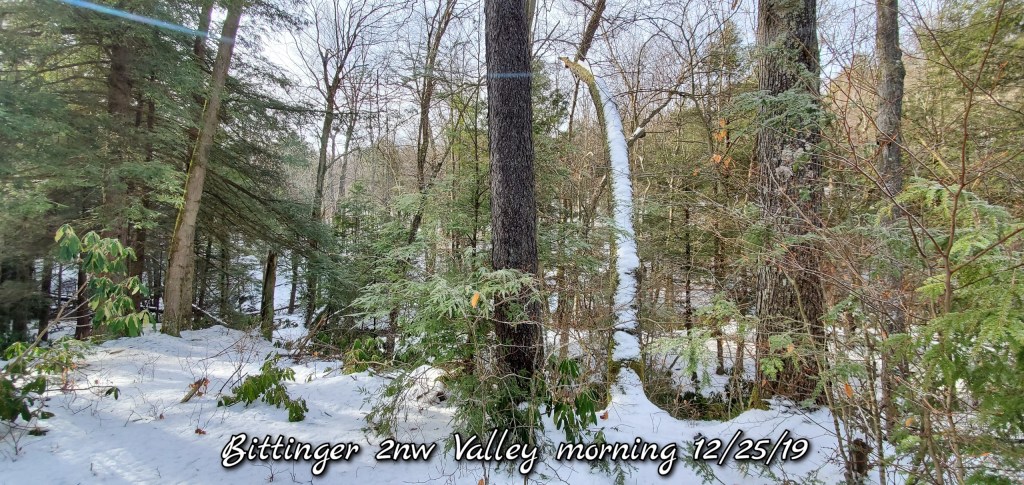
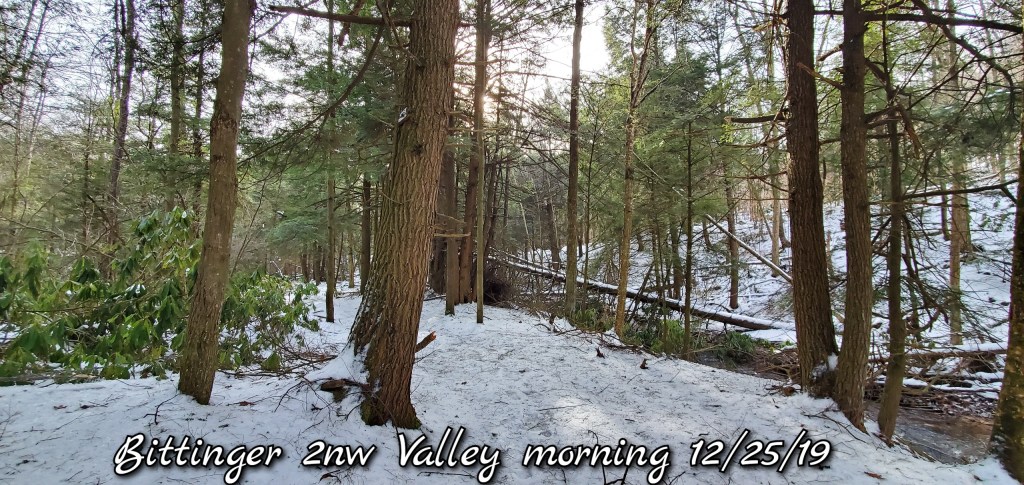
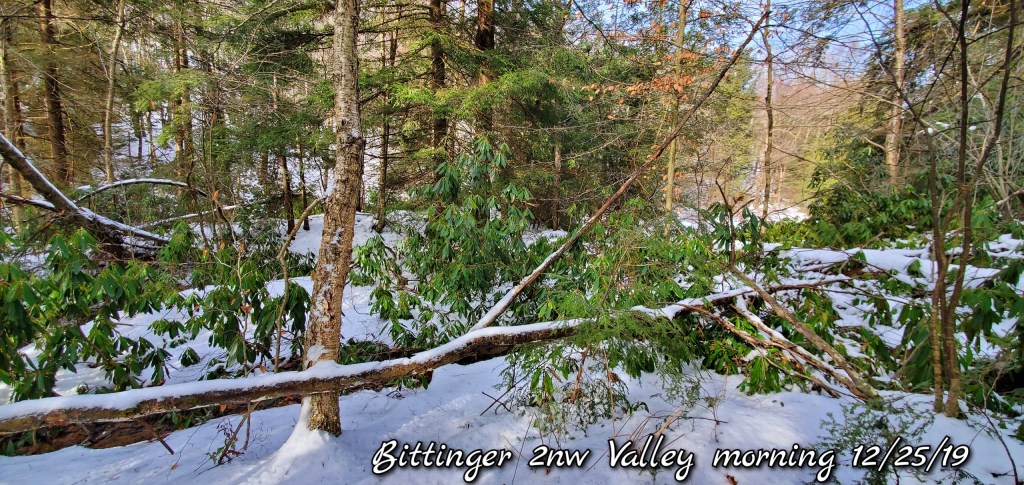
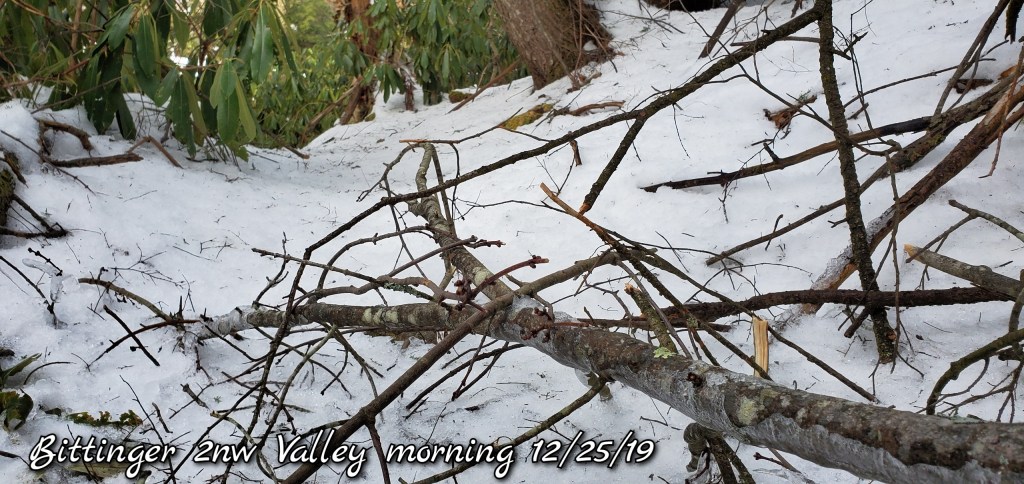
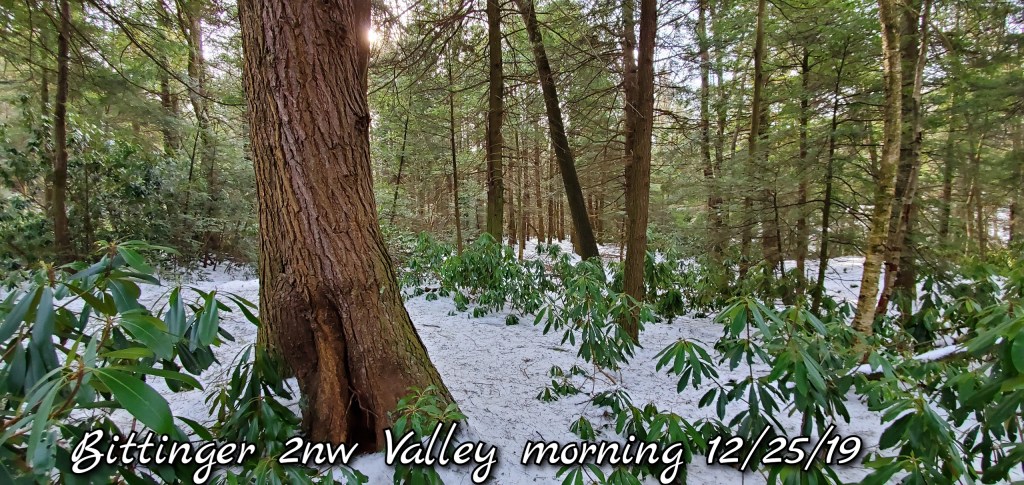
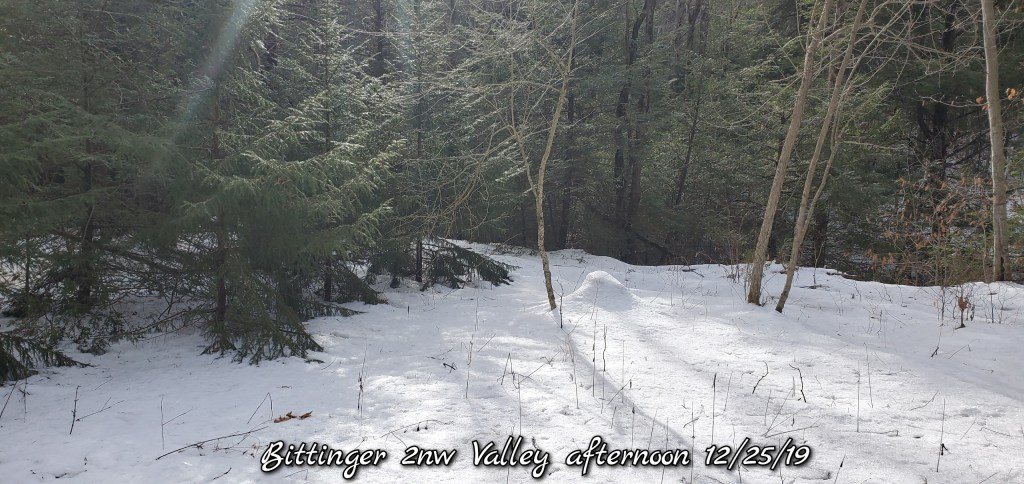
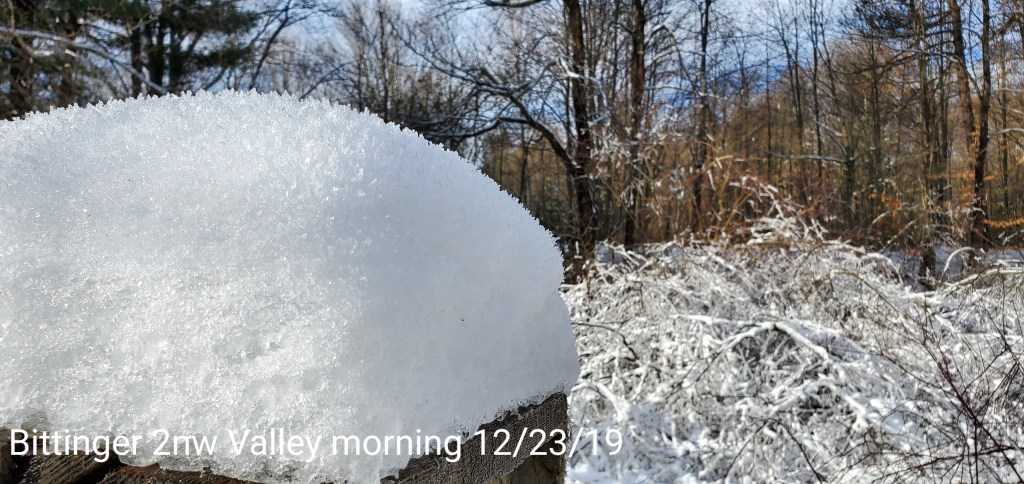
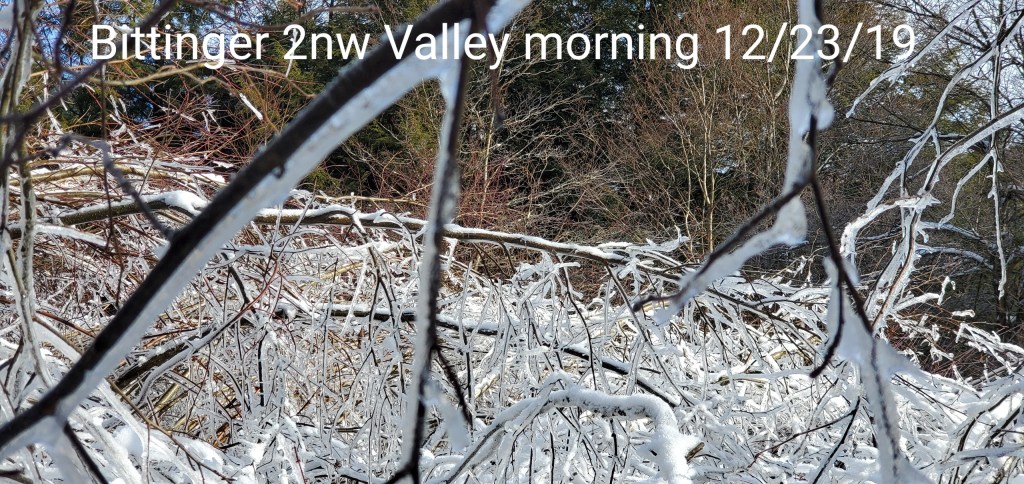
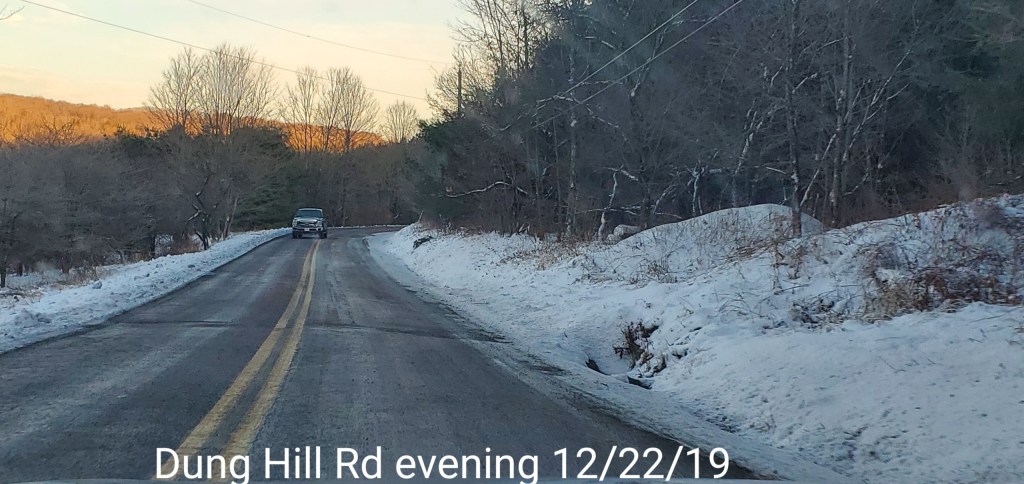
ok, timeout for the next image. A terrific example of how this works. Again, light winds are key, in which we have seen up until this afternoon. Low dewpoints also aid in snow preservation, which was the case up until this afternoon. So picture a 50° dry airmass, low sun angle. It doesn’t melt snow fast. A steep hillside, covered in snow. No wind to scour away the cold coming off the snowpack sinking to the lowest point, in this case the Valley bottom. The temps up high do melt the snow slowly, while the Valley sees little to no melt with the low dewpoints. As dewpoints increase, the cold air still sinks to the Valley as cold air does, however it’s less successful in preserving it’s own pack. Temps however remain much colder than up higher. As the pack leaves up high, and melts off, the snow line works it’s way down the hillside. The cold air to come off the pack becomes less and less, the Valley still holds cooler, but less so and with dewpoints and lights winds in play, the effect becomes less and less and the Valley begins to melt off. Which was the case, especially after nightfall when the winds held up. Here is a pic that is a great example of this
Above that line, snow is now gone, below, it’s still chilling itself. Less successful with higher dewpoints and light winds, but still to a point works the same.
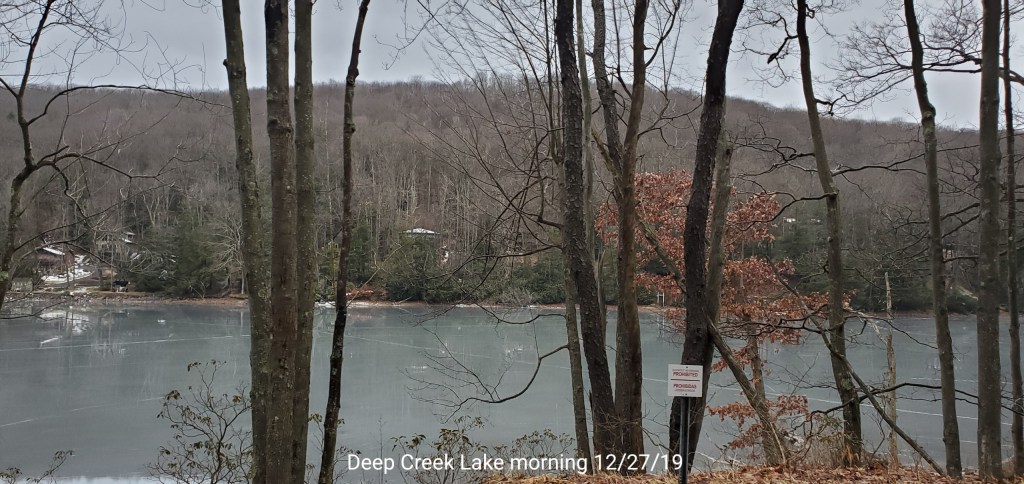
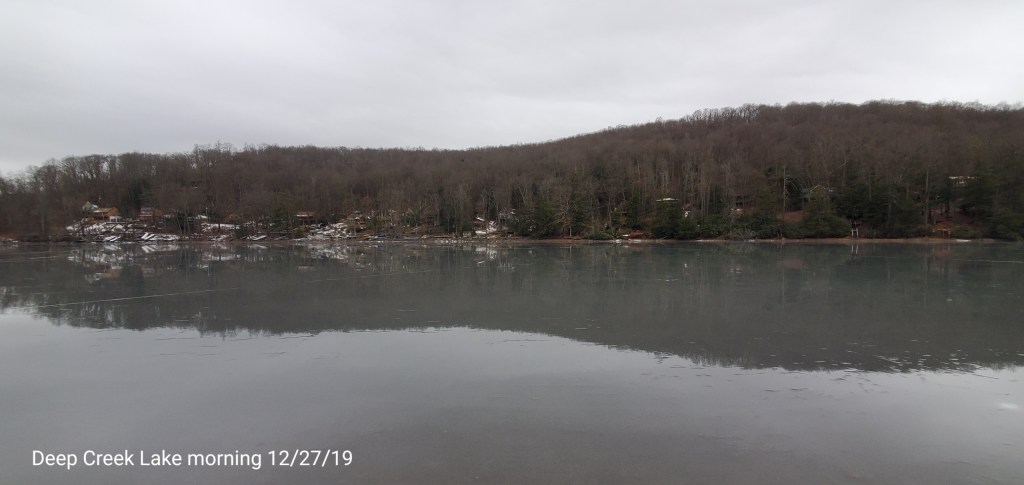
Deep Creek Lake area
Winter where art thou???
The continuation of the SW flow aloft has put a halt on winter across the high ground. Over the next few weeks, the hope’s of sustained winter look bleak. What is beyond that period is anyone’s guess. If history is the example, January may have little in the way of sustained winter. With a large pool of very warm water off the southeast coast, into the gulf, the dreaded 500mb ridge sits in place like a giant. At times it gets attacked, weakens, but feeds back and builds over those warm waters. This causes a storm track to our west, in some instances far enough west the rain even misses to the west and other instances we get the rain to snow scenario. A few in the area, mainly north in Garrett, and north and east into the lower elevations, some cold air can be left in tack from departing cold to allow for some ice. Upcoming, that doesn’t look to be the case without cold highs to our north.
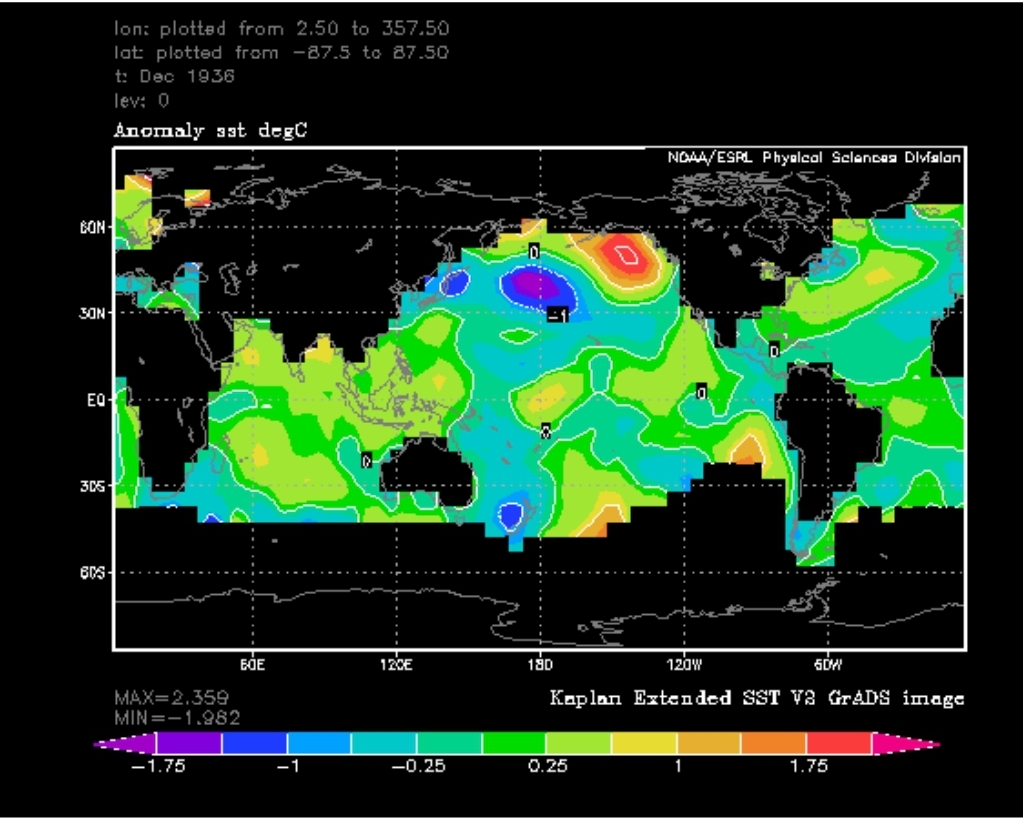
Of late, the low elevations have been colder than the high ground. While many think this is unheard of, it is not at all uncommon in this pattern. It’s in fact, typical when this pattern occurs. Just to pull out one year as an example that had a very similar setup, December 1936. The SST(sea surface temperature) anomalies had a pattern very like this current December. Let’s look at that
1936 Reanalysis
Current SST anomaly
The color scale/scheme is not the same, but the large warm pool that everyone loves in the northeast Pacific(those who love cold in the eastern U.S, is that everyone?)to pump the ridge into Alaska and the western U.S and dig the trough in the east exist. Warmth extending from southern California, Mexico westward. A resemblance of a weak modoki nino. Cold waters east of Australia. A bit of a cool pool east of Hawaii. Those things alone in the Pacific look great. The caveat, the waters off northern California, into Oregon, nearly identical . Only my opinion, that allows the lows to get cutoff, and our big blocking southeast ridge sends these systems west. With allow brief hits of cold that follow behind.
A look at the December 1936 temps
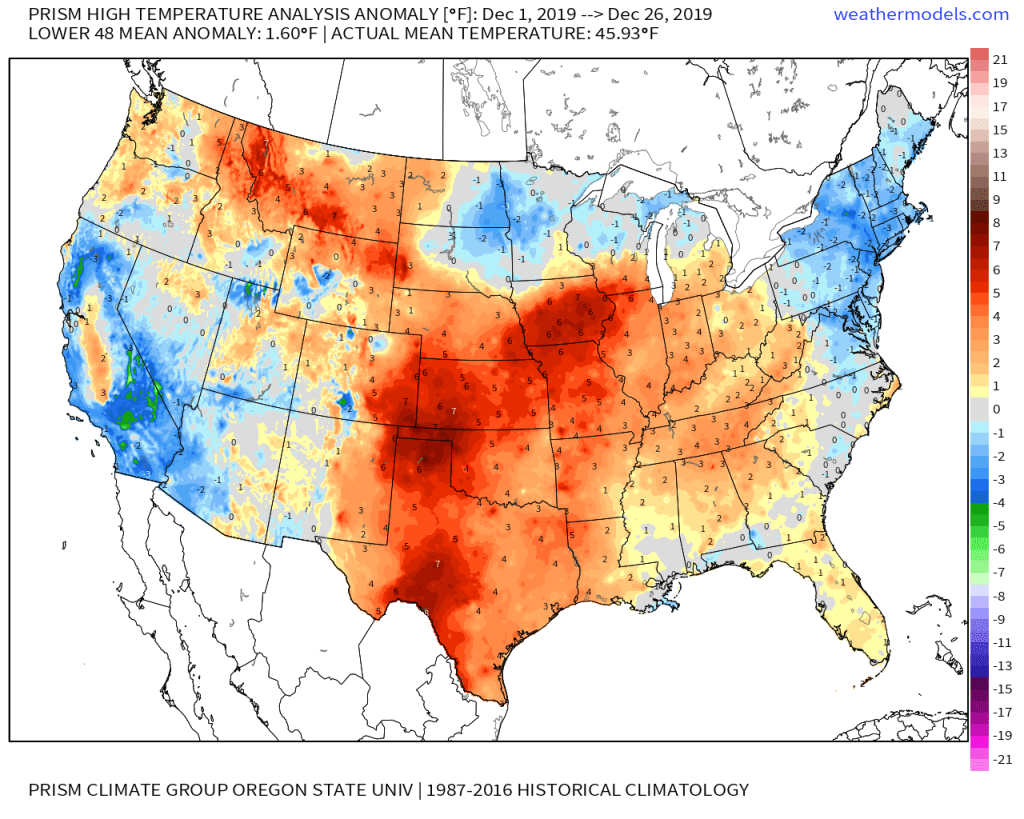
This December to date
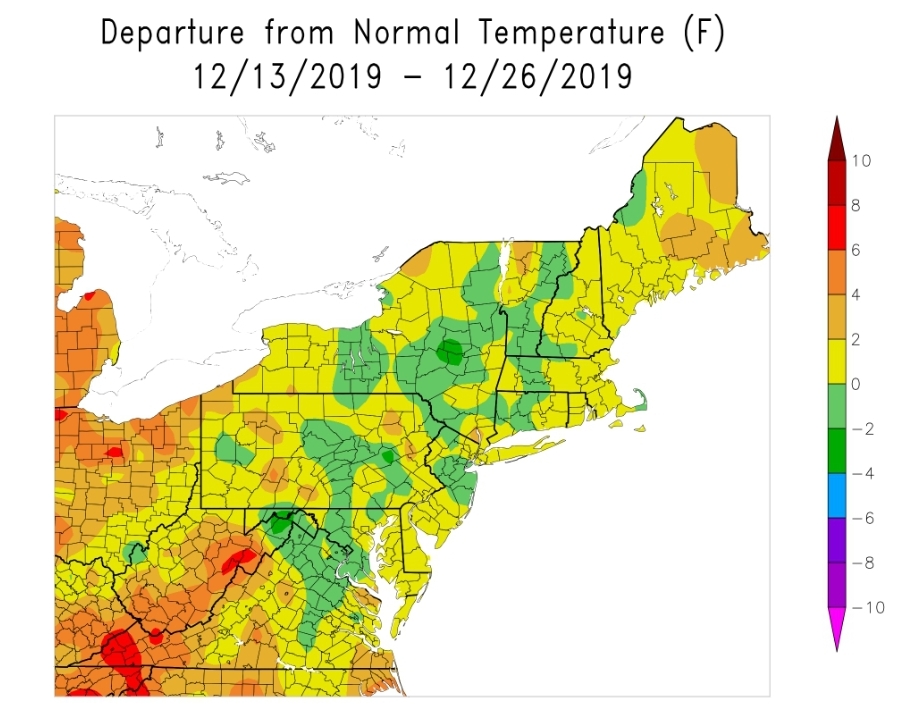
Holy smokes, a few minor variations, but that’s a lot alike. We have the colder air on the east side of the mts then, in a similar setup. Let’s look at the last 2 weeks,
For those in the Wv high ground, it’s hard to imagine some areas the past 2 weeks in the region have seen below normal temps.
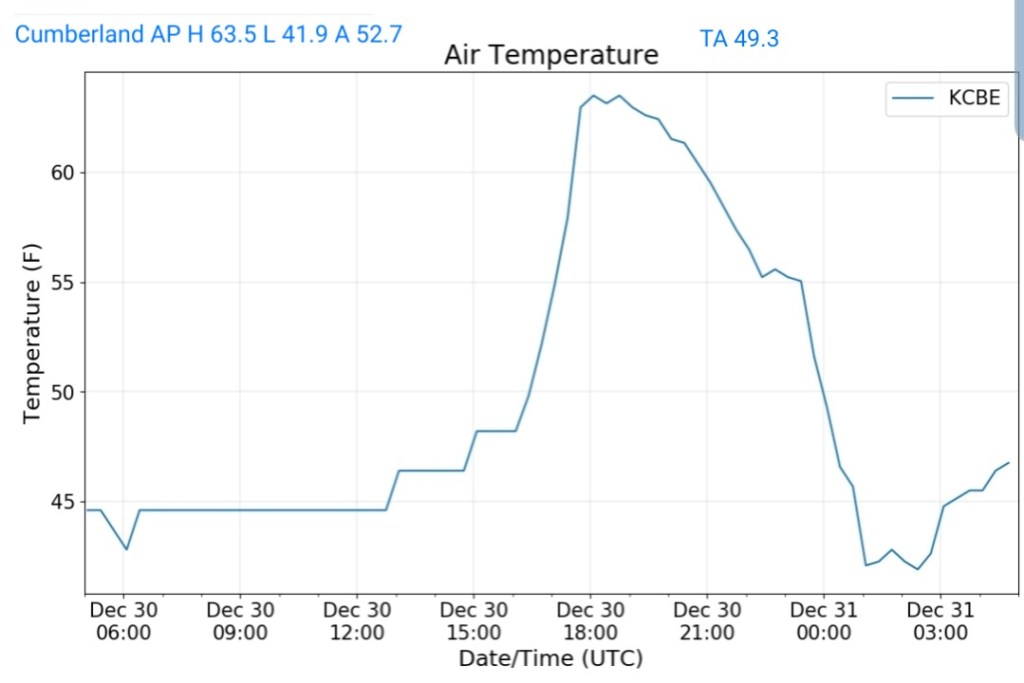
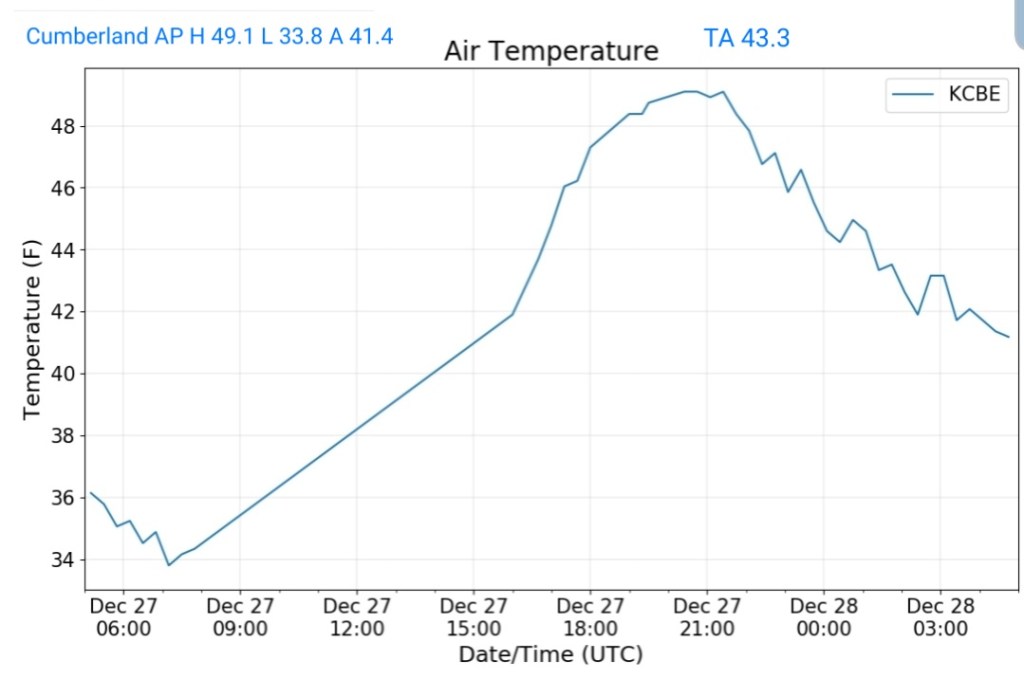
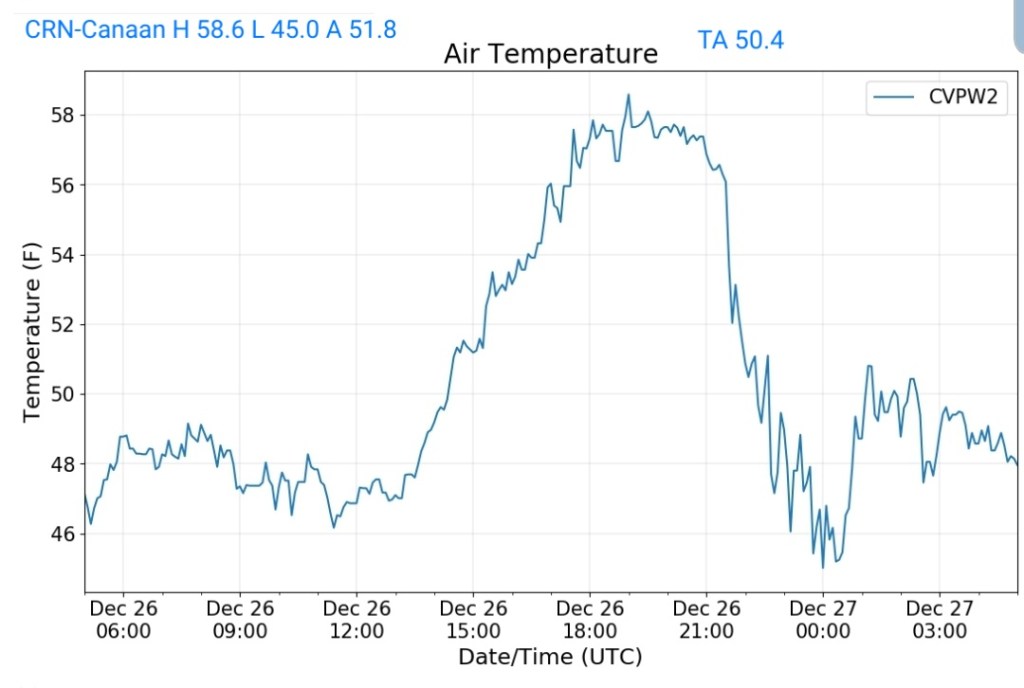
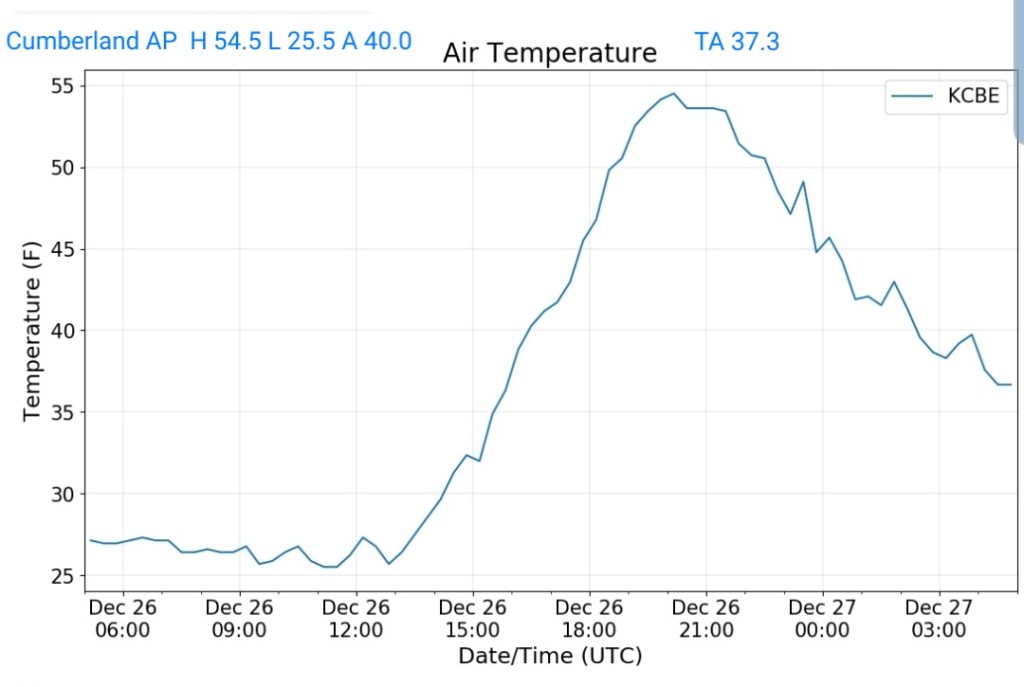
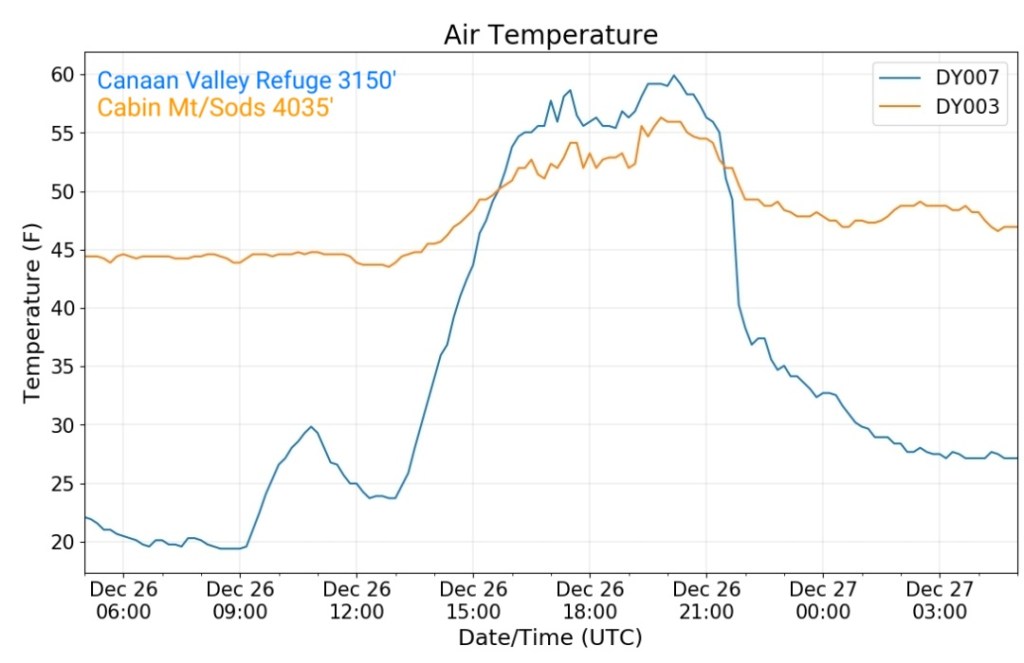
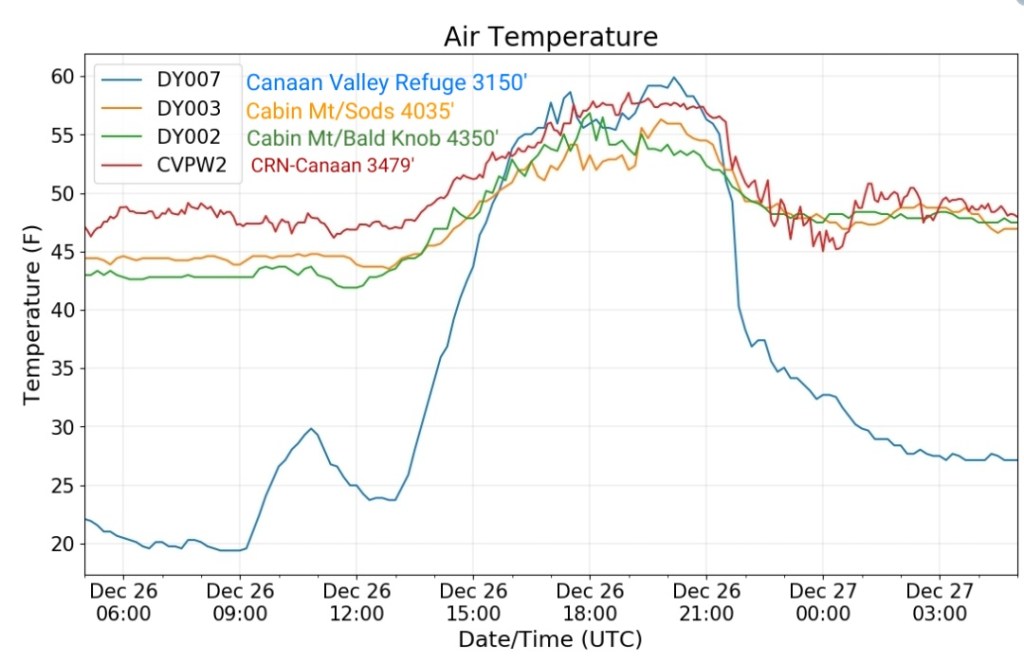
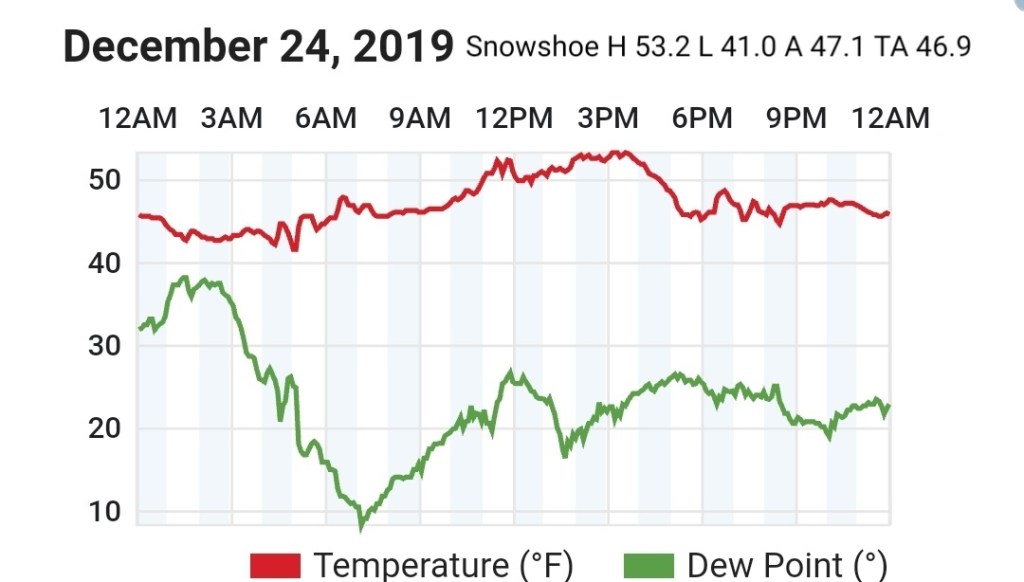
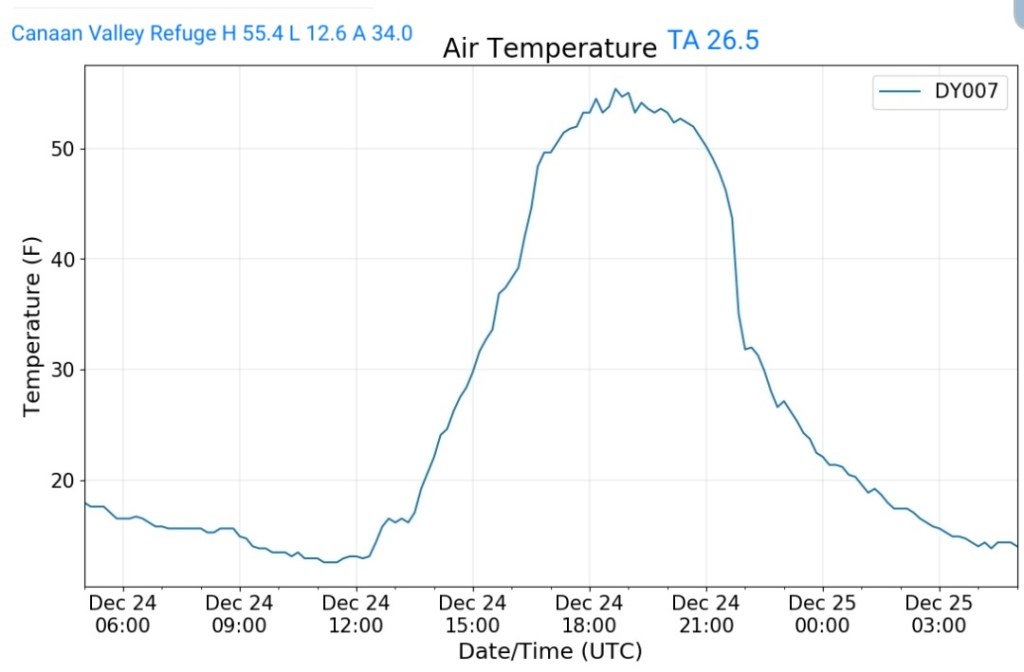
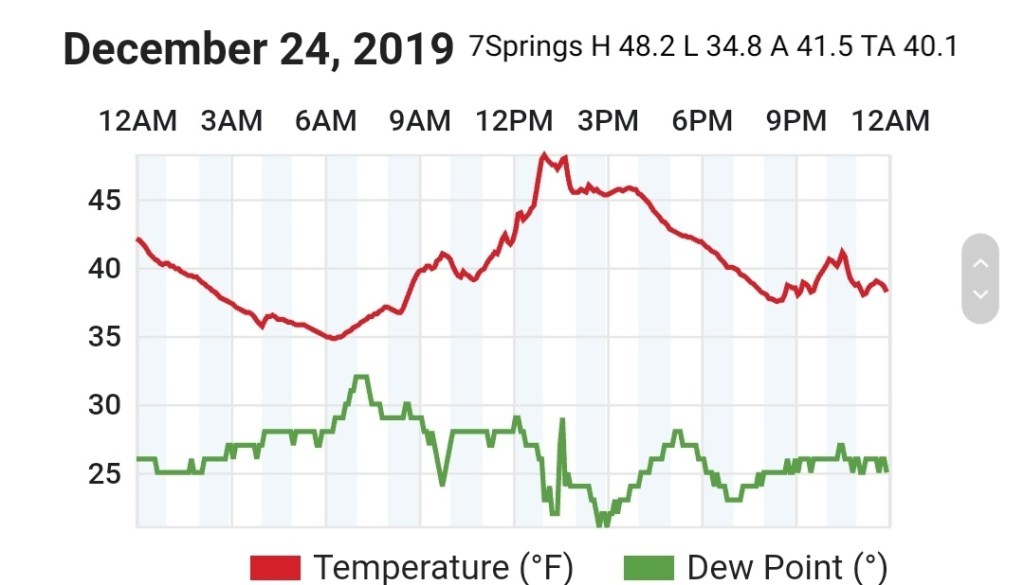
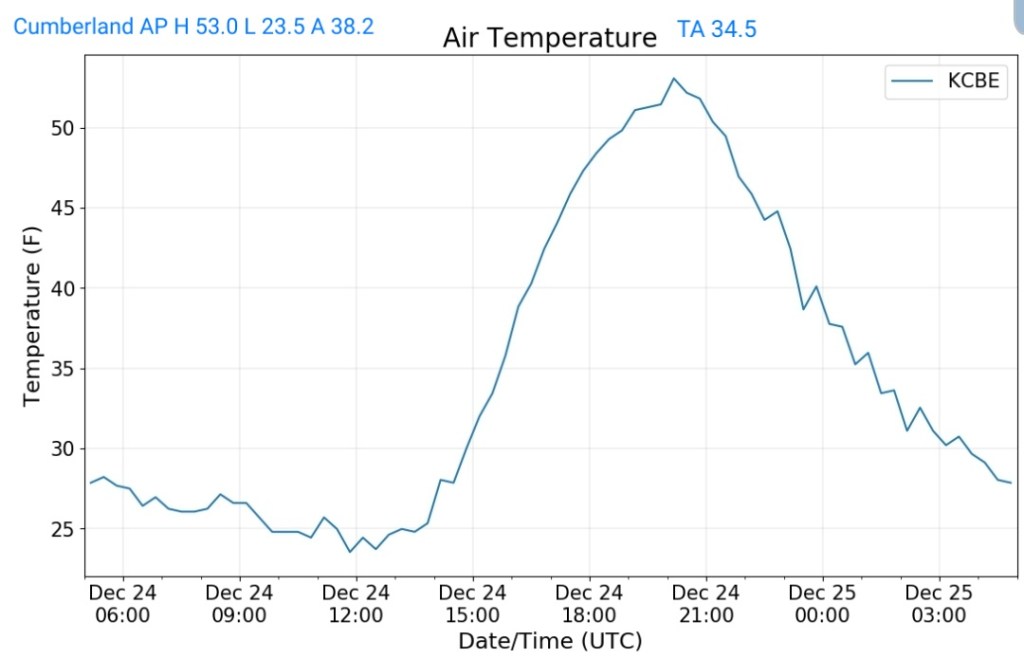
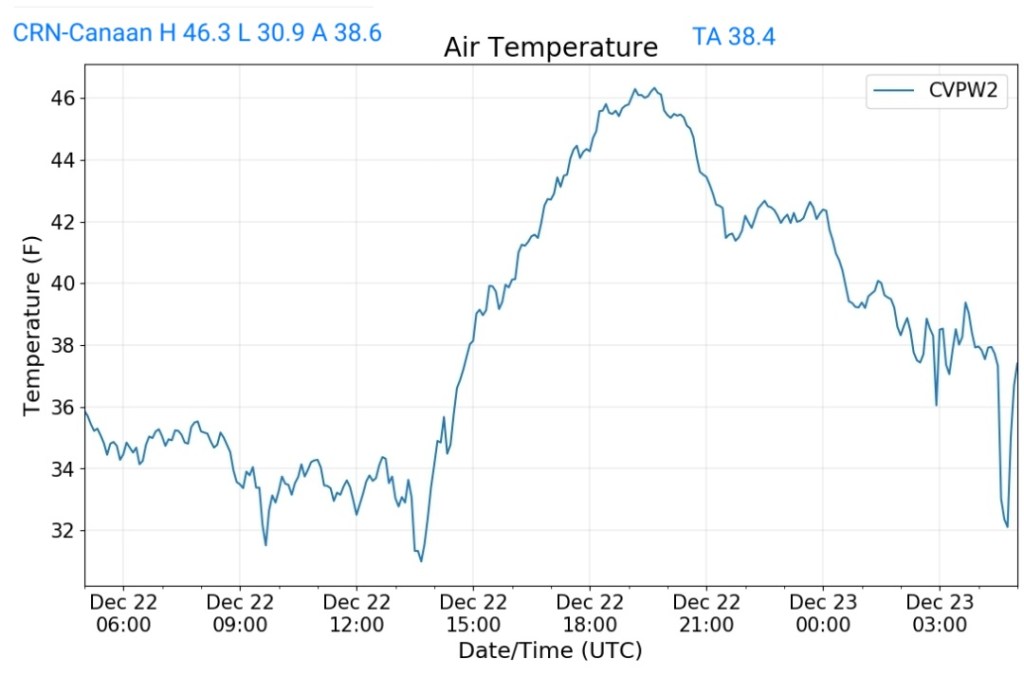
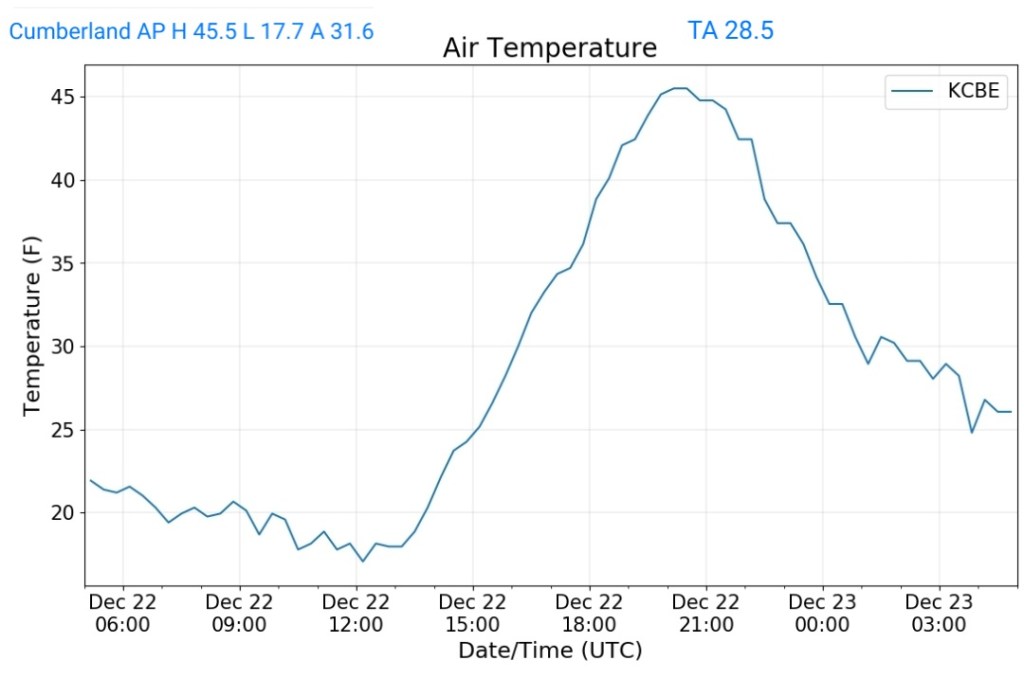
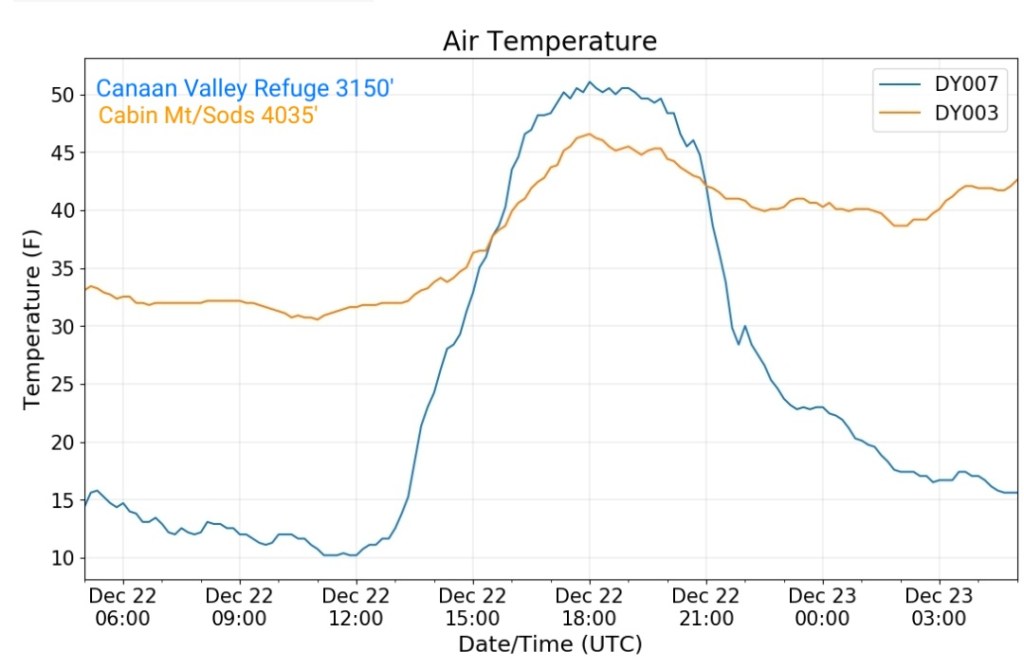
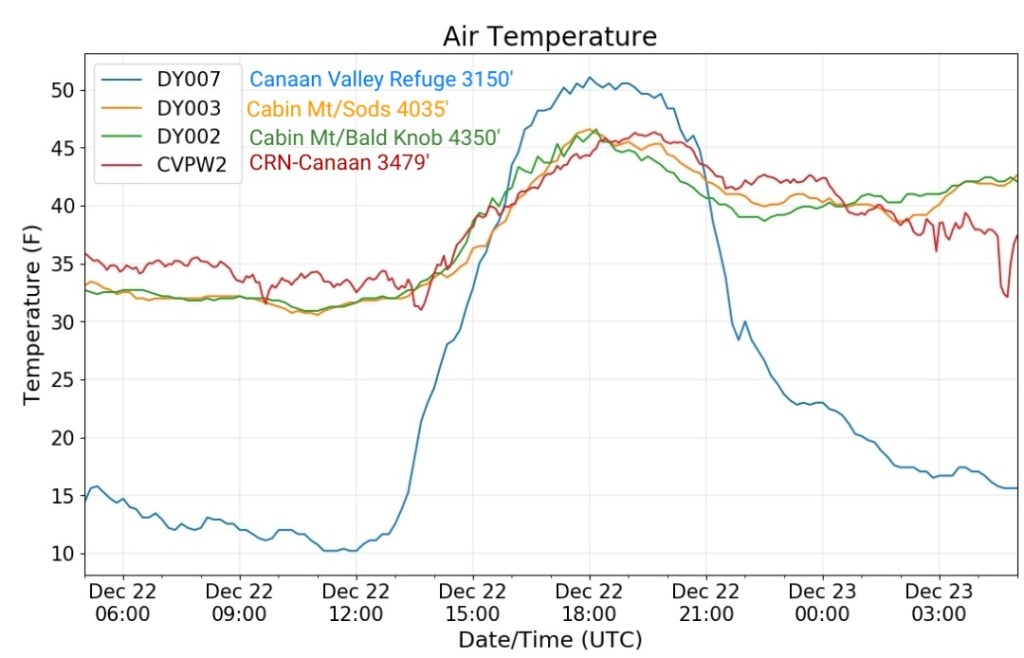
Bald Knob at Canaan at 4350′ vs Cumberland at 774′
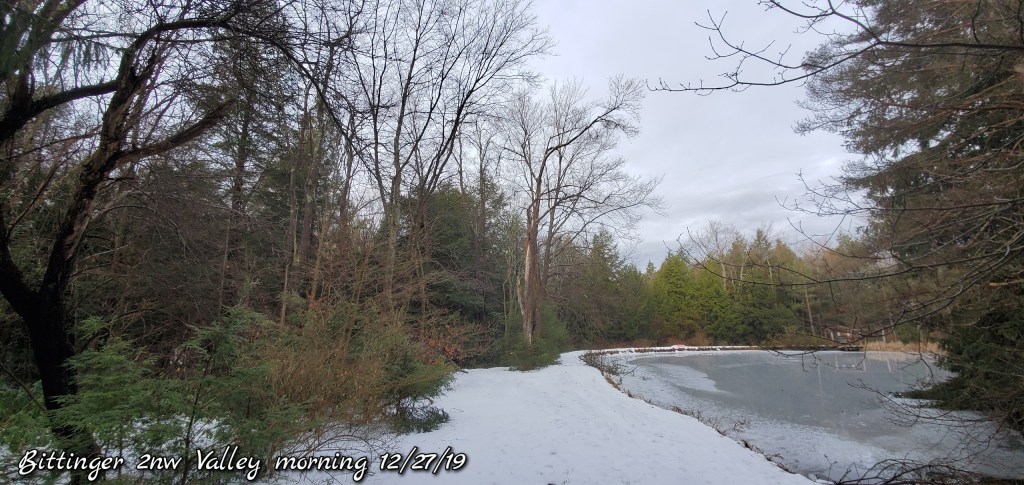
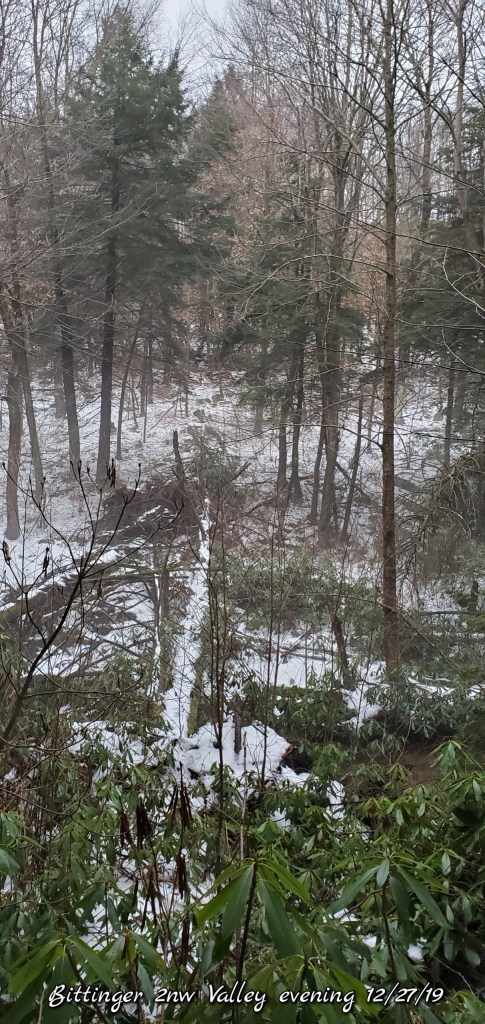
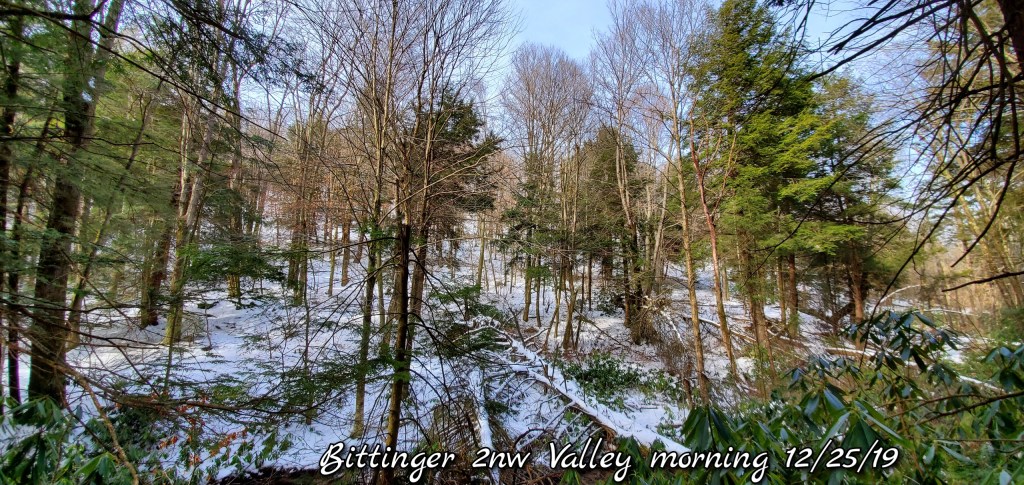
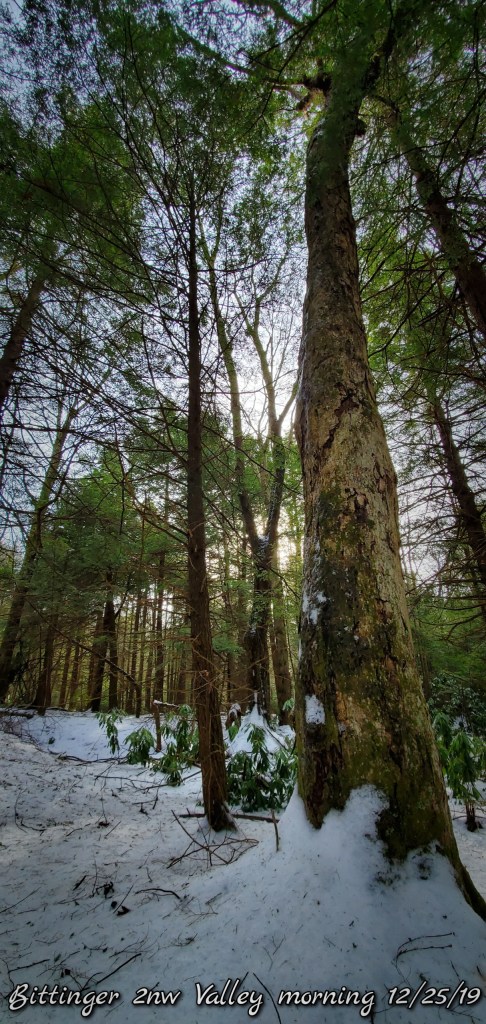
In some of the fascinating microclimates, a decent snow cover remains today. Example here near Bittinger, in Garrett County, just today at 2550′. This is a product of a sheltered valley holding cold in much the same way as a supermarket cooler works. The low dew points, calm winds, short days, these type areas do well in holding cold. Case in point below:
However this will be going away over the next few days ahead of the brief colder air coming next week. Why is it brief. I should say, likely brief as mother nature can yet fool the models. Today’s 12z runs of the 500mb heights is down right ugly for sustained winter. 585-591 off the Florida coast doesn’t bode well for Wv high ground snow. Pa north, it can.
12z ECMWF
Look at that continued large ridge. If that is the case. You will get a day, or 3 of winter, then the SW flow rapidly takes over. The GFS has this Ridge, although is a little less bullish on it.
The culprit in my opinion
The feedback over the warm waters in the gulf and southeast coast accompanied by the ring of cold in the Atlantic. That same ring of cooler water was nearly in the same location in 36.
What then occured in January 1937?
last night’s run of the ECMWF weeklies looked like this for the overall mean of the next 46 days. (Fortunately this model has not been good)
What exactly did January 1937 look like
Canaan did not have an official coop in 1937, but reports are, no measurable snow occured during that month. A station did occur at Stony River Dam, and it does have missing data, only a trace there was recorded. This is the least snowiest winter month in our areas recorded history
A little more from 36
November 1936, November 2019….the coldest area is centered in much the same area.
All that said, no pattern will match up 100%, and other factors can take over, and things such as a sudden stratospheric warming event can come in to play and alter what happens this season. Not trying to be a Debbie Downer to winter lovers(me included) . We still get some snows, but things at present day do not look promising for anything sustained near term at least…
Currently all the teleconnections do not look favorable for sustained winter. EPO ehh maybe the hope,WPO…,the NAO,AO,PNA natta
The near term:
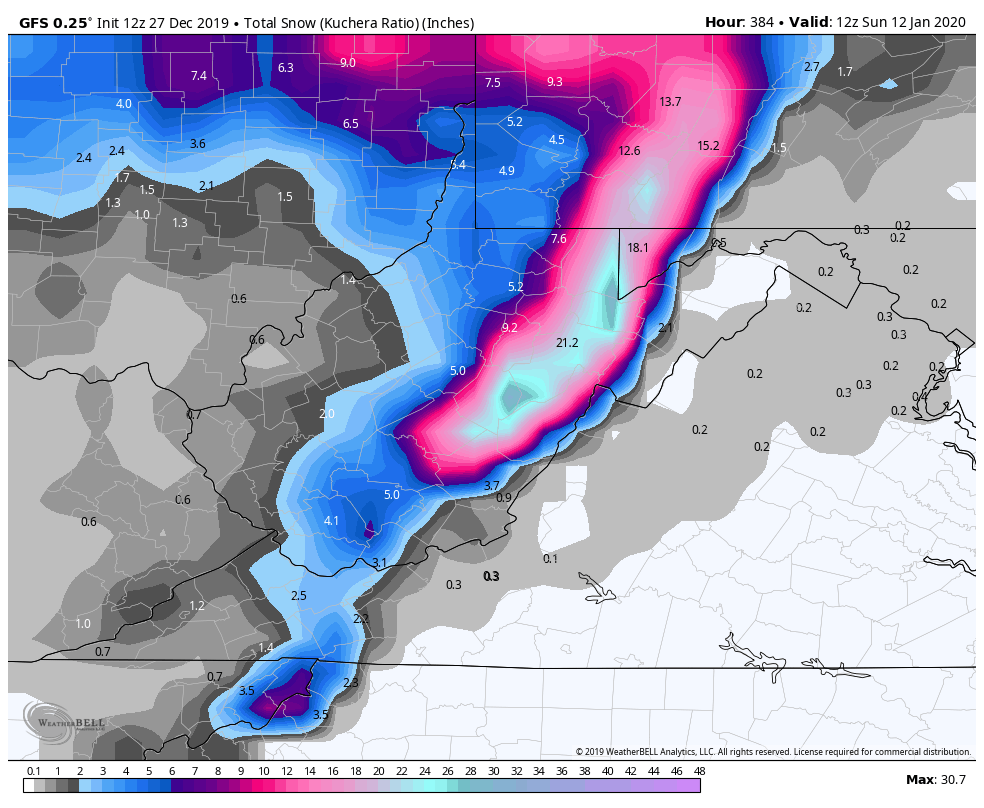
Before Jan 1 does arrive, we do got a shot at some snow that goes into Jan 1. The GFS, Canadian are similar while the ECMWF gives winter the middle finger again.
Wednesday may be a go day for resorts to make snow…
12z GFS temps
12z GFS snowfall
12z Canadian temps
12z Canadian snowfall
12z ECMWF temps
12z ECMWF snowfall
Interestingly enough, the long range GFS pumps out quite a bit of upslope snows days 8-16. Color me surprised if it occurs…just keeping some hope for the winter lovers….if the SE mega 500mb Ridge breaks, we are back in the game…..if not we are the Steelers without Roethlisberger hoping someone else can play QB.
Another fascinating local climatology event at play. While not cold enough for ice, those same areas this Sunday look to remain much chillier than the Wv high ground and west of the mts….the same almost identical repeated boundary.
12z 3km Nam temps
THINK SNOW, SNOW DANCE, PRAY, DO A PAYBACK IN THE STORE….AT THIS POINT, IF YOU WANT SNOW, TRY ANYTHING. Yes, I was yelling. Desperate times call for desperate measures…
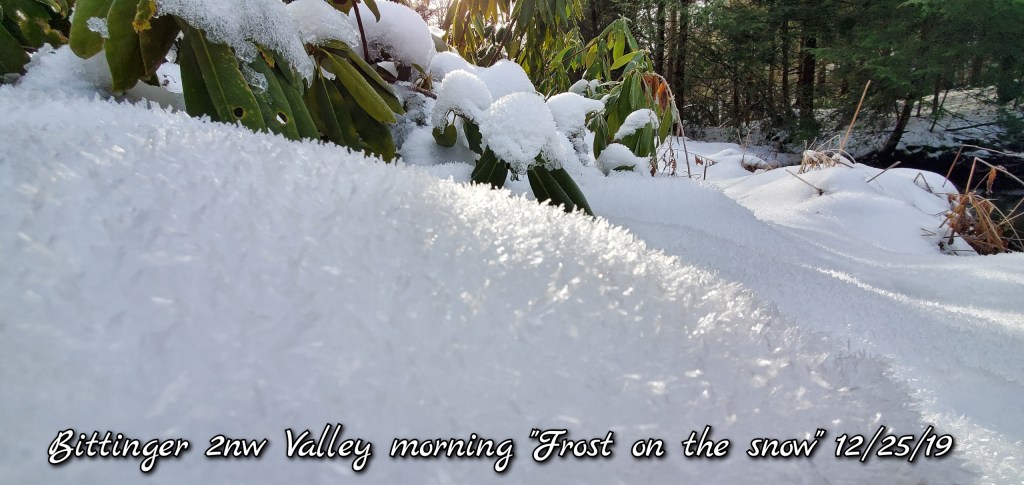
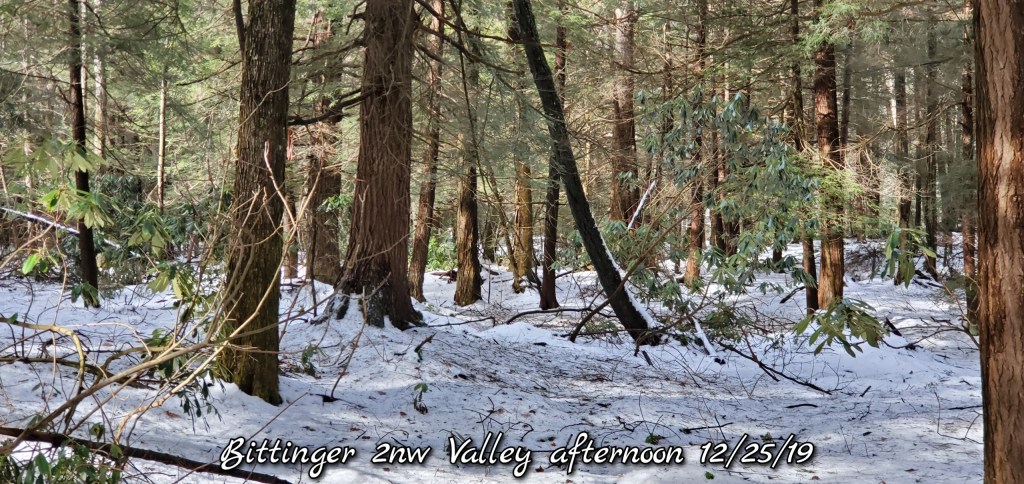
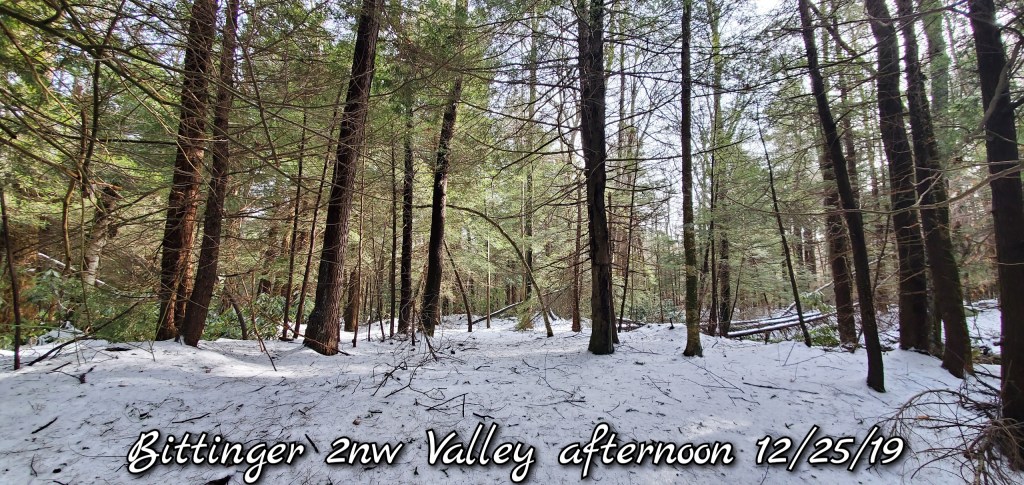
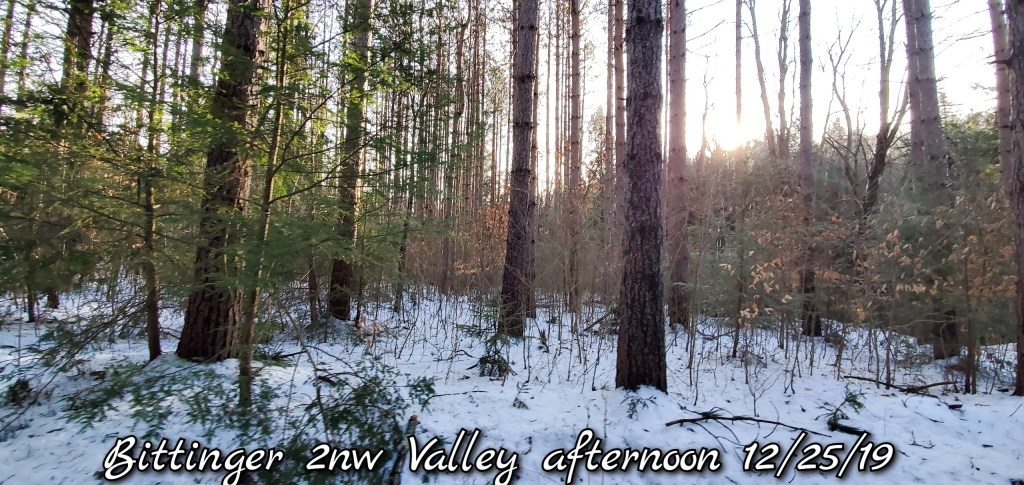
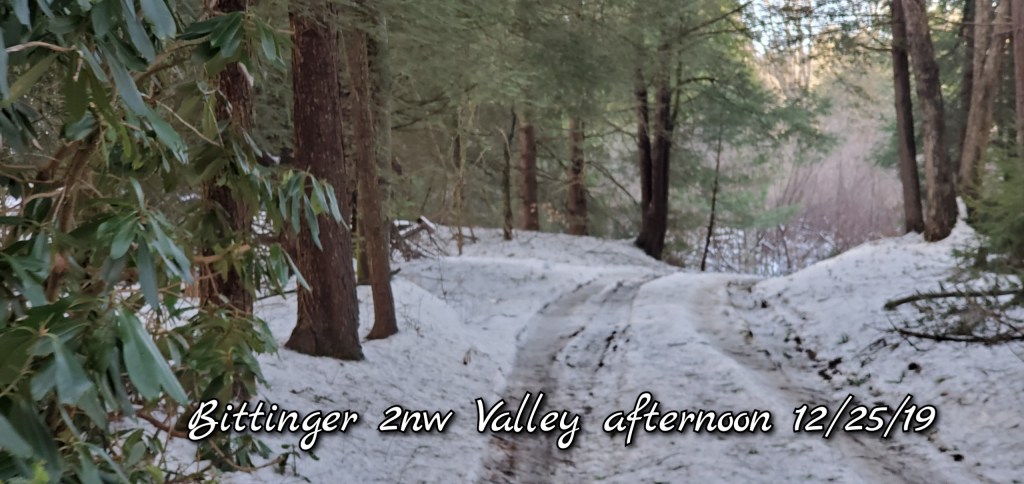
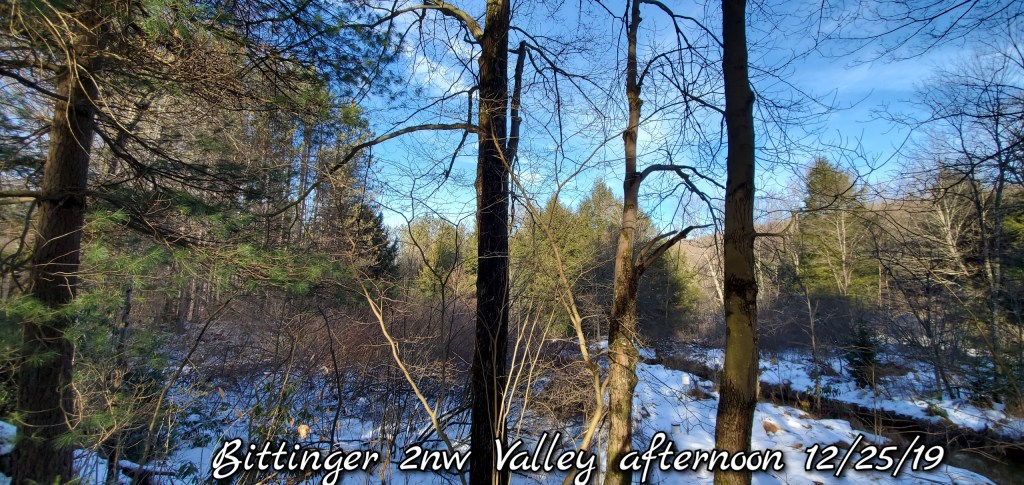
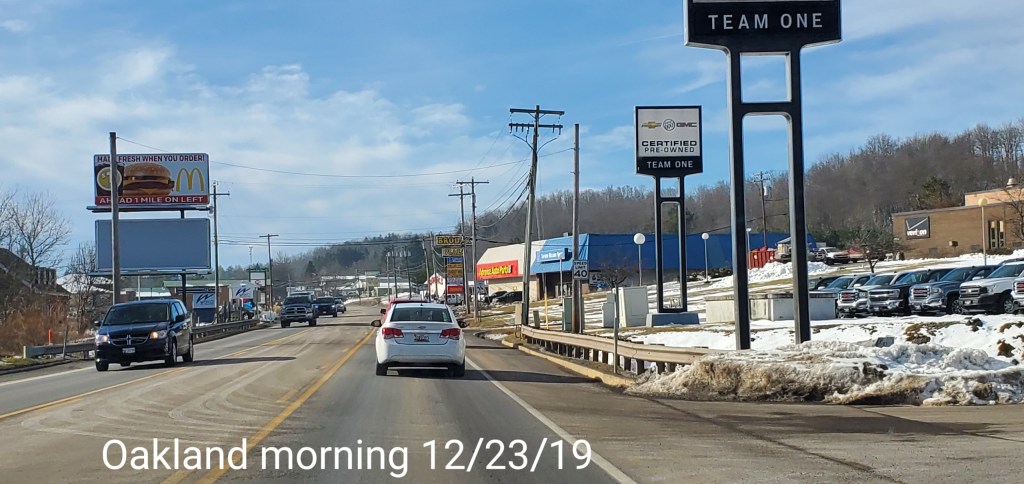
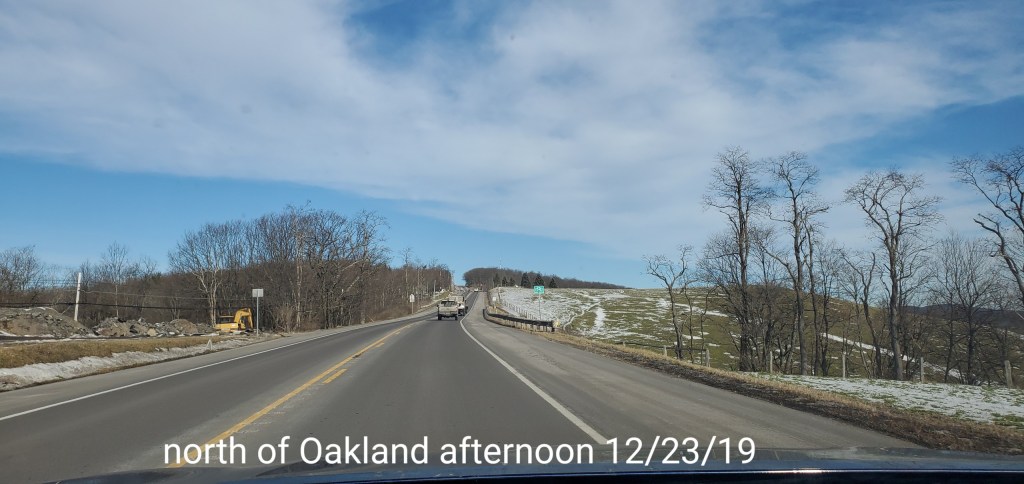
Another repeat, colder valleys, milder high ground, calm conditions. A nice Christmas travel day.
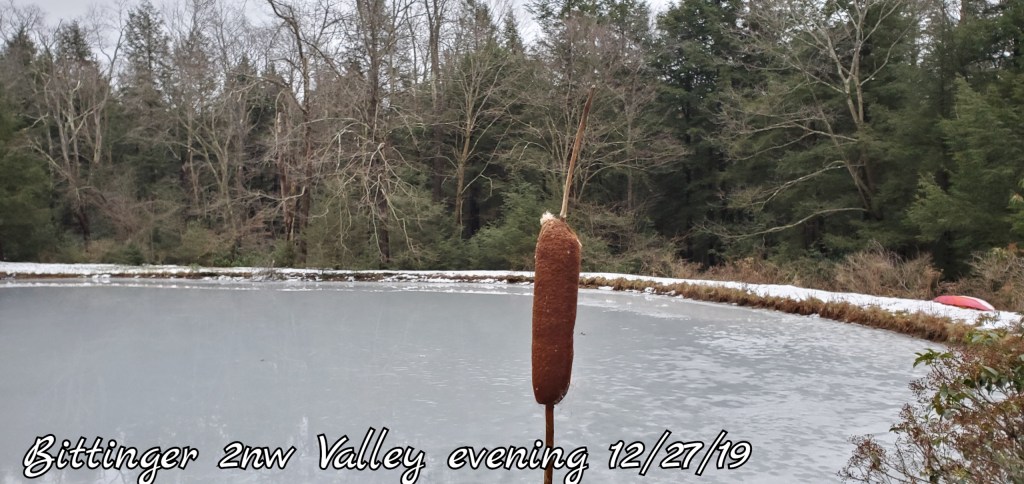
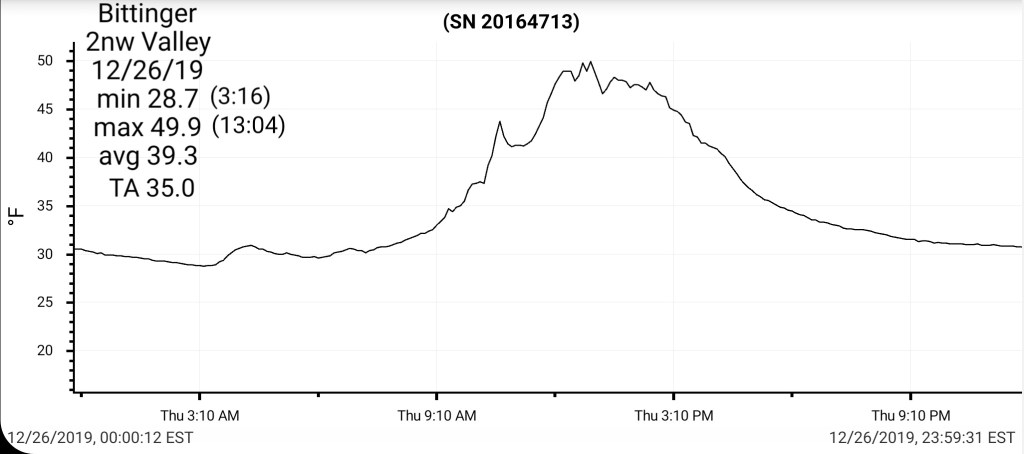
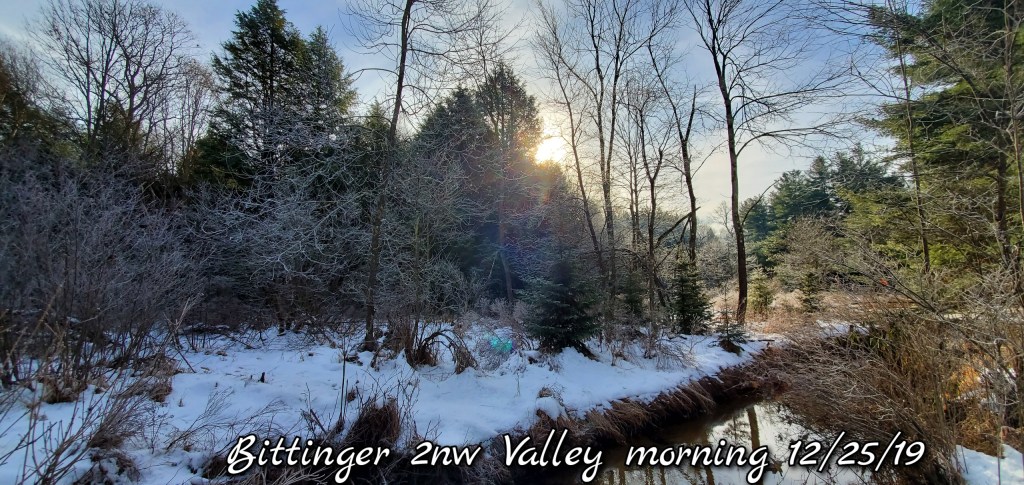
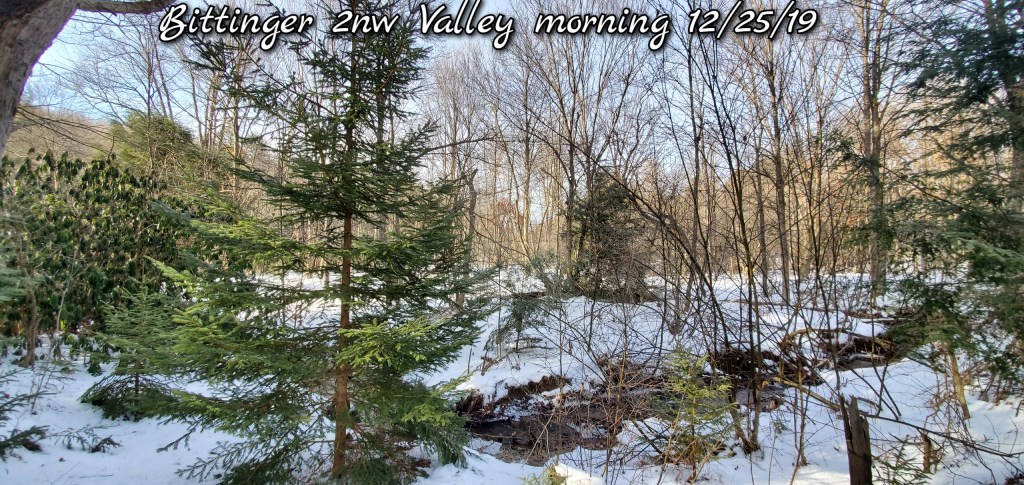
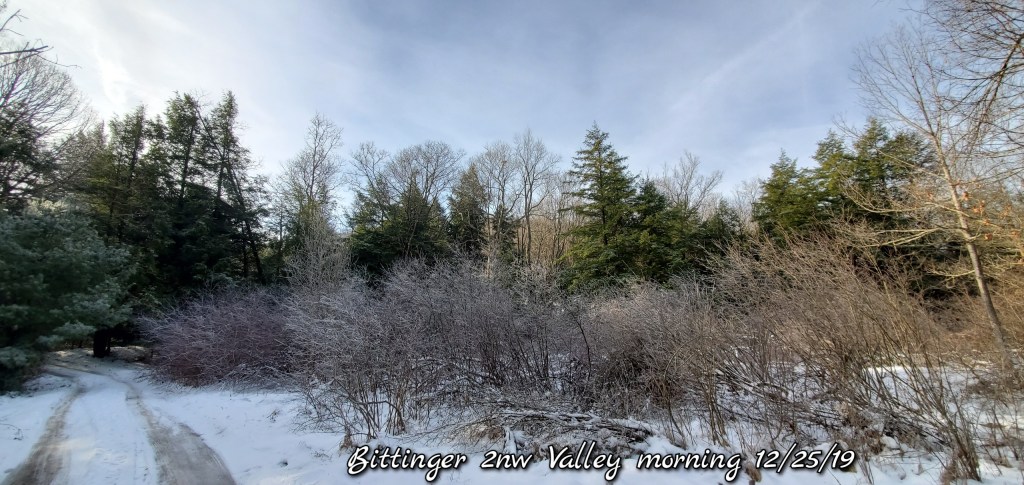
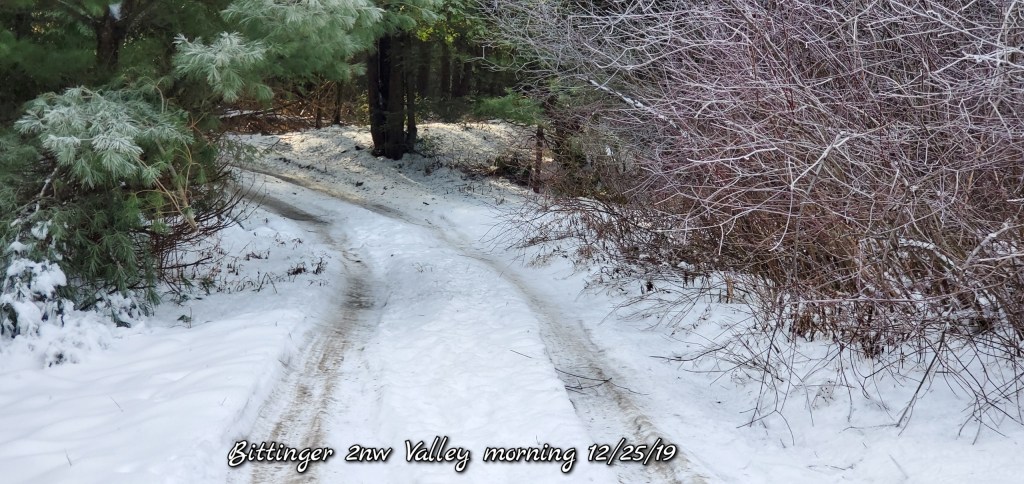
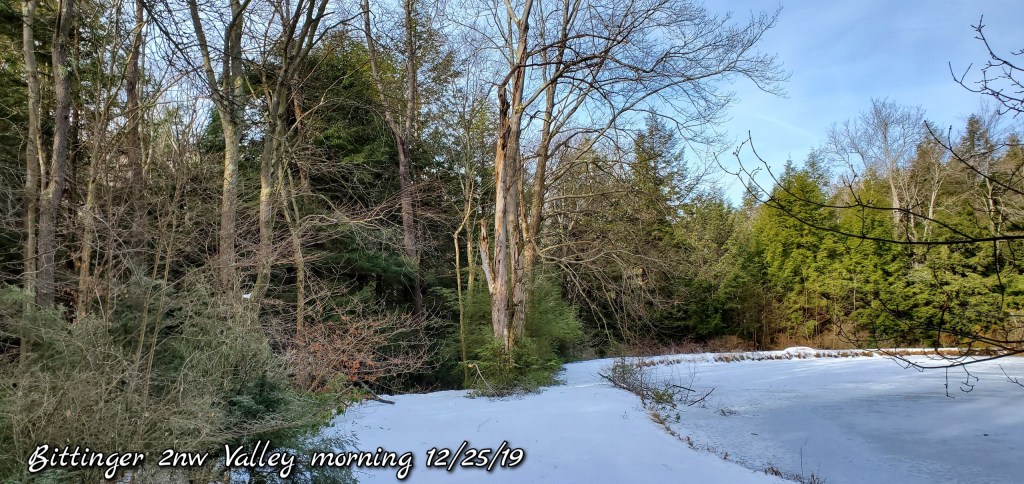
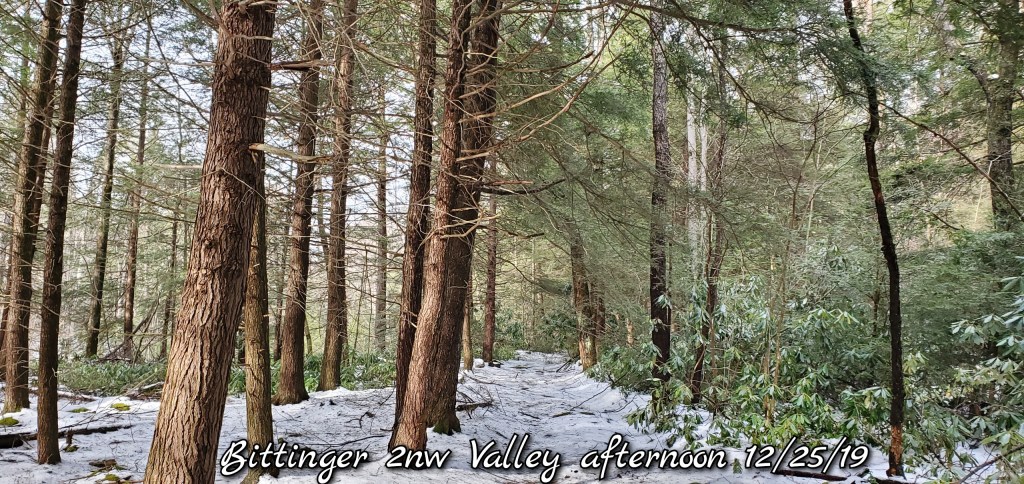
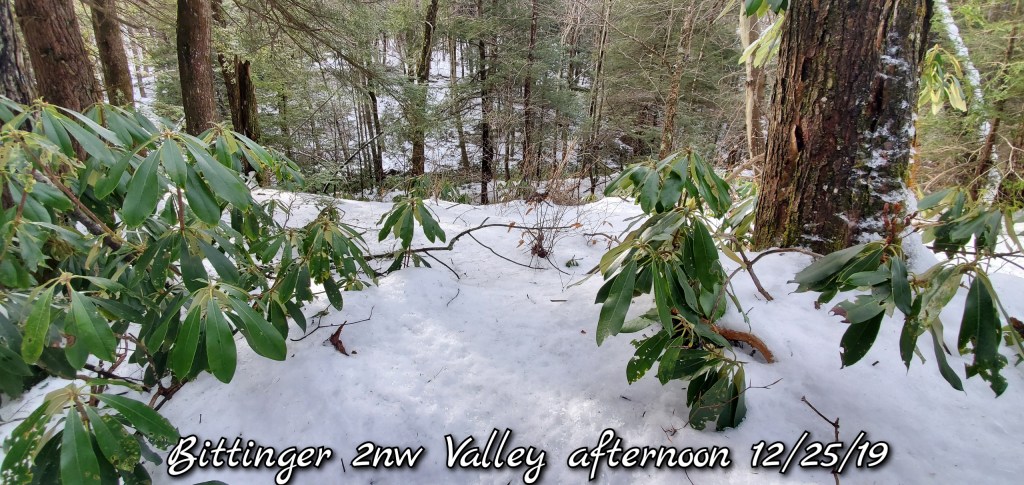
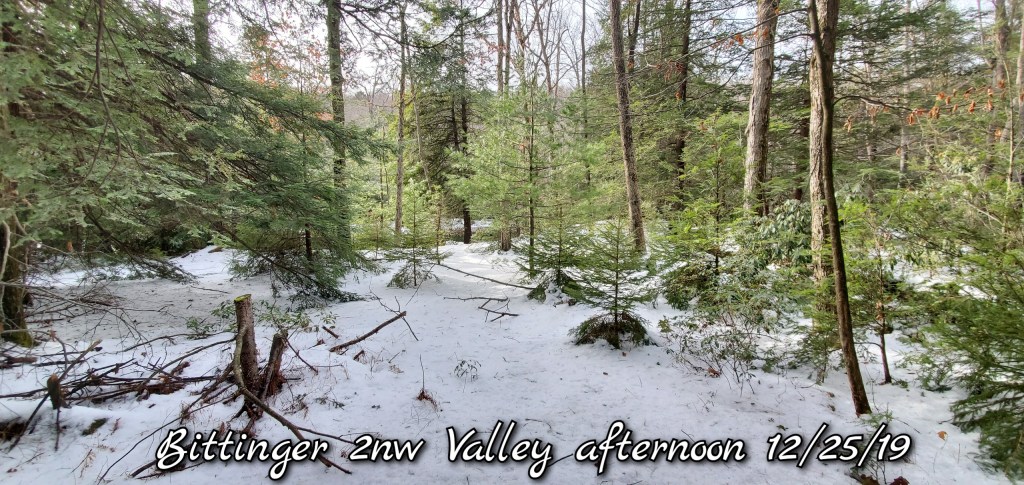
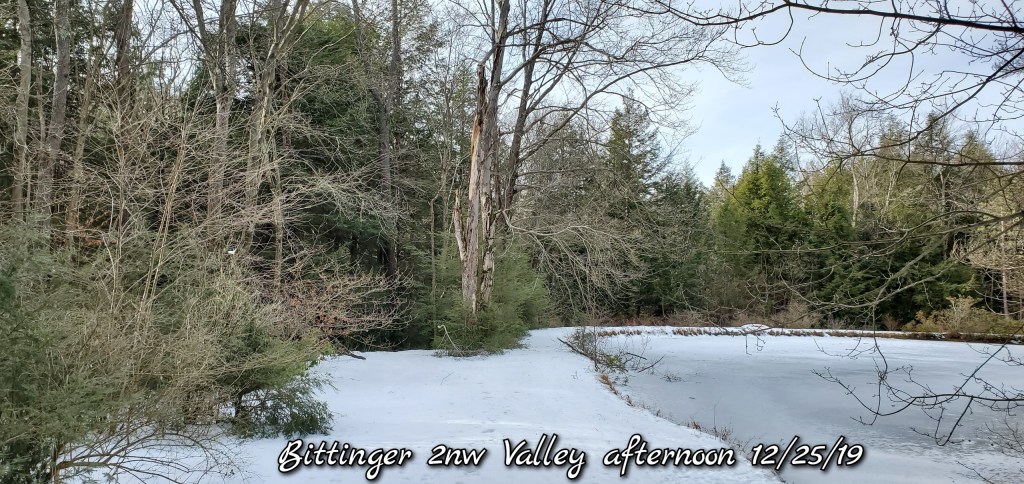
Bittinger 2nw Valley
This is an area, that holds cold for the east flow ice events, and west enough to do well on upslope events. Also a sheltered valley that holds cold well. Evident by the temps and remaining snow(lots of pics below)that gave a white Christmas to this area. At 9am, a 3″ hardpack remained.
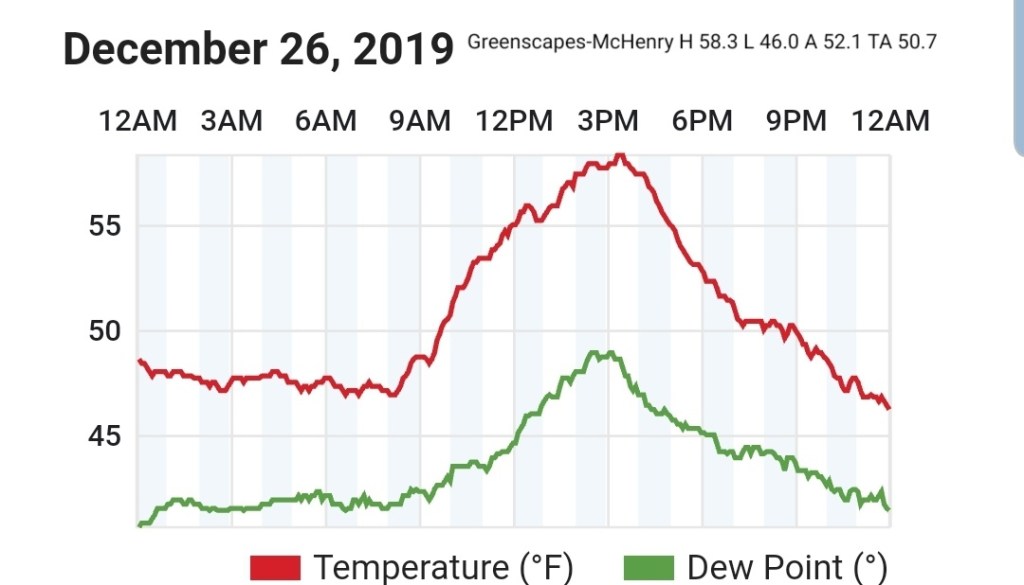
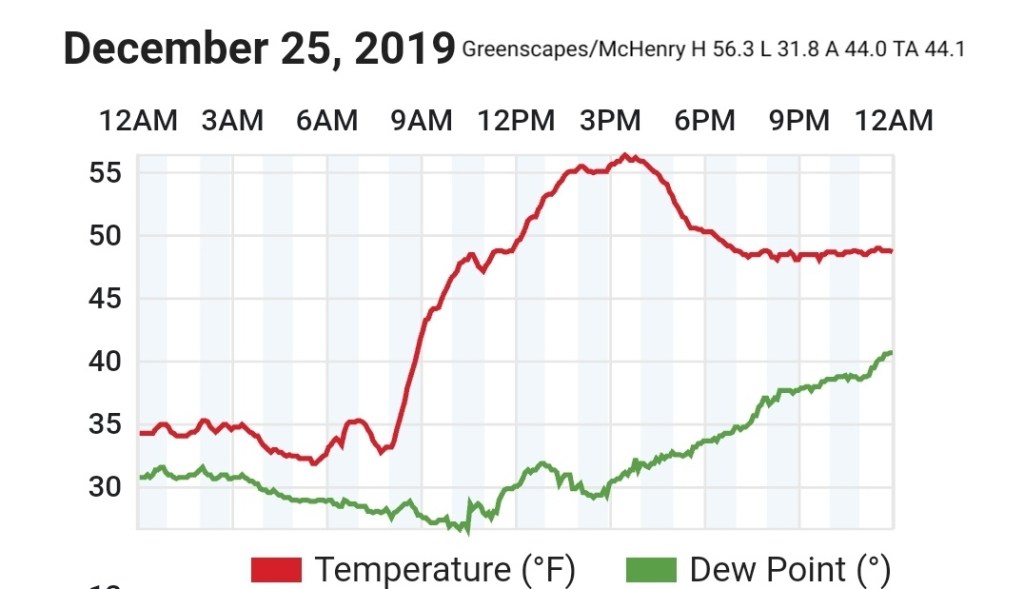
Station is down and offline. With the holiday season upon us, it may be down for a little bit. Will substitute the nearby Greenscapes station. It is a rooftop station. Not fond of rooftop stations. But for a continuation of data from a station close, it will be used.
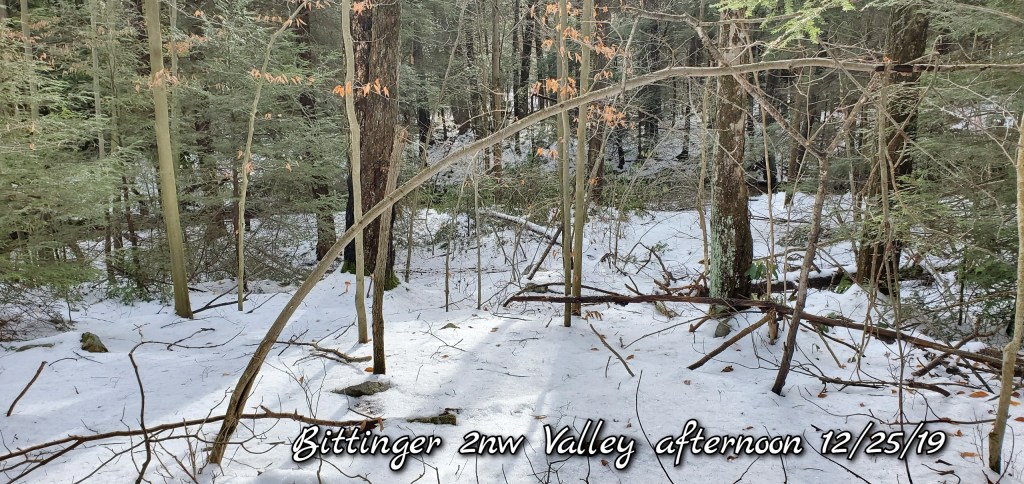
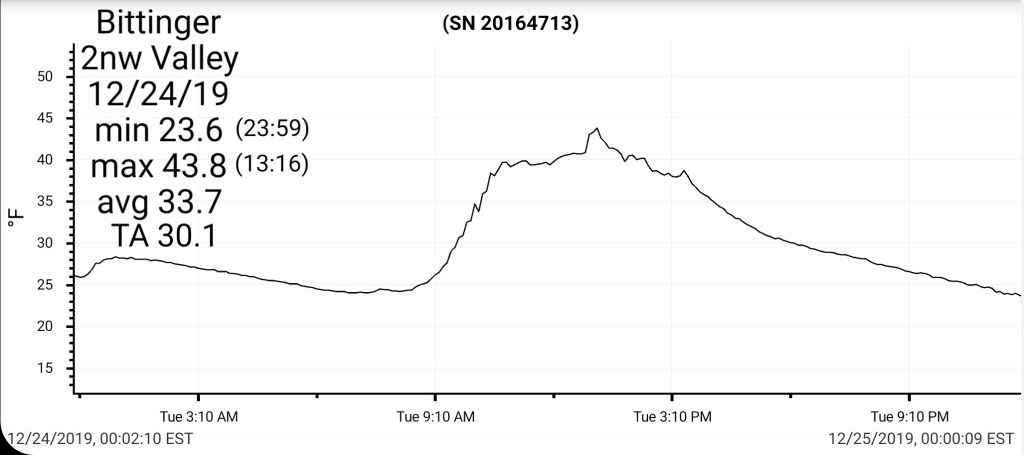
Repeat. Stagnant, boring pattern. The only excitement is the unique local climatology. Mainly the valleys that decouple and drop off low overnight, to the more sheltered colder valleys that hold cold like a supermarket cooler in the daytime. Mostly in the areas with snow cover. While some areas run 50s, these areas hold 3ps under the calm conditions.
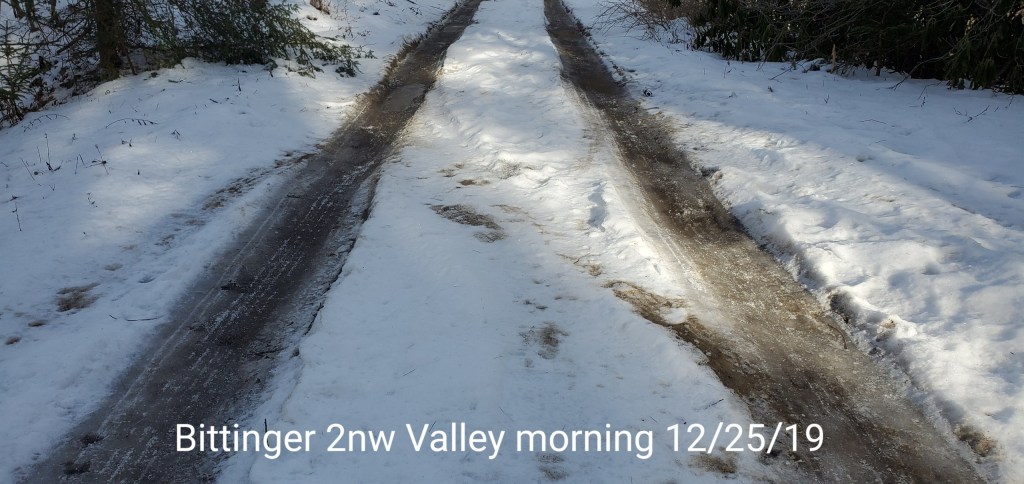
Also to note, patchy black ice in deep valleys this a.m
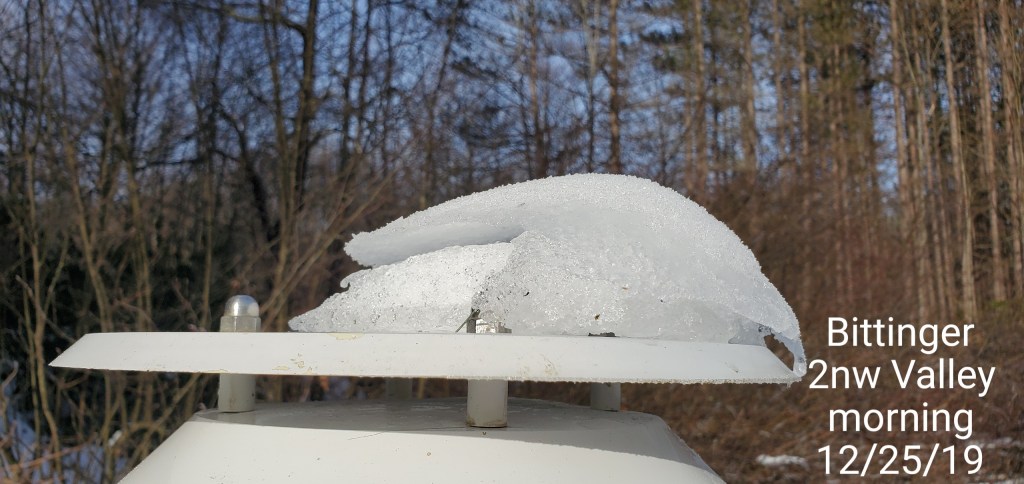
Morning hardpack average depth at slightly over 3″
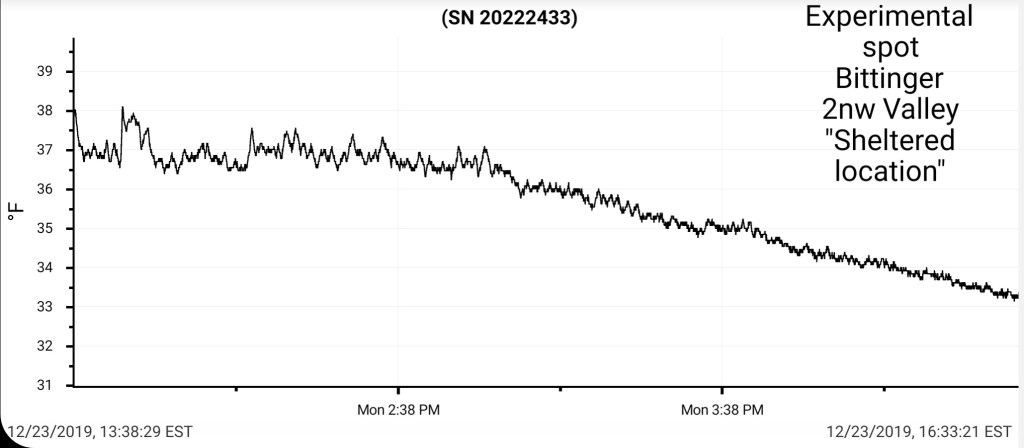
An example of afternoon temps in a more sheltered low area that really works like the supermarket coolers/freezers. This is while most areas were in the 50s
Clear cold night in the valleys, milder high ground. That theme continued today with the deep and or sheltered valleys holding chillier than surrounding areas.