December 16, 2019
Dec 16(Mon)
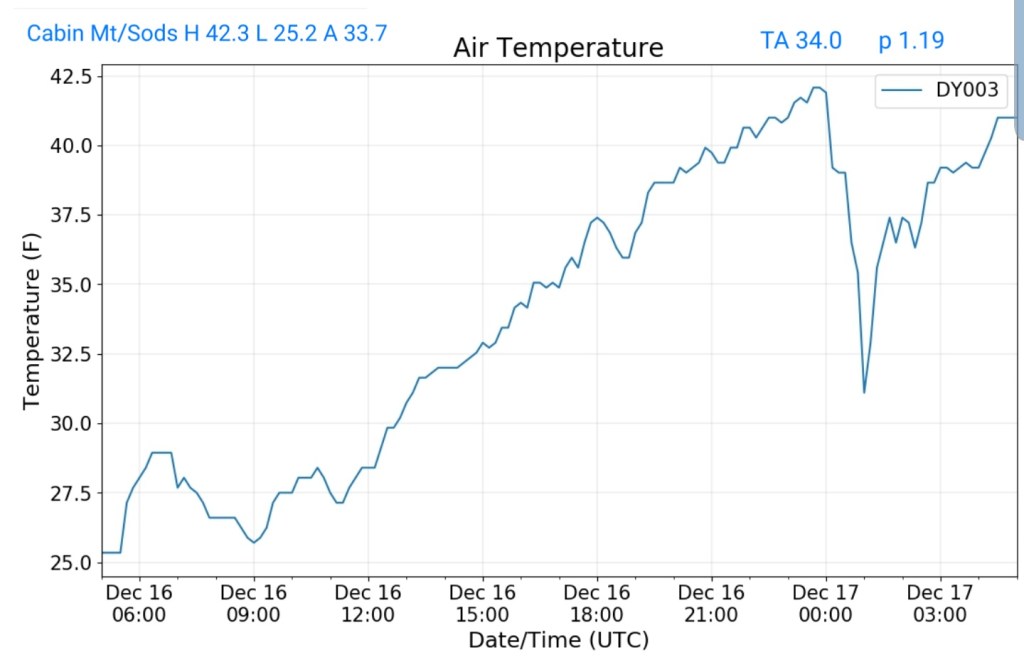
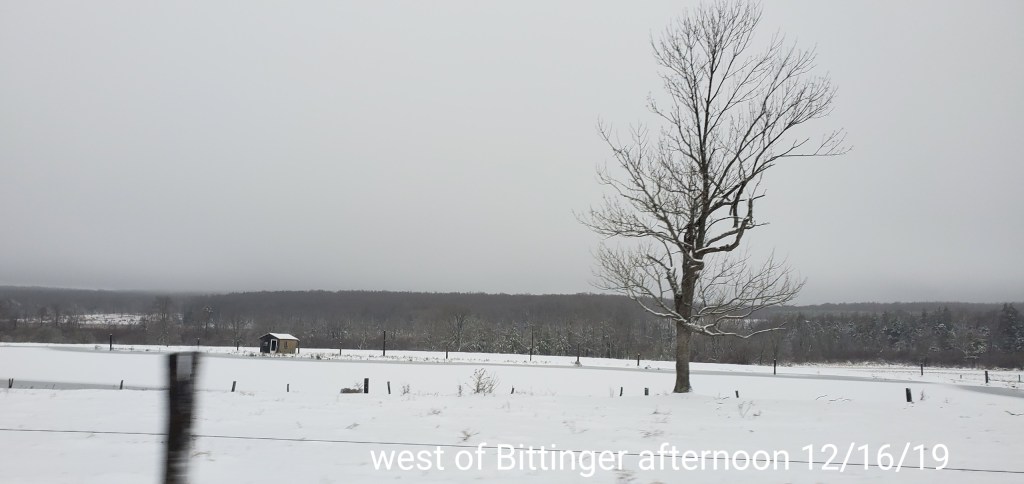
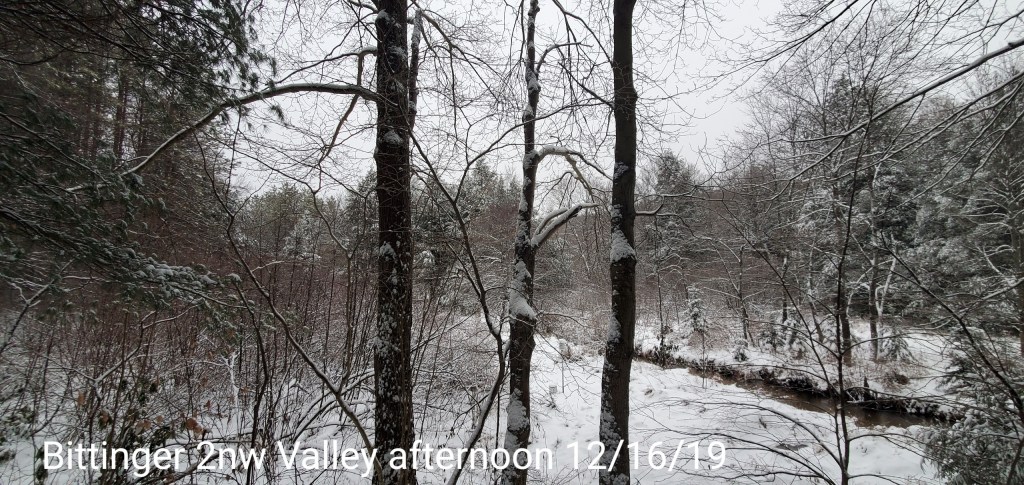
Snow overnight, changing to freezing rain in the morning. Plain rain Wv high ground. Light freezing rain through the day, increasing in coverage and intensity late day and by overnight, the tree load was greatly increasing.
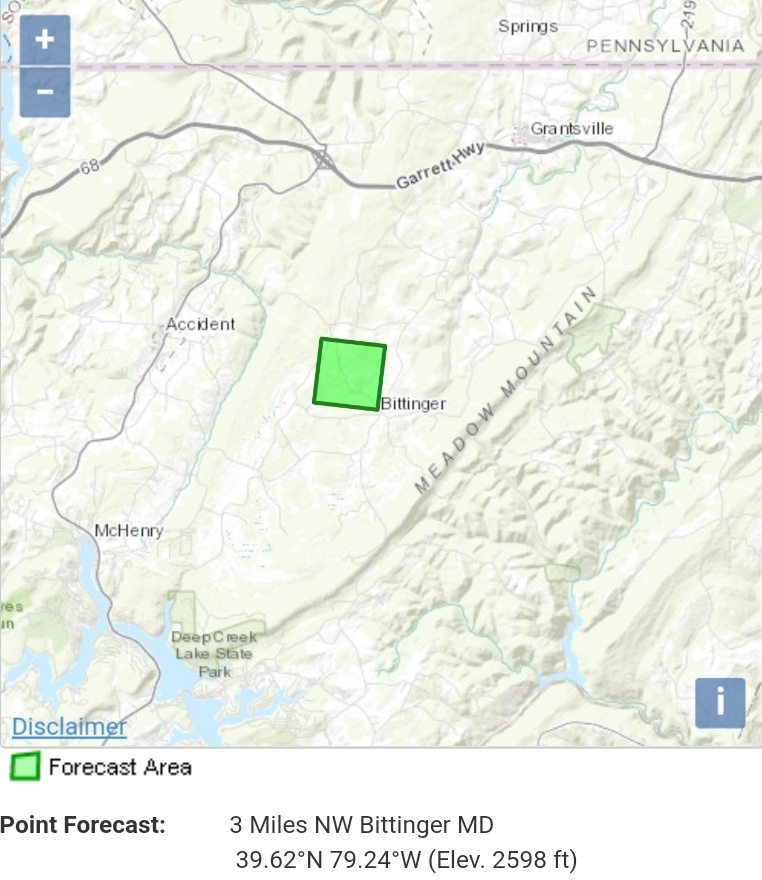
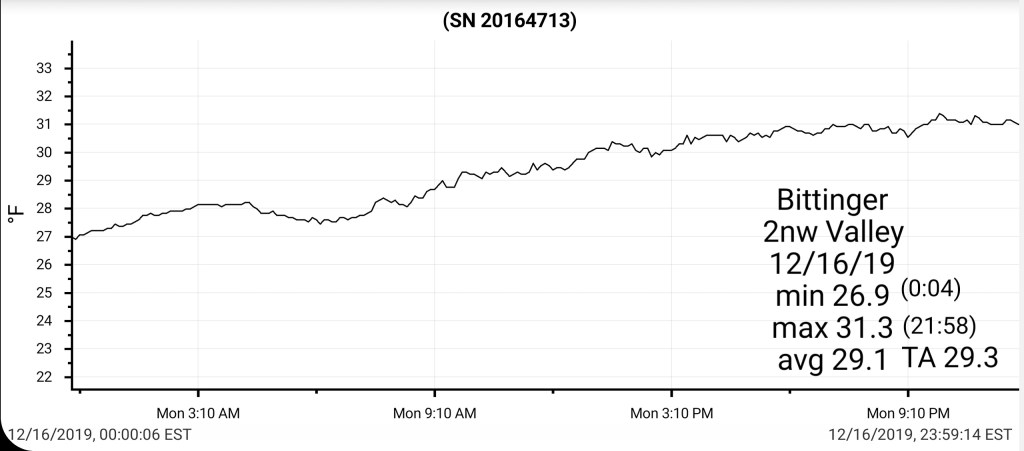
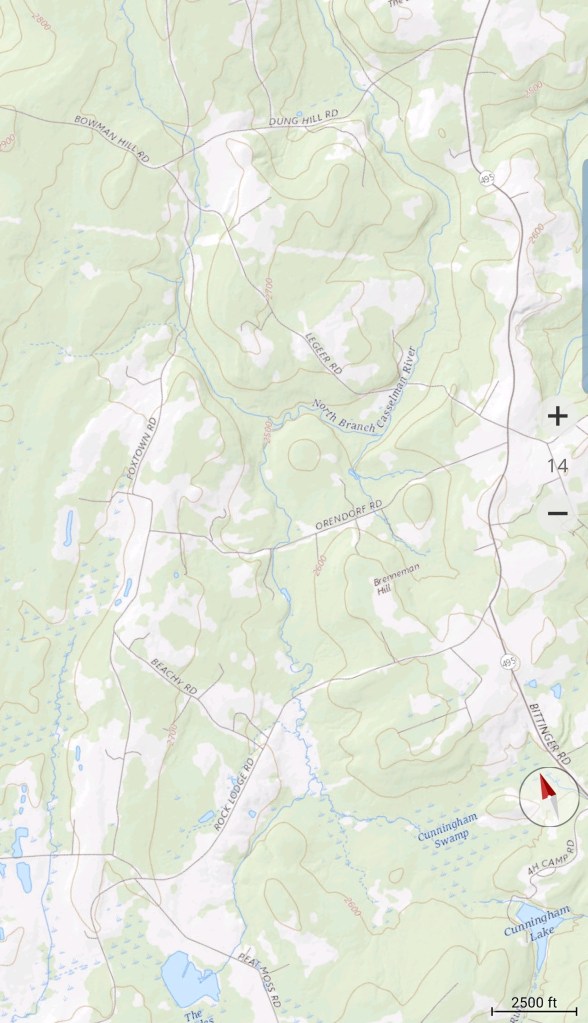
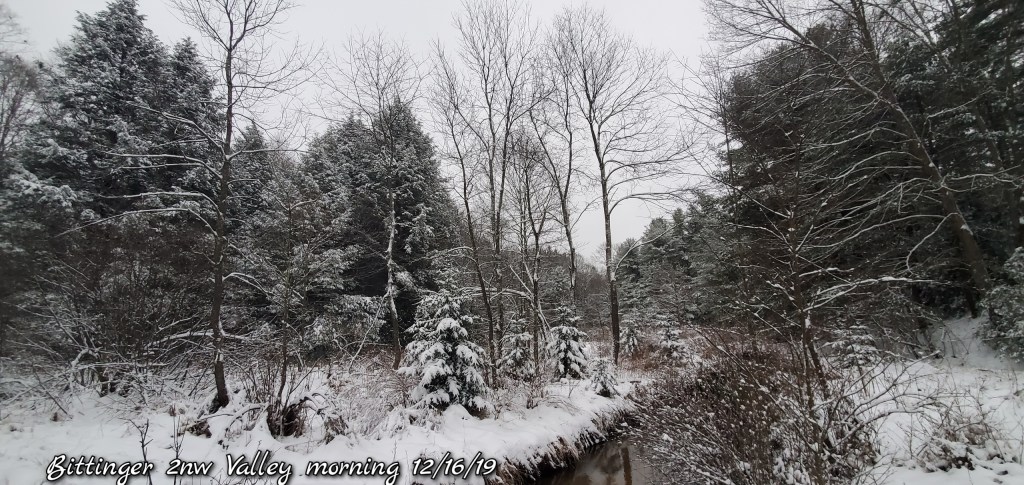
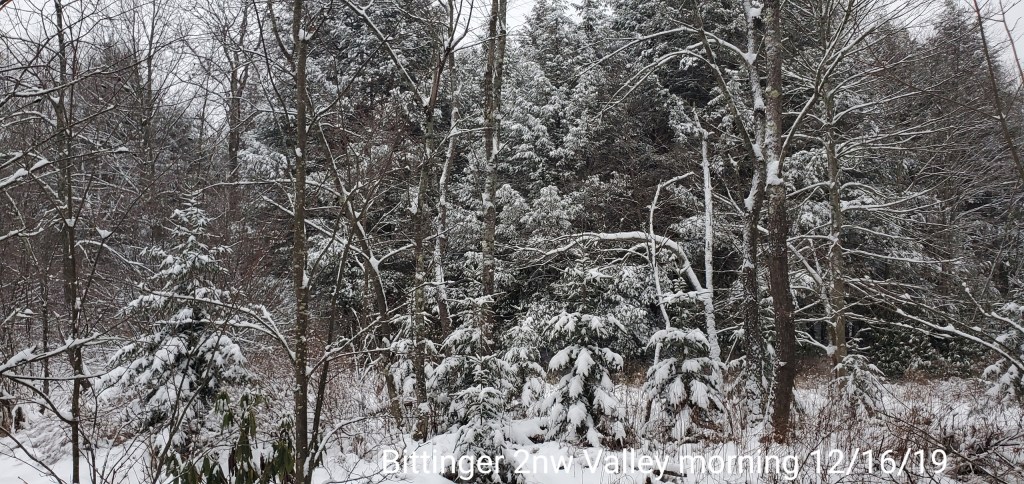
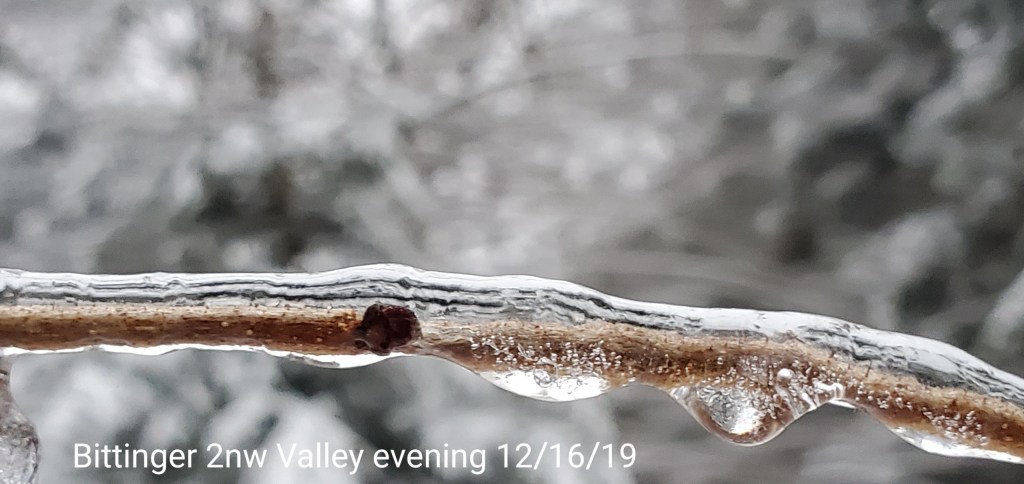
Bittinger 2nw Valley
MIN[26.9]—MAX[31.3]—AVERAGE MEAN[29.1]—TRUE AVERAGE[29.3]—PRECIP[.29]7am
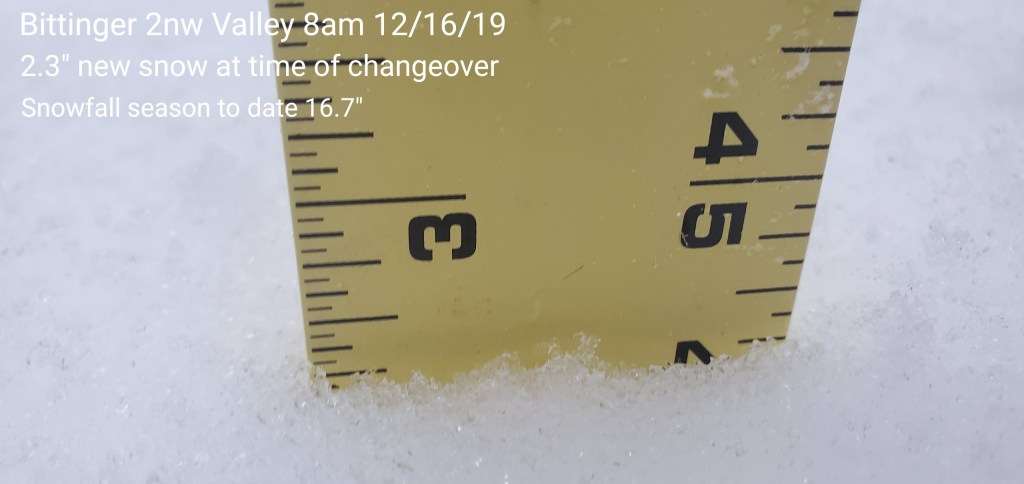
New Snowfall 2.3″ through changeover to freezing rain
Season to date total snowfall 16.7″
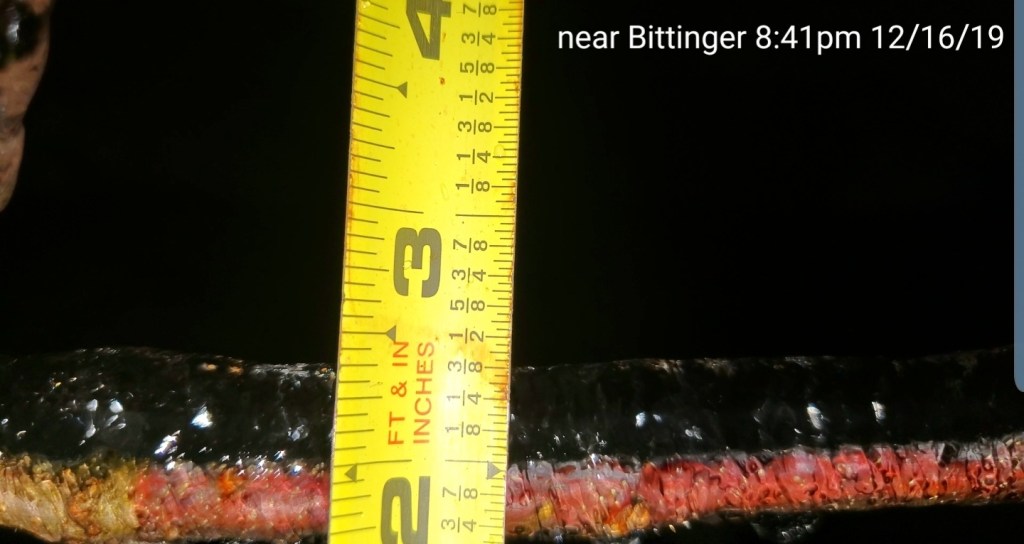
Ice accumulation increasing at nightfall
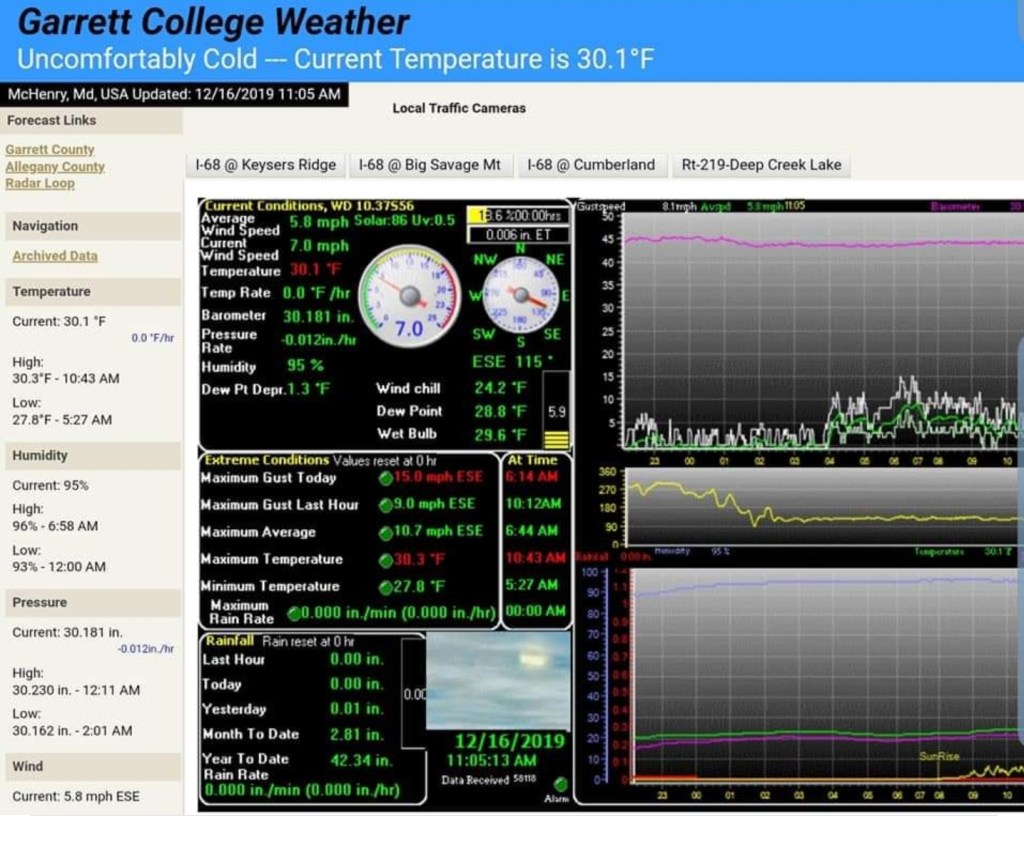
Garrett College
MIN[27.8]—MAX[31.8]—AVERAGE MEAN[29.8]—TRUE AVERAGE[29.8]—PRECIP[F]

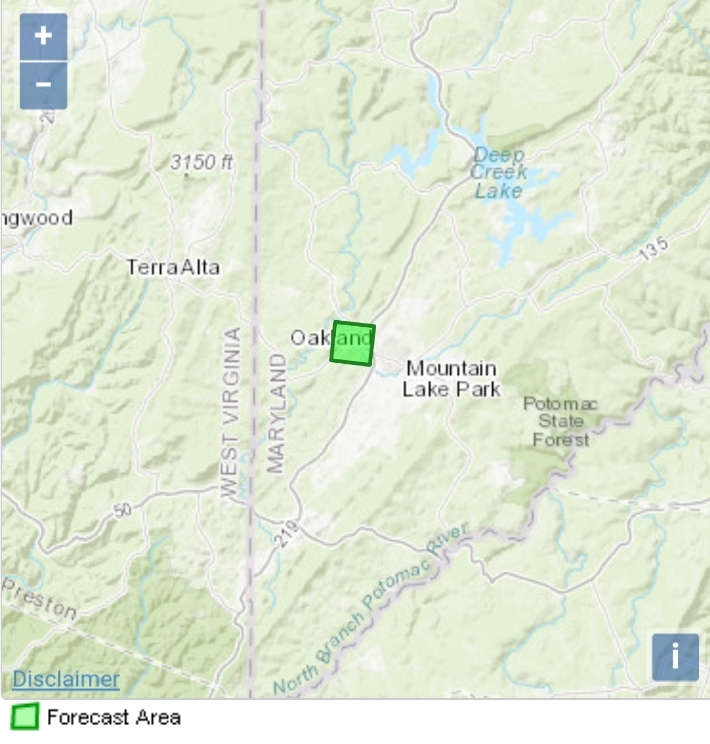
Canaan Heights/Davis 3SE
MIN[26.3]—MAX[42.2]—AVERAGE MEAN[34.2]—PRECIP[.49]7am
Snowfall 2.2″
Season to date total snowfall 26.3″
Comment by Dave Lesher
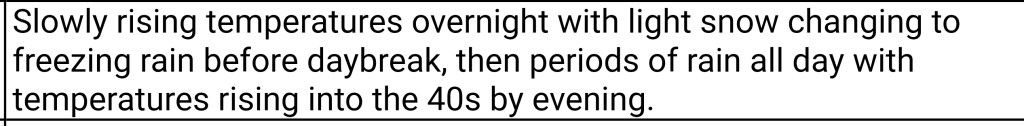
Climate Reference Network Canaan
MIN[27.2]—MAX[41.0]—AVERAGE MEAN[34.1]—TRUE AVERAGE[34.0]—PRECIP[1.28]
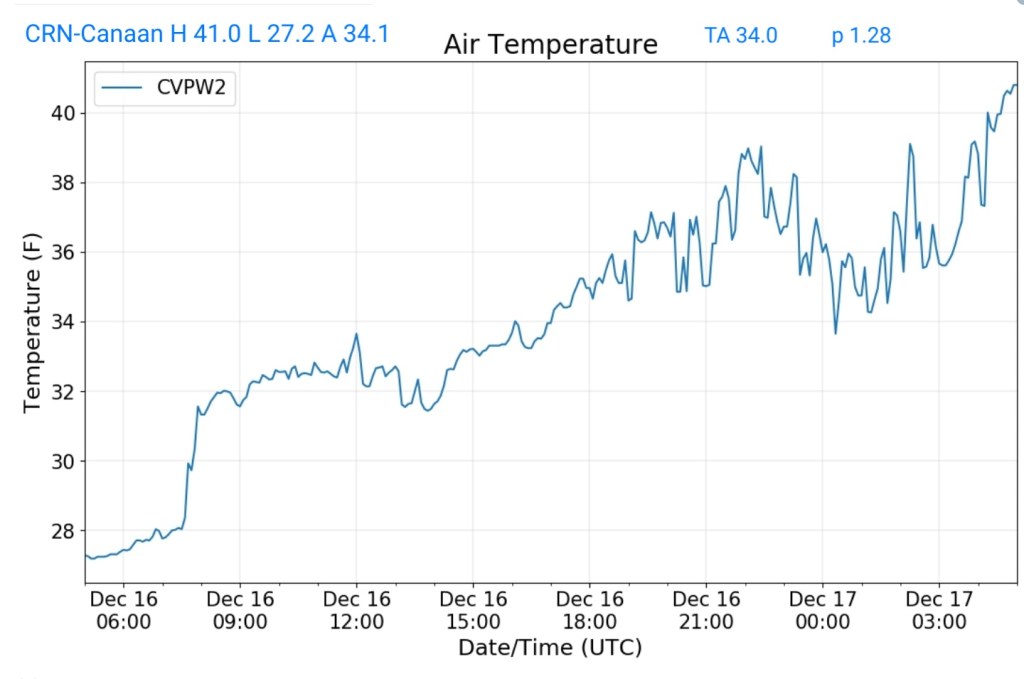
Cabin Mt at Bald Knob
MIN[24.1]—MAX[42.3]—AVERAGE MEAN[33.2]—TRUE AVERAGE[35.3]—PRECIP[1.48]
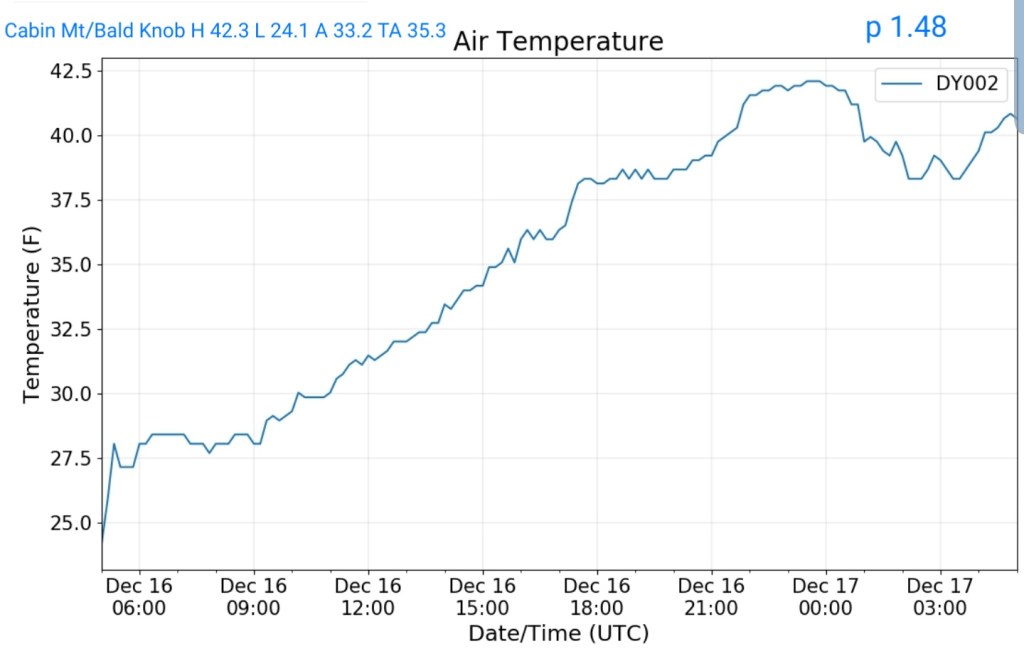
Cabin Mt-Western Sods
MIN[25.2]—MAX[42.3]—AVERAGE MEAN[33.7]—TRUE AVERAGE[34.0]—PRECIP[1.19]
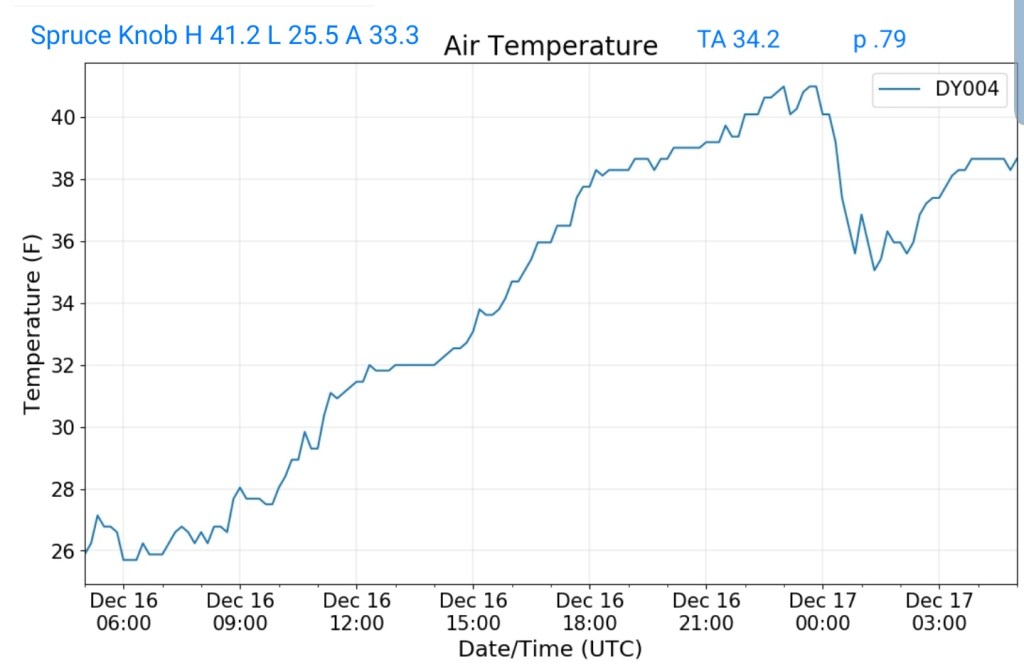
Spruce Knob
MIN[25.5]—MAX[41.2]—AVERAGE MEAN[33.3]—TRUE AVERAGE[35.2]—PRECIP[.79]
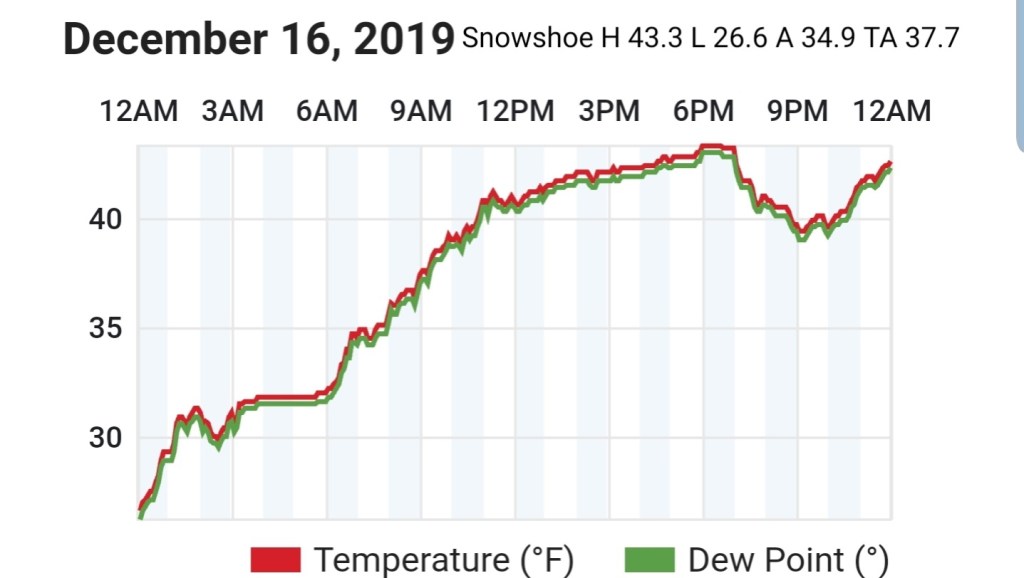
Snowshoe
MIN[26.6]—MAX[43.3]—AVERAGE MEAN[34.9]—TRUE AVERAGE[37.7]
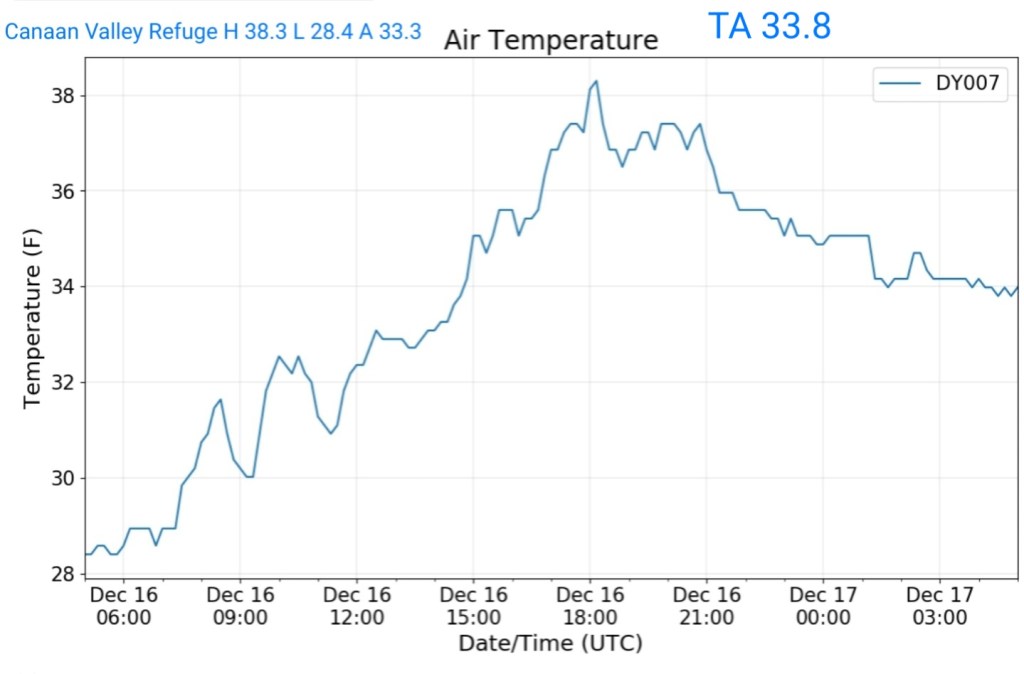
Canaan Valley Refuge
MIN[28.4]—MAX[38.3]—AVERAGE MEAN[33.3]—TRUE AVERAGE[33.8]
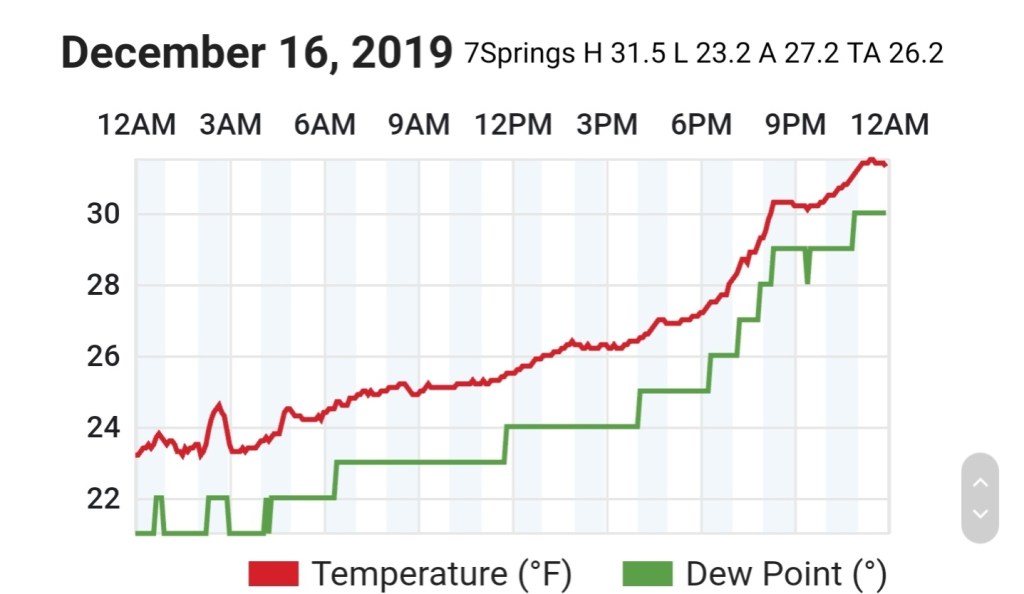
7Springs
MIN[23.2]—MAX[31.5]—AVERAGE MEAN[27.2]—TRUE AVERAGE[26.2]
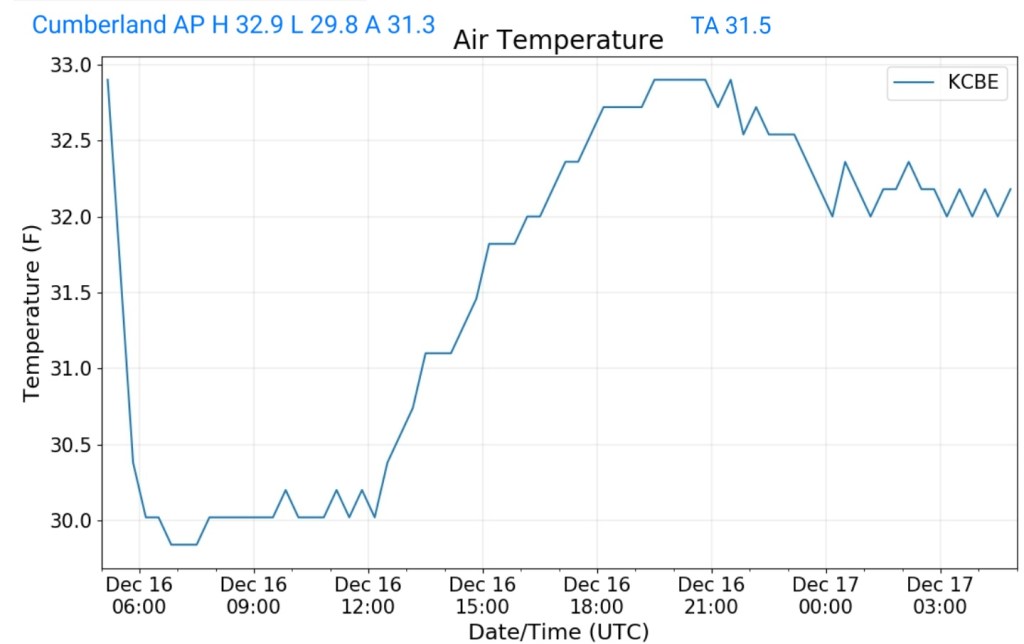
Cumberland Airport
MIN[29.8]—MAX[32.9]—AVERAGE MEAN[31.3]—TRUE AVERAGE[31.5]
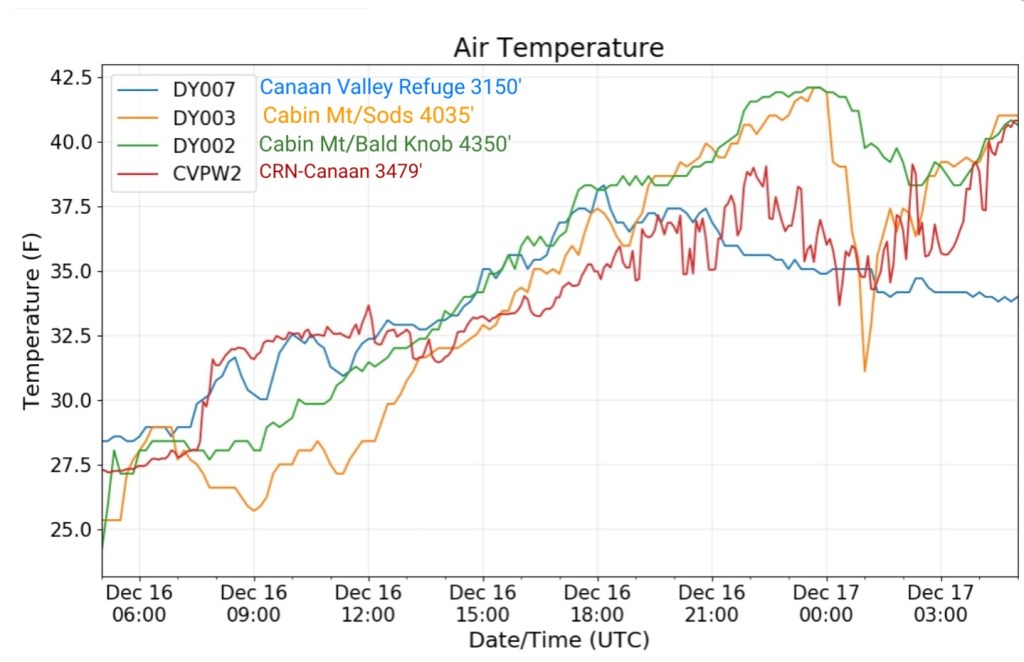
The Valley vs Cabin Mt
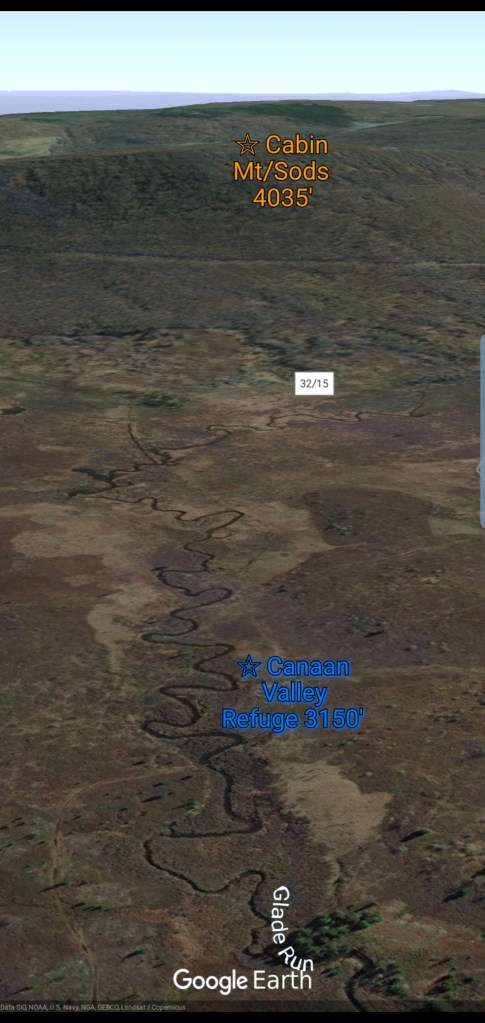

Canaan area temps
Comparison view

RTMA
Radar
Satellite
Flow
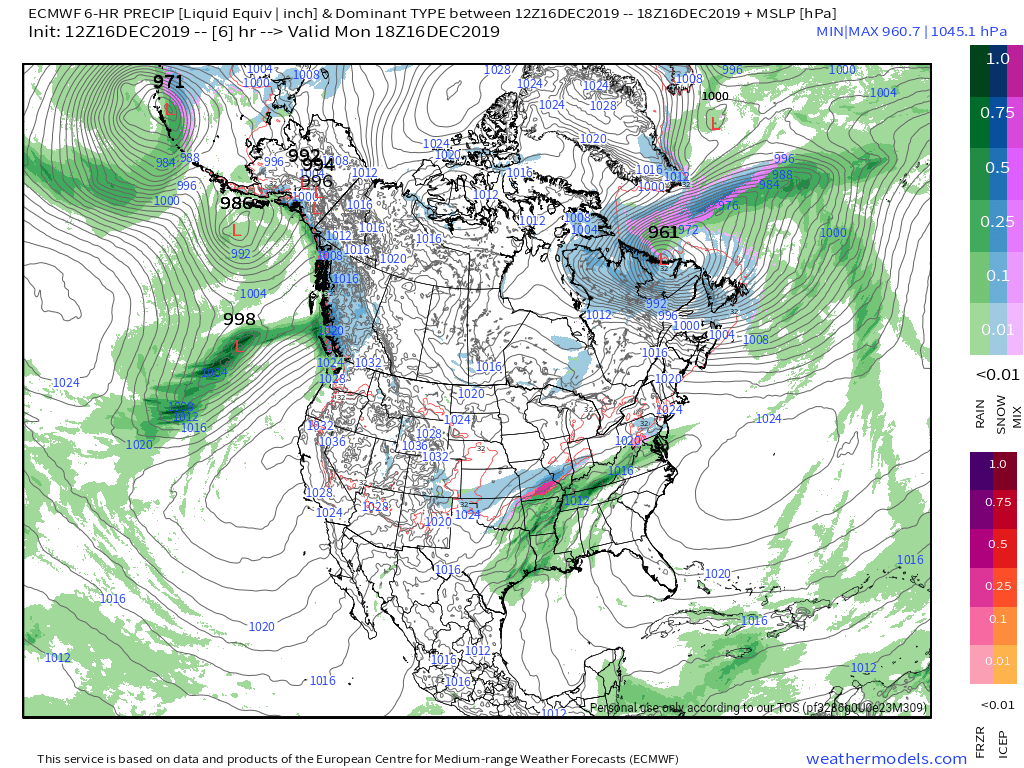
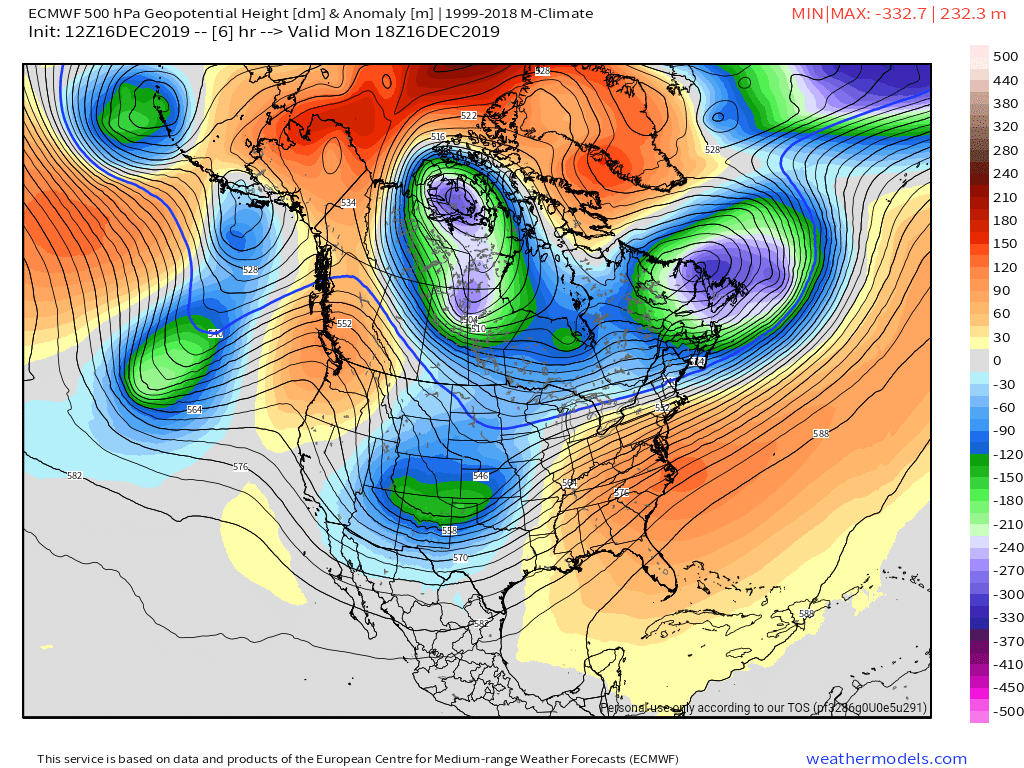
Surface features and 500mb height anomalies and flow
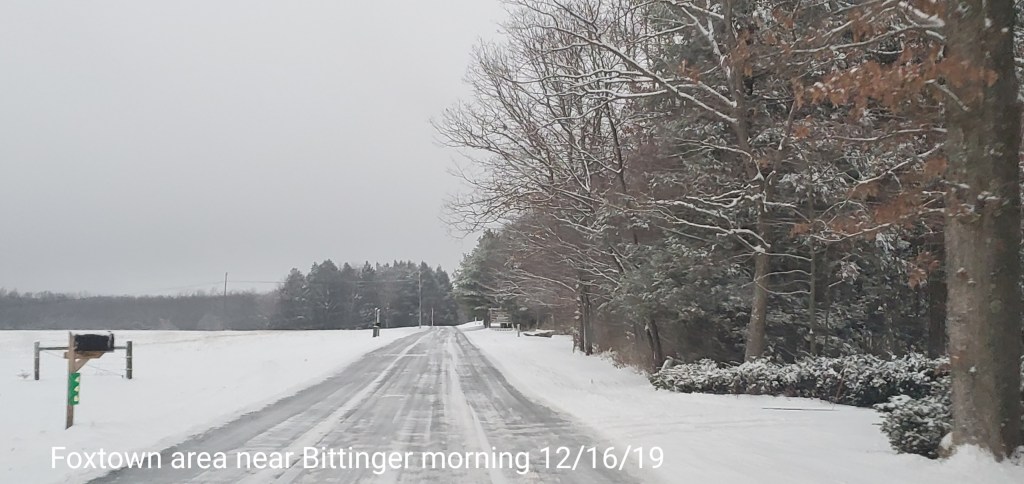
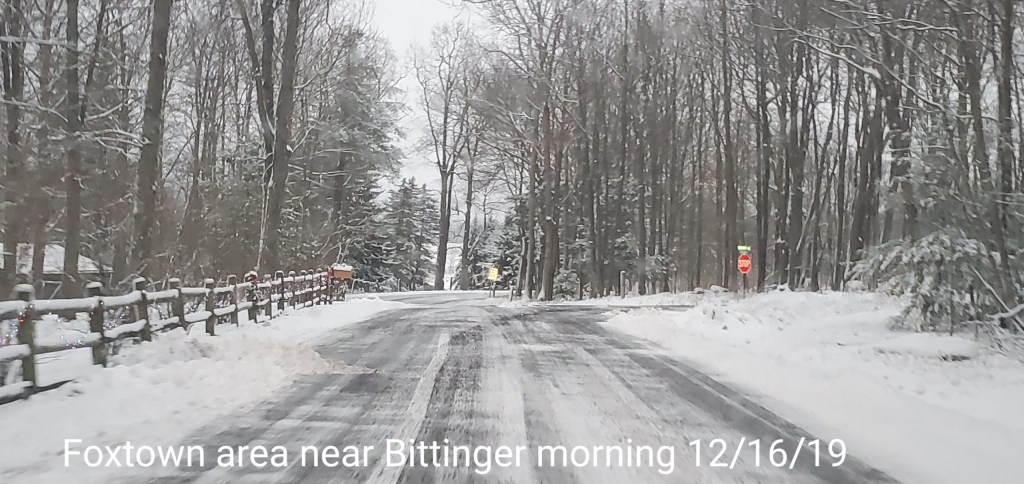
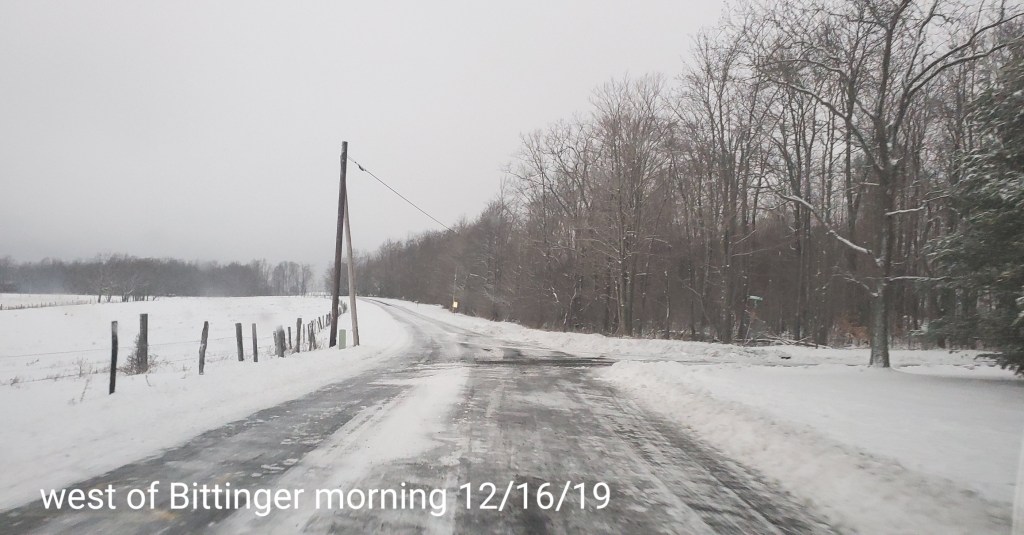
pics to come-
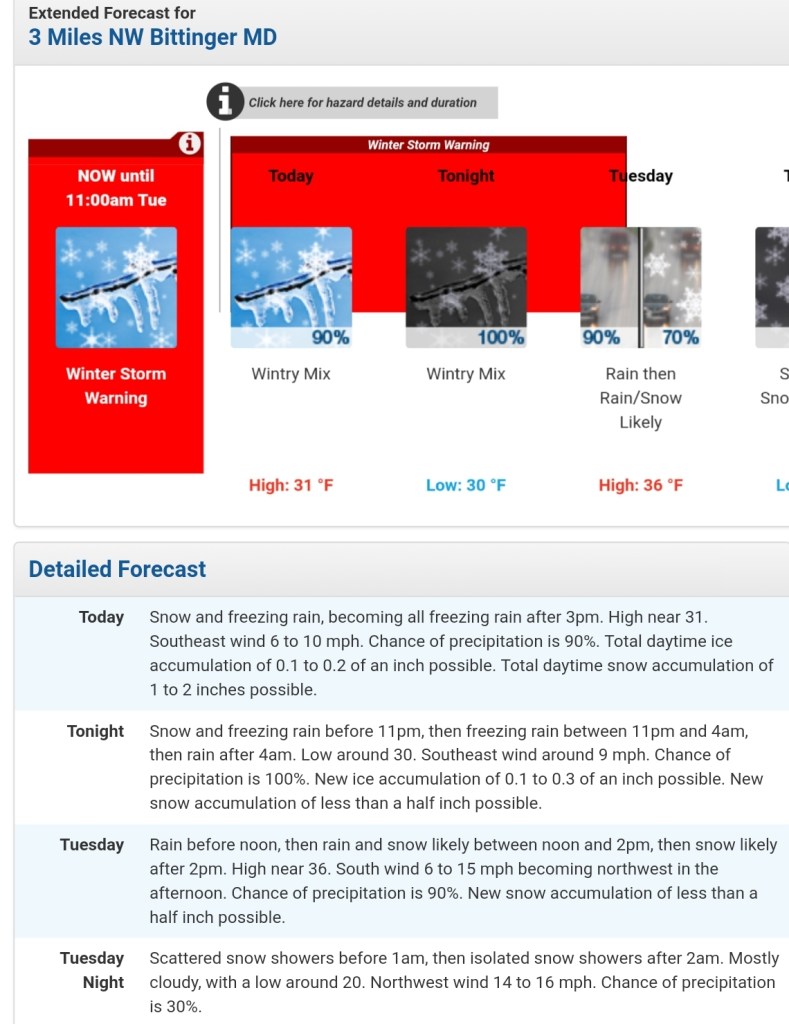
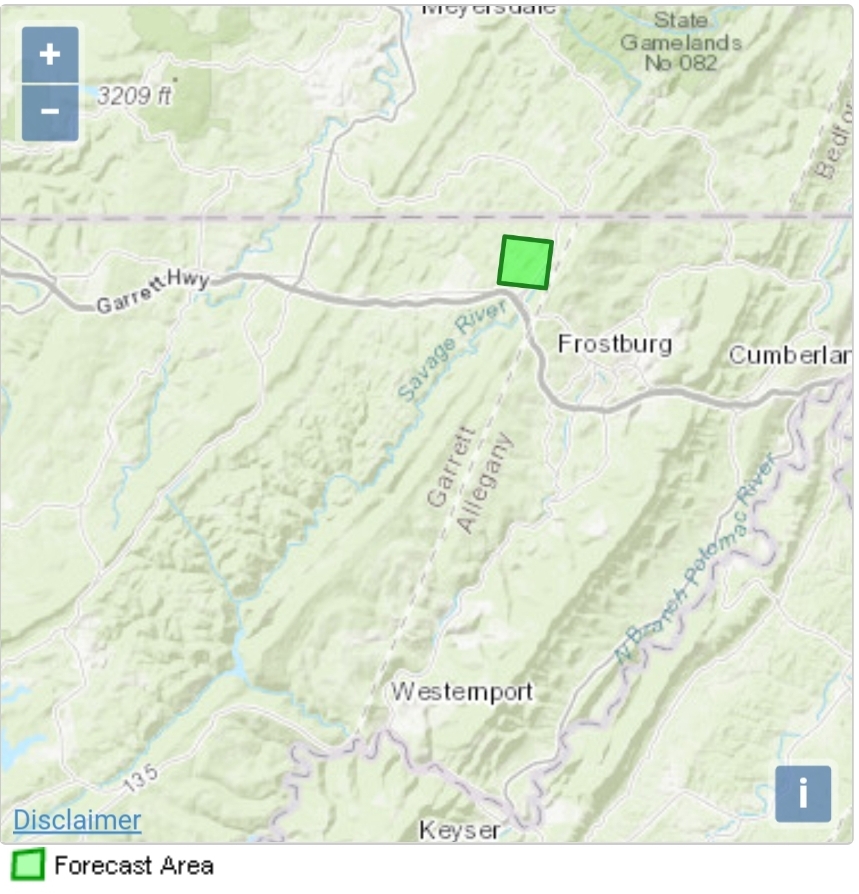
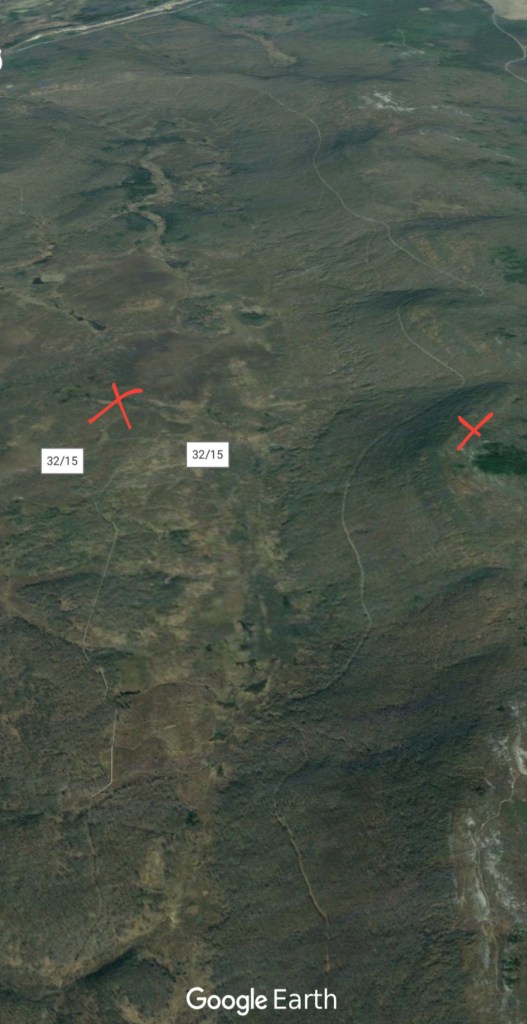
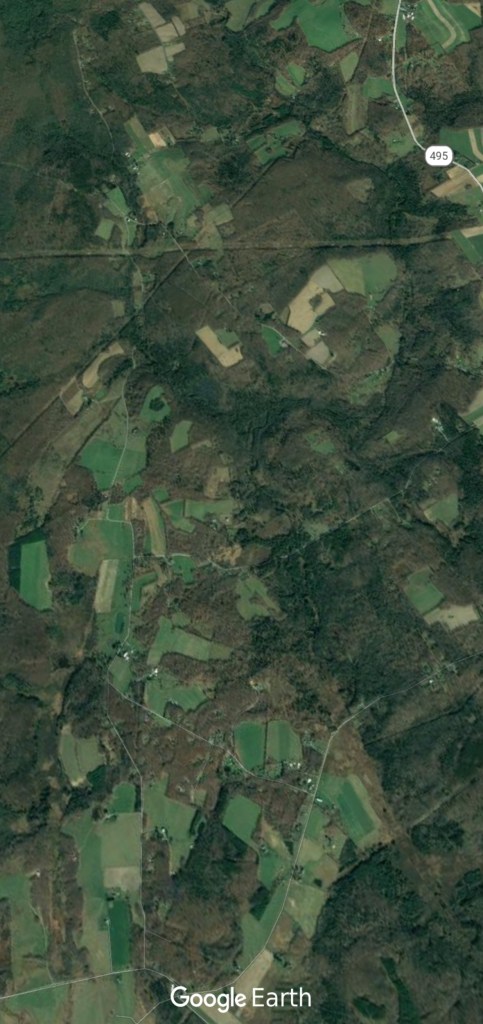
Bittinger area


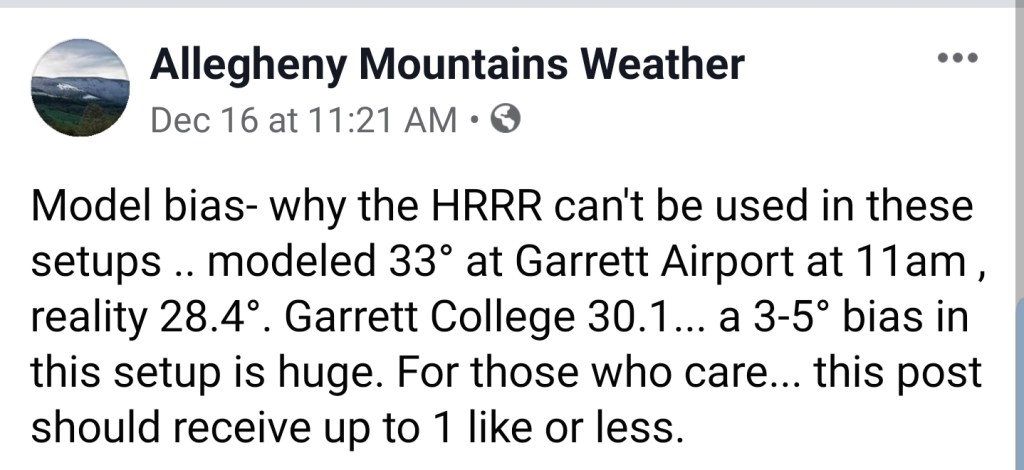
Model evaluation-
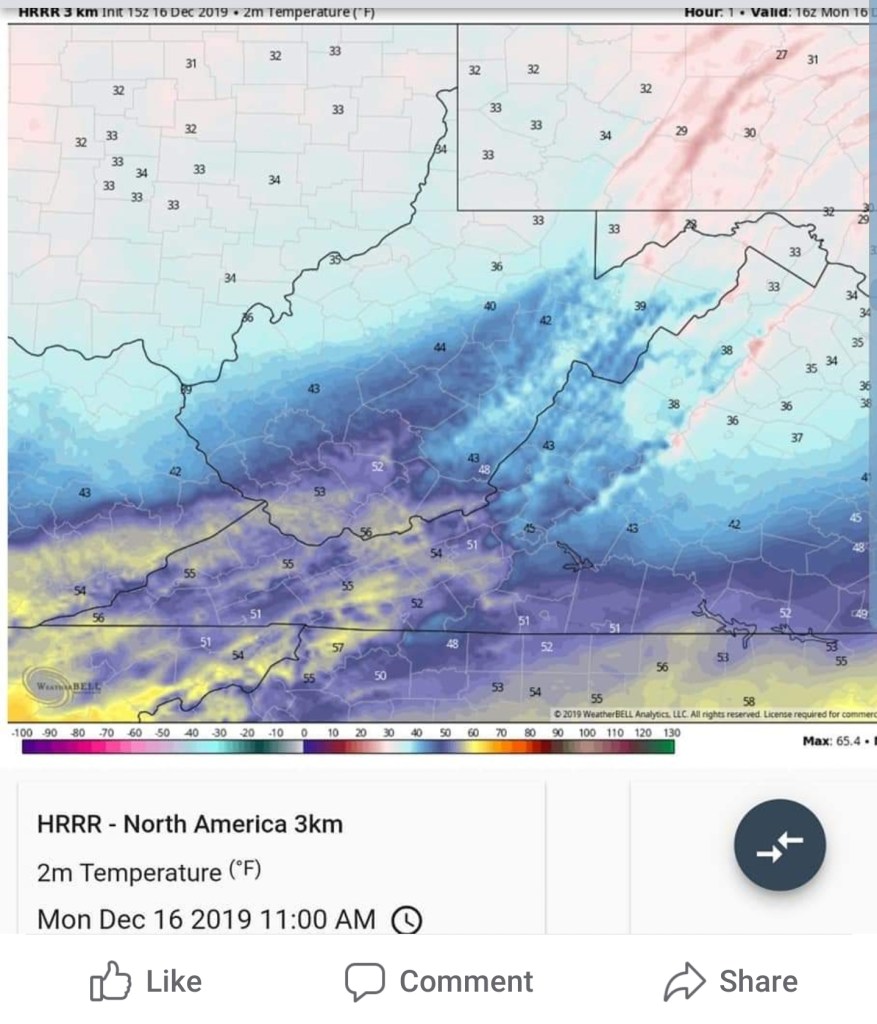
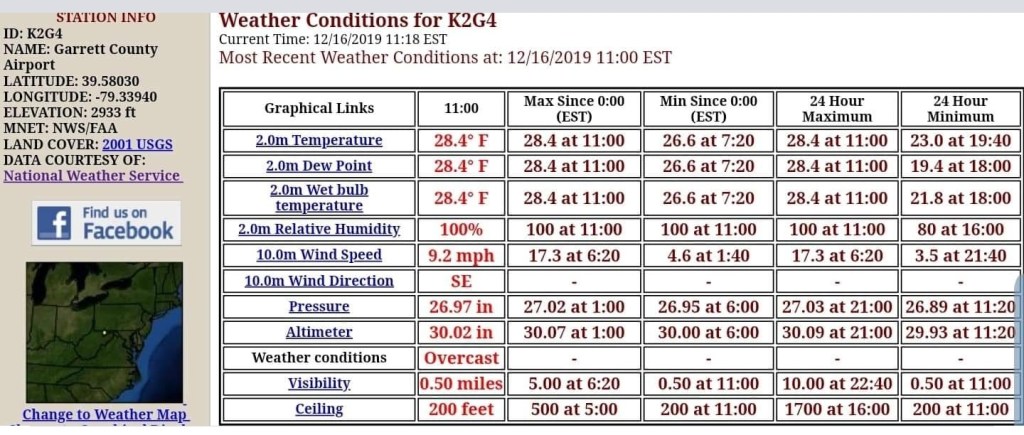
This has been pointed out time and time again on just how horrible the HRRR model is. The notorious warm bias exist every time. Sometimes as much as 4-8. The model does not even initialize right. Its flat out terrible. Today it had a 3-5° warm bias to start the run. Sadly the new upgraded GFS look to have that same bias although there is not a lot of examples that with it, however today was one. It went way to warm and the area would have avoided any ice issues had the GFS been correct. In reality, the worst ice storm in years.
Hrrr
Morning update:
7am, the snow aspect across the high ground is and in some cases has wrapped up. Now the lull phase. Overall, precip in what is expected to be the highest impacted ice zones should be fairly light, pockets of steadier precip then backs off through much of the day today, and then increasing later. Freezing rain looks fairly light during the morning and early afternoon hours.
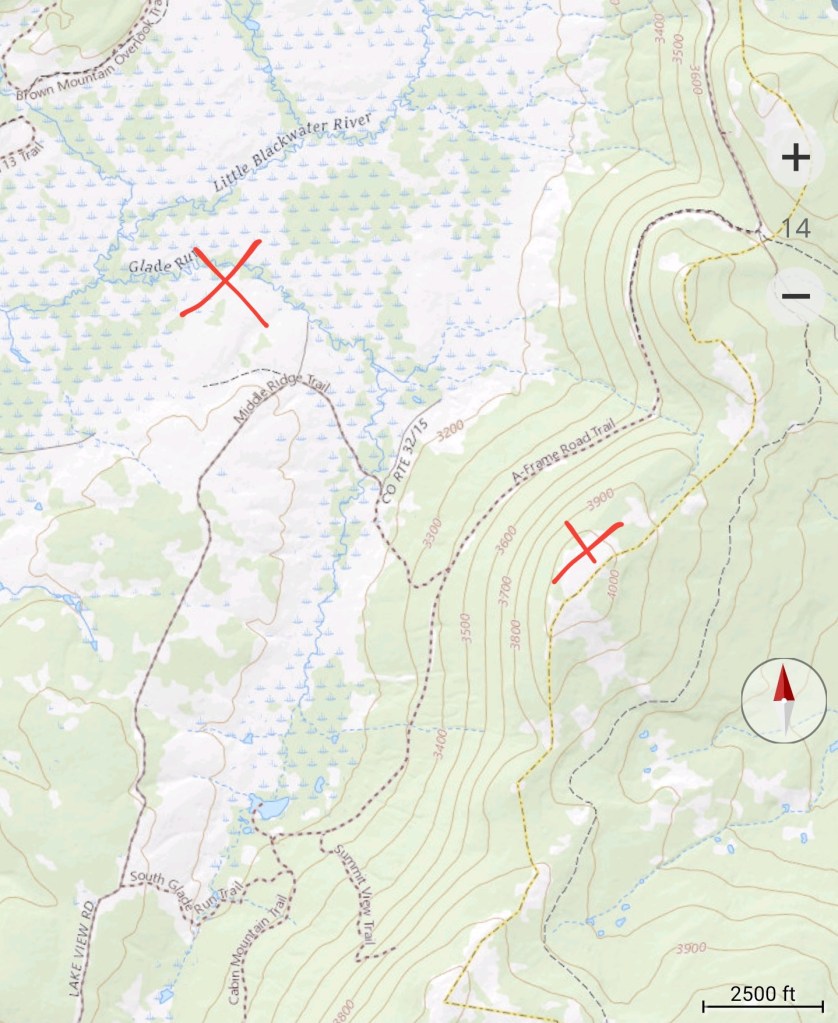
By later today into the overnight, temps along the Allegheny Front, into central Garrett and points east, northeast look to drop 2-3°, from daytime maxes today that may briefly eek above freezing. At this time, precipitation is on the increase. The most significant icing may occur in the hours of 4pm to 4am in these areas. Especially the higher east facing ridges. This could be significant icing in those areas. Ice will occur outside of this zone, this is circled for greatest impact zone.
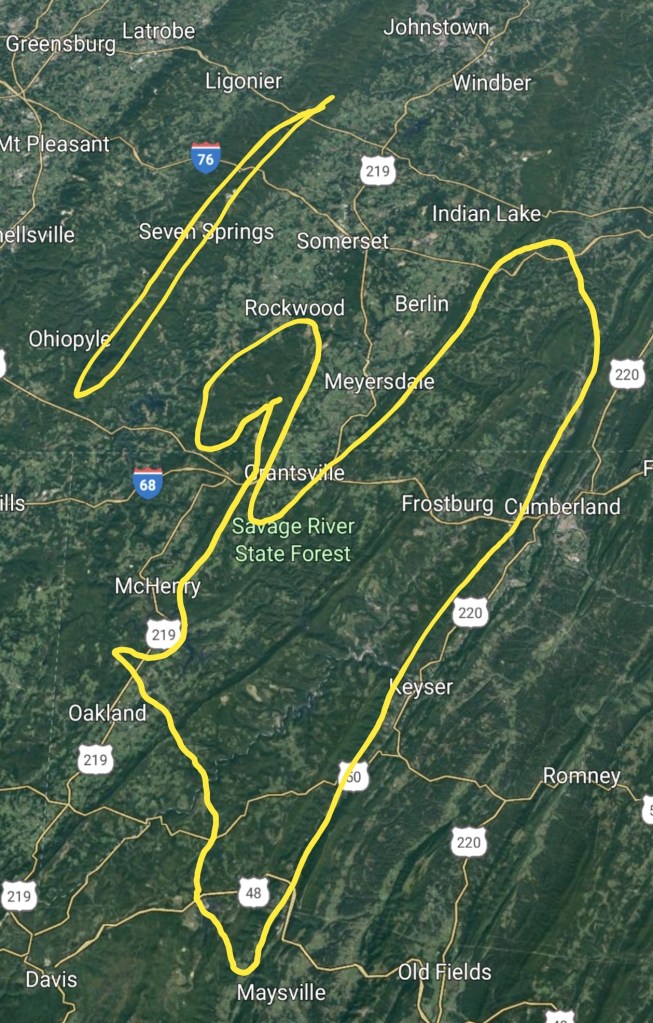
East facing ridges could see in excess of .5 total ice accretion as we go through tonight.
The WPC outlook looks as follow:
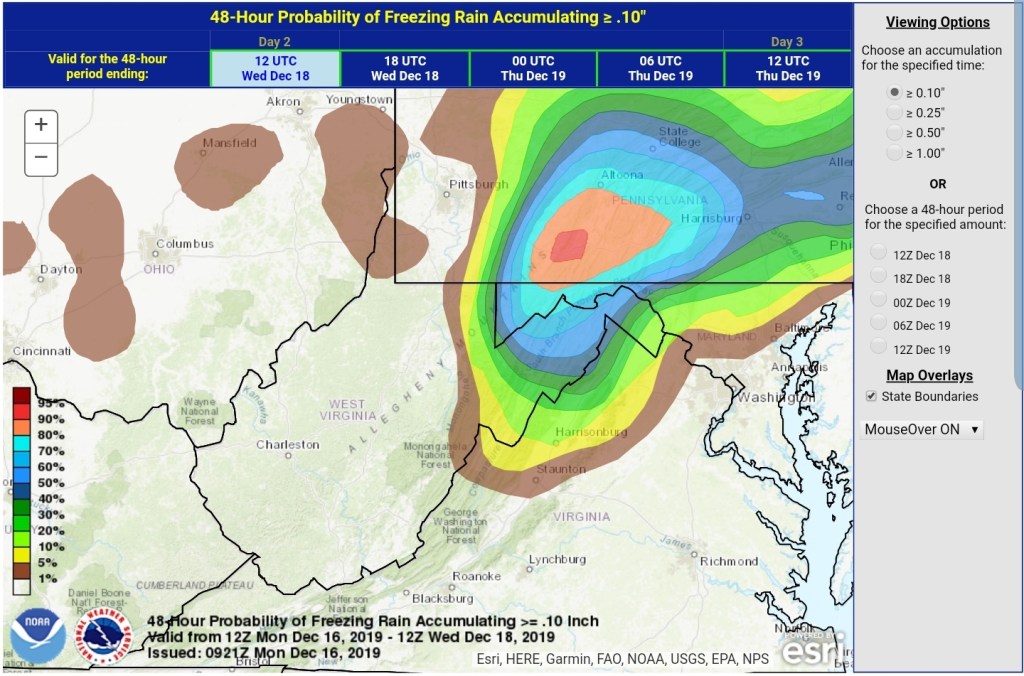
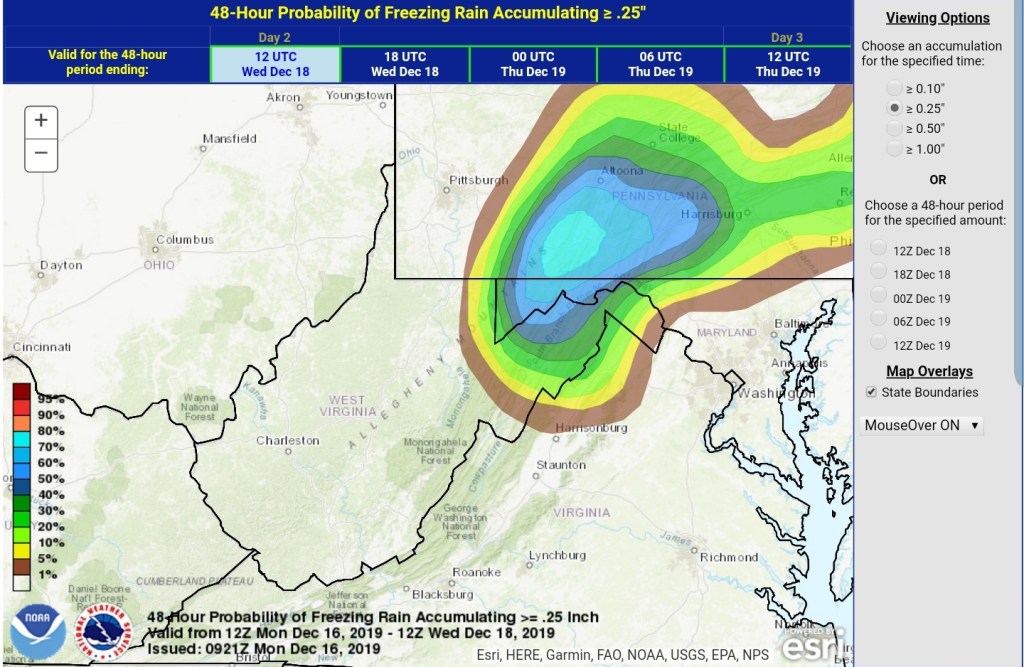
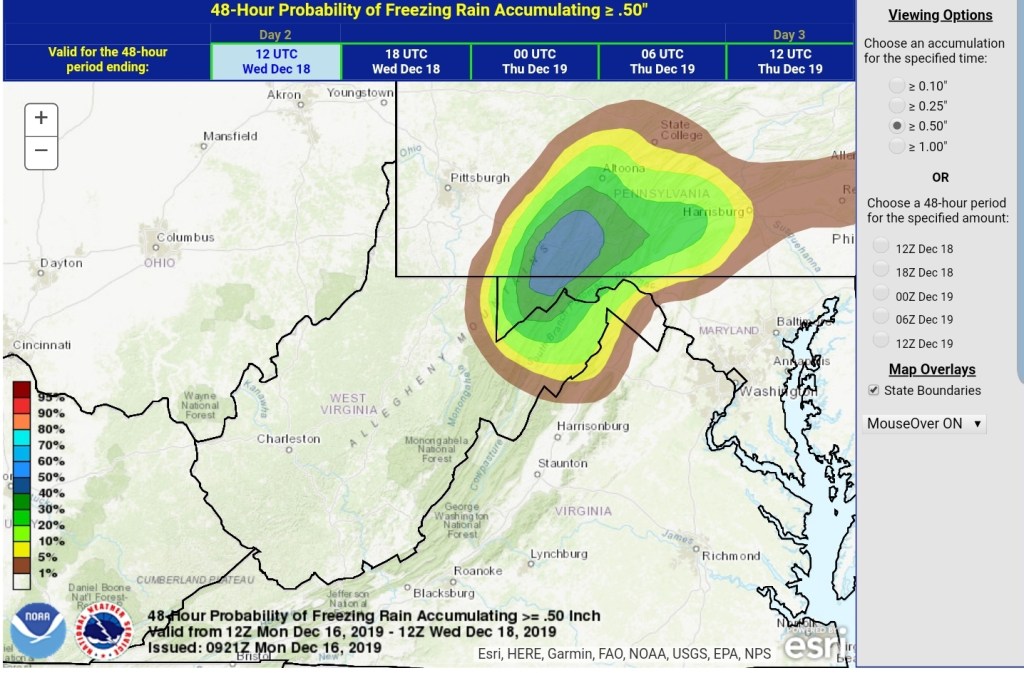

The models, the model parameters for freezing rain are consistently overdone. In a marginal temperature setup and moderate rain+, not everything freezes as it falls. Some is able to run off before freezing. Models do not factor that and will overdo ice amounts. With a east wind, those high east facing ridges get aided by the wind in freezing more of the rain. That said, model rundown
My favorite in the setup the
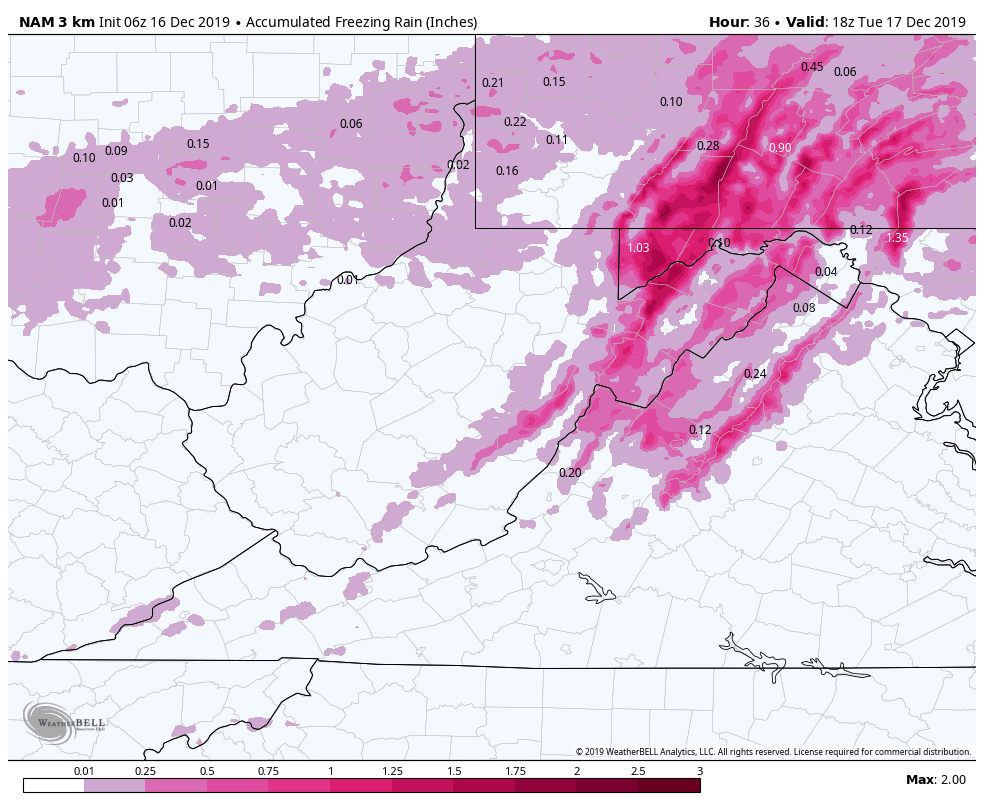
6z 3km Nam
2m temps
6z ICON
2m temps
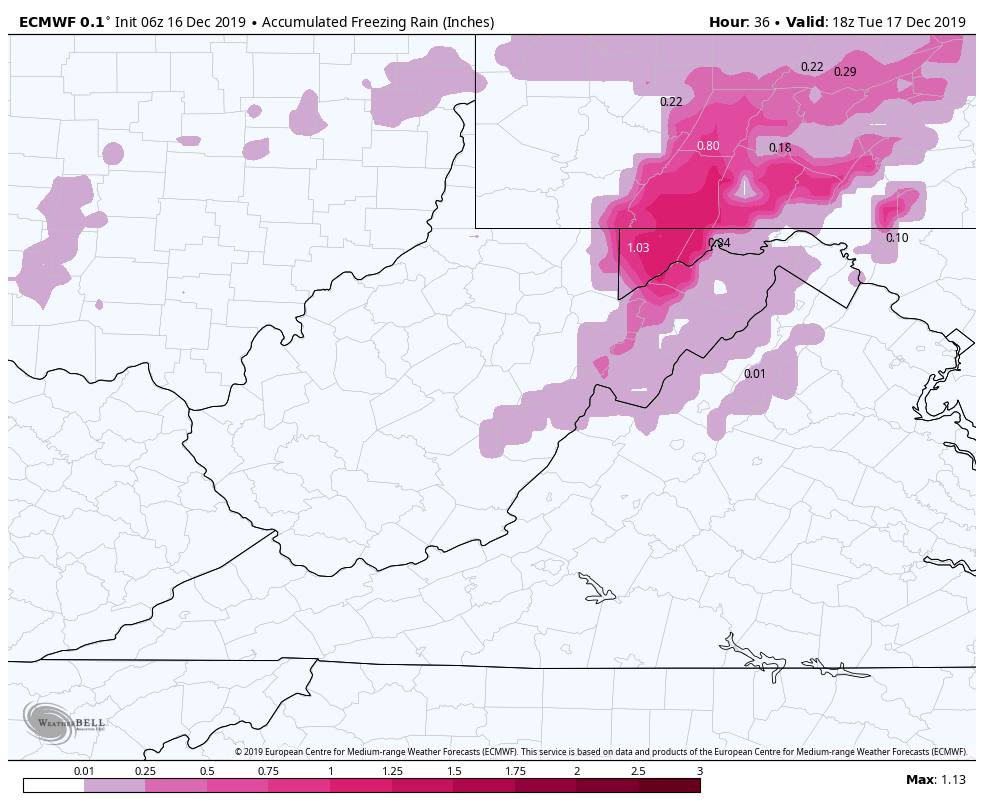
6z ECMWF
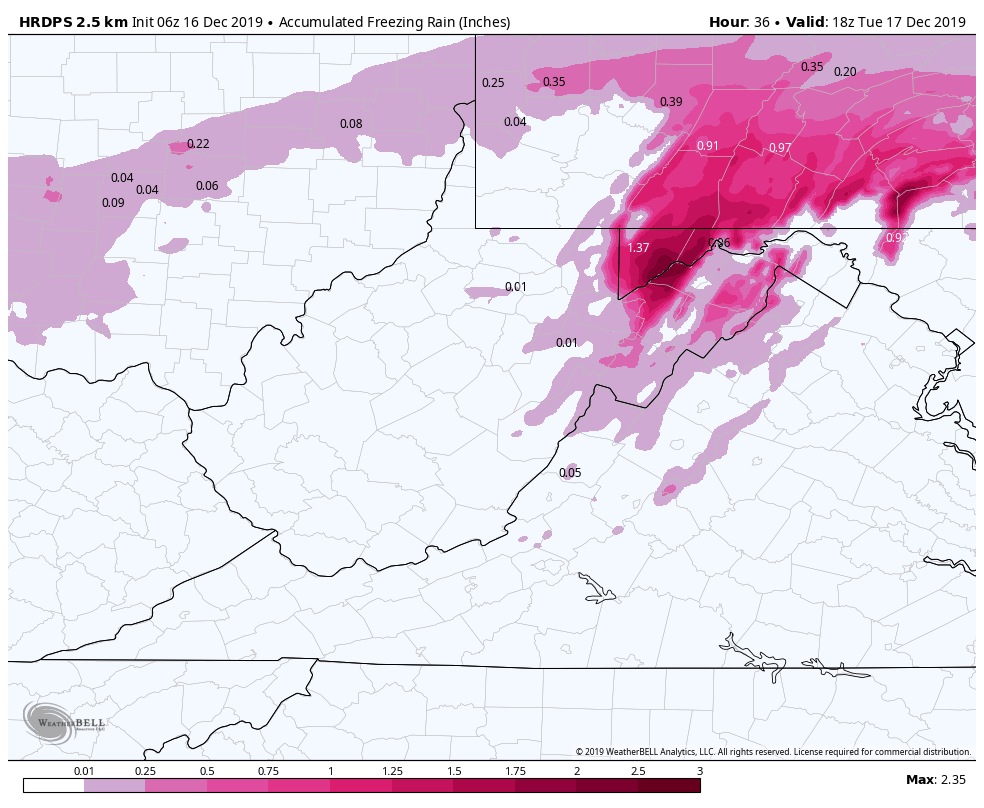
6z HRDPS
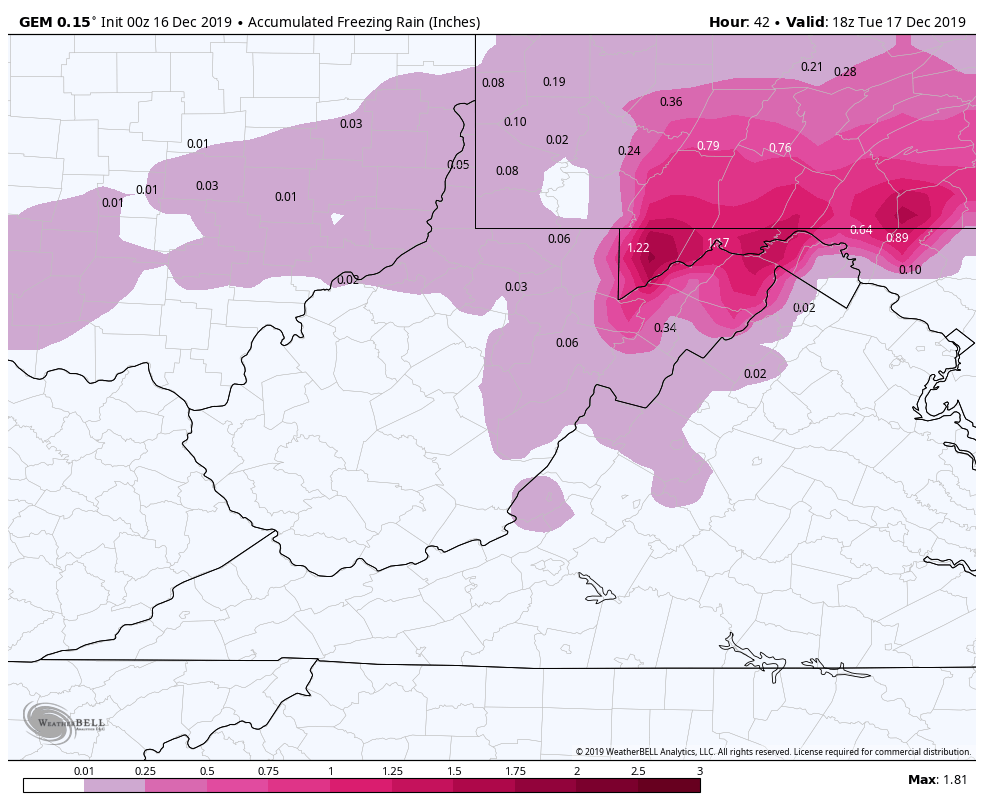
6z HDPS Canadian
6z ECMWF
MSLP/6HR/PRECIP
Will get to the GFS in a bit..
Ice amounts off the models. Again, these are overdone but still suggest significant icing. Also more expansive than reality will have it. Model product listed within the image.
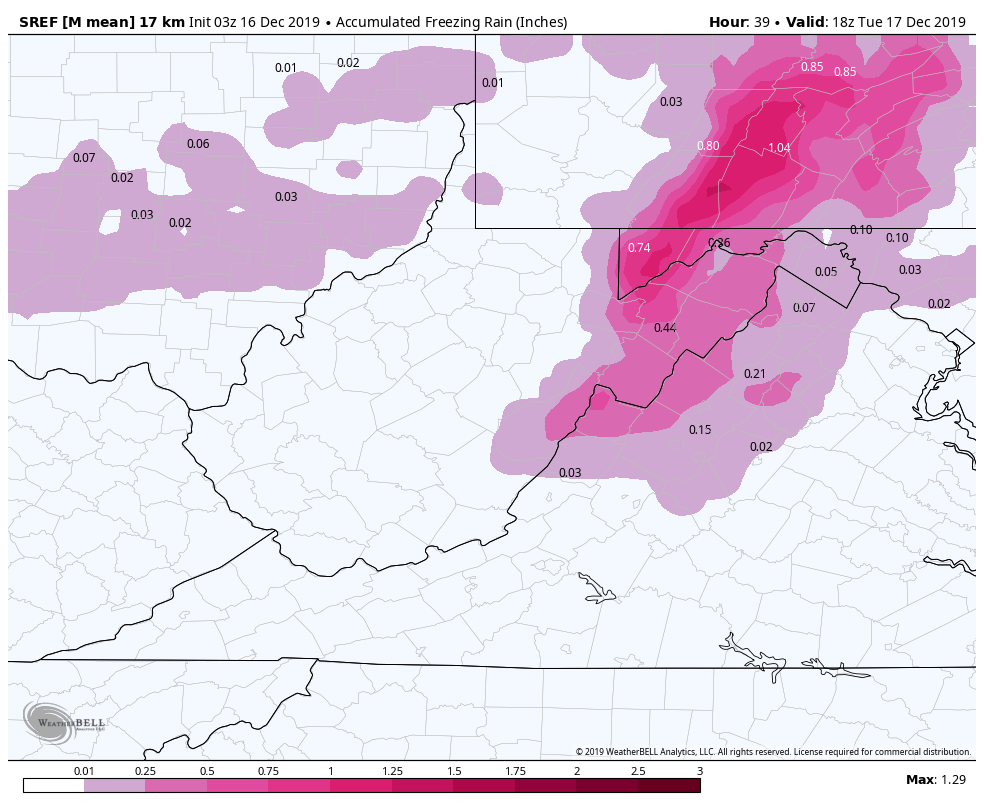

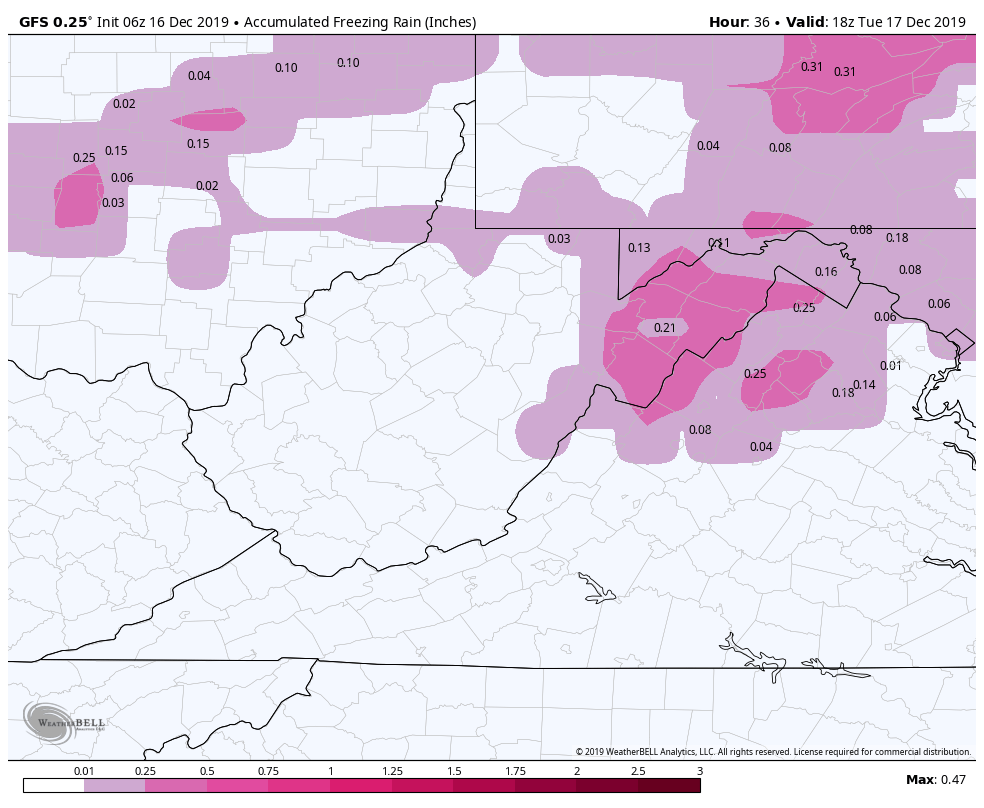
Ok, those are some bonkers amounts that are overdone. Now we jump to the GFS. The 6z in this case but it doesn’t matter. Every GFS run has been warmer, and brings very little ice. This is the upgraded GFS, and its either scoring big points here beating every model or its falling to the same fate as the HRRR and has a notoriously warm bias with these setups. I am mainly posting all of these to look back and see the model bias after the fact. Models are tools, with biases.
6Z GFS
2m Temps
Ice off the GFS…what ice? Minor event
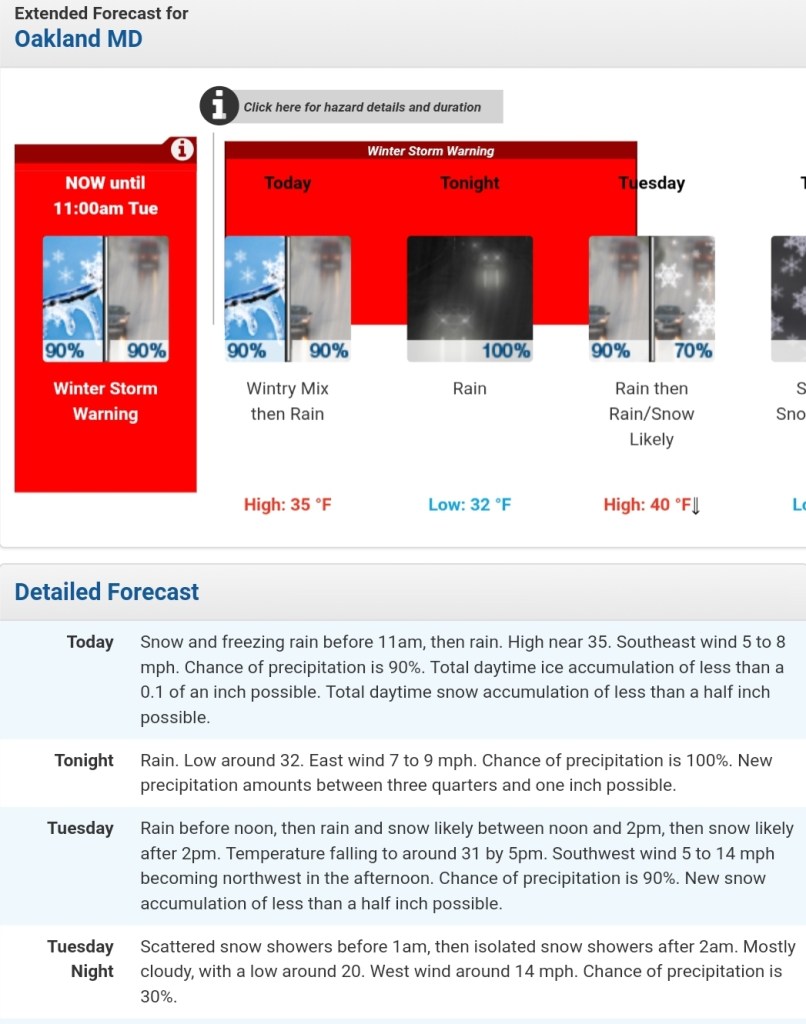
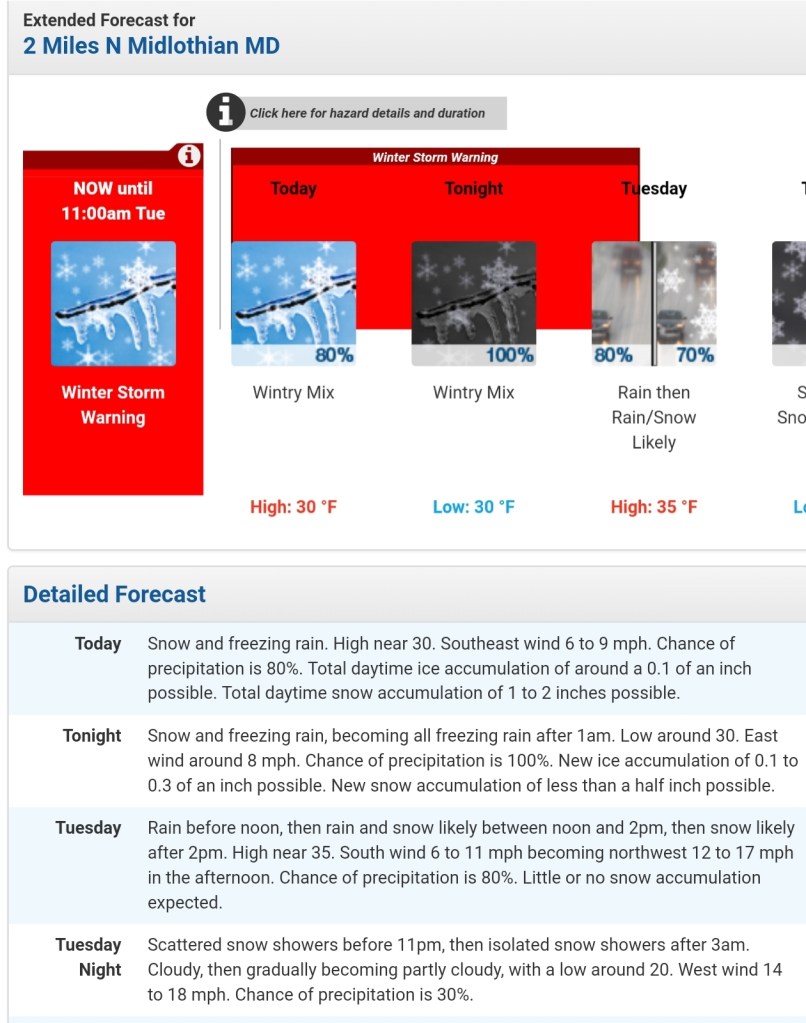
Some NWS point and clicks in the ice zone. Much better on timing now.