December 28, 2019
Dec 28(Sat)
Clouds thinning to a high overcast and thinning by evening. Stars visible. A brief but rapid Valley cooling occured before cloud cover and light winds returned overnight.
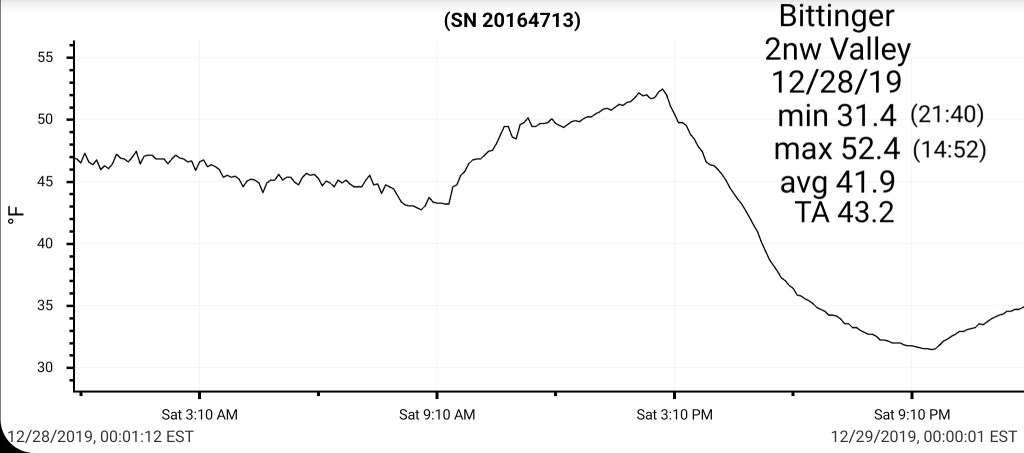
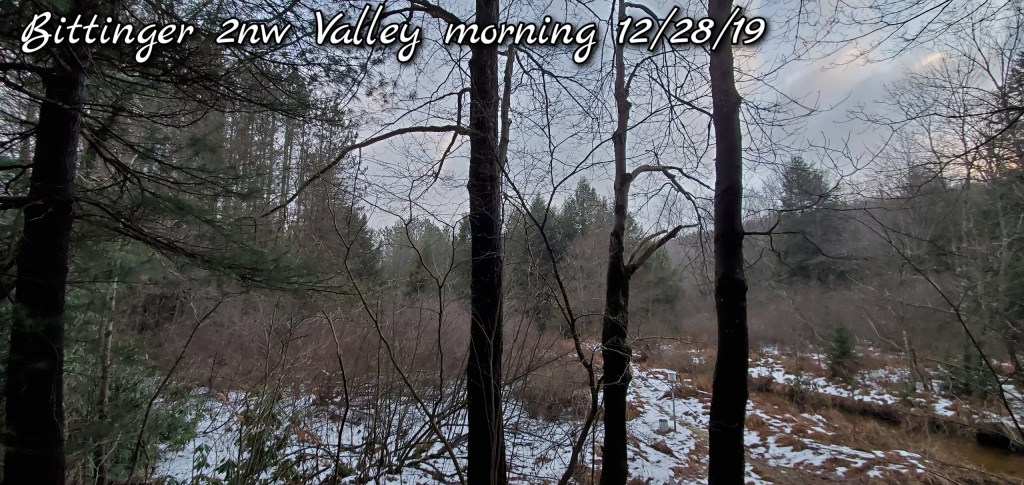
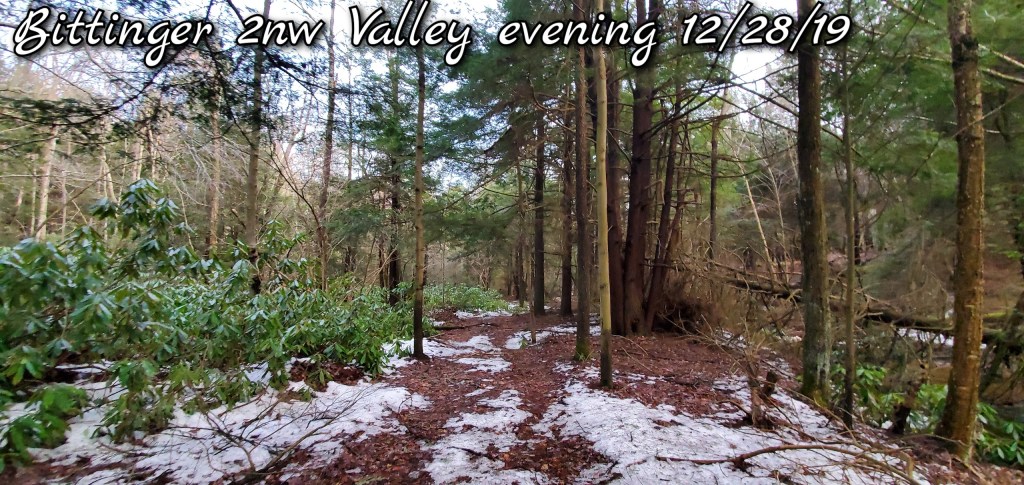
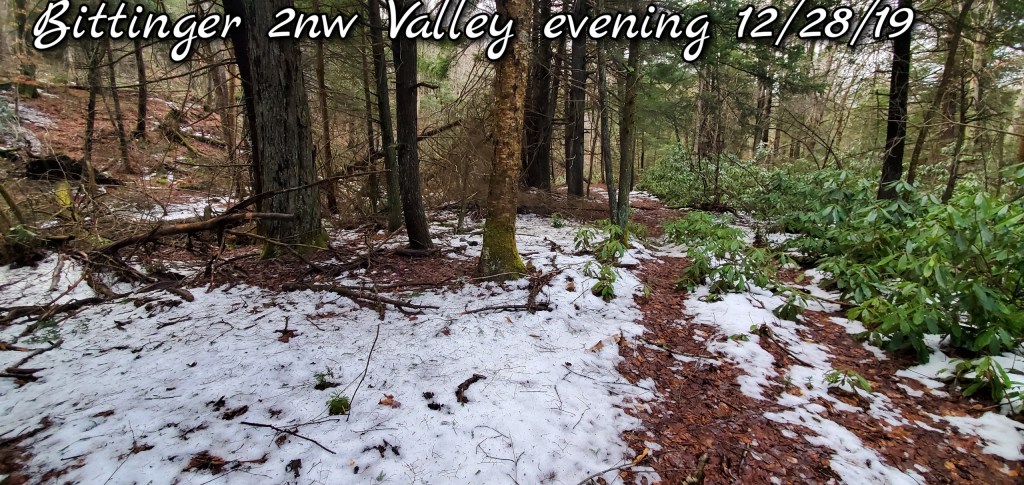
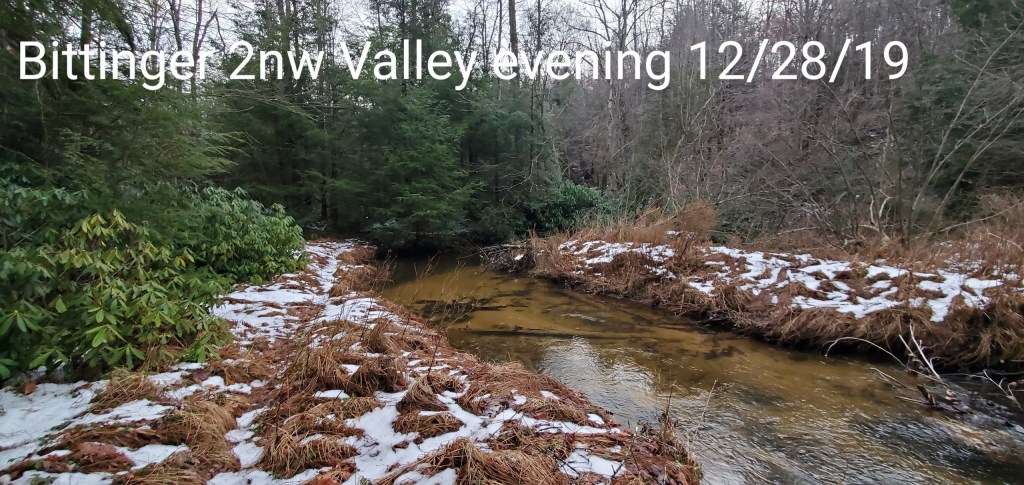
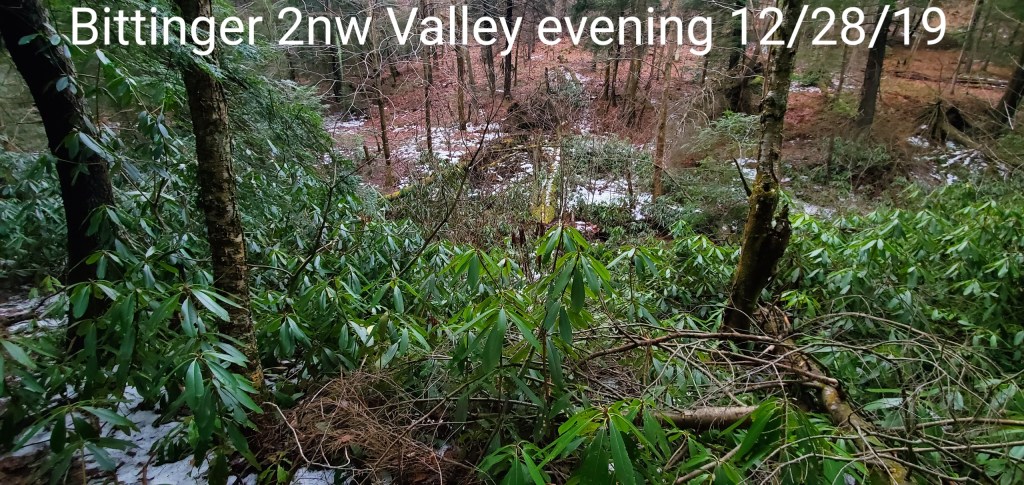
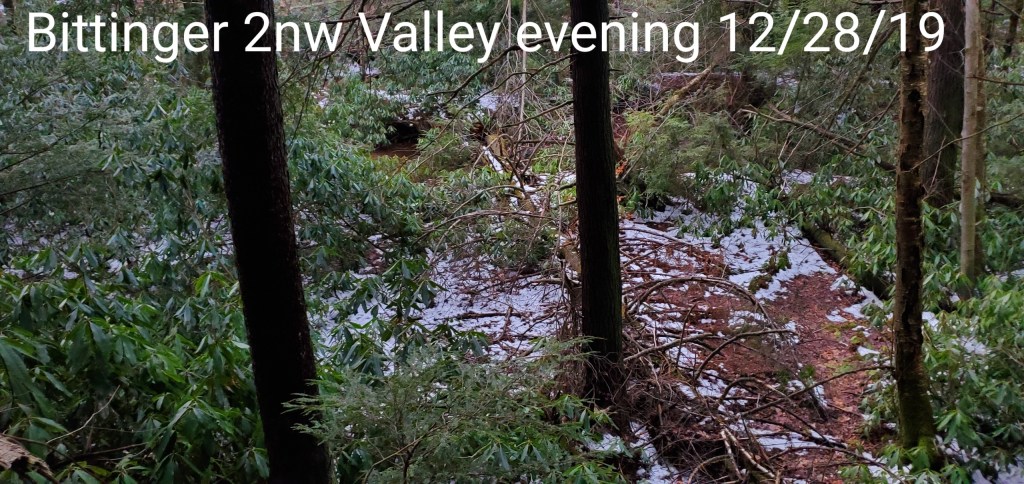
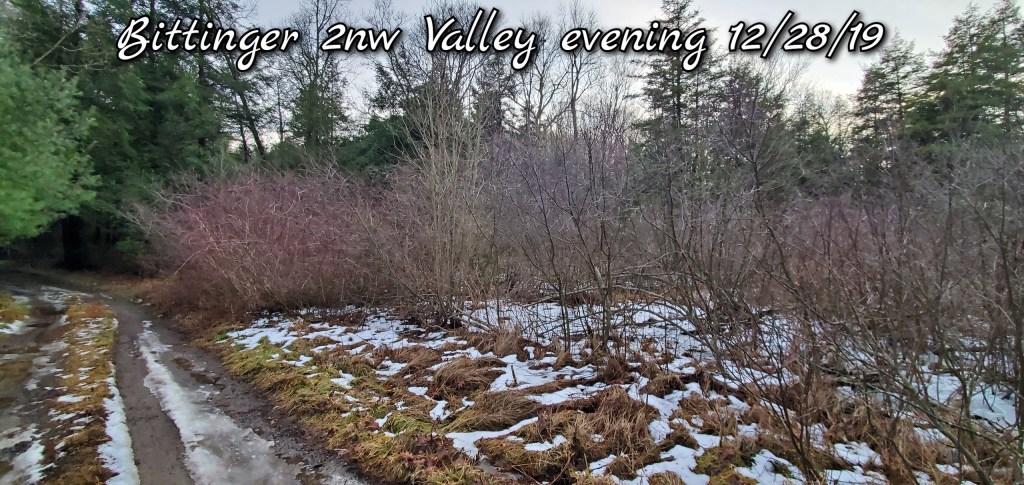
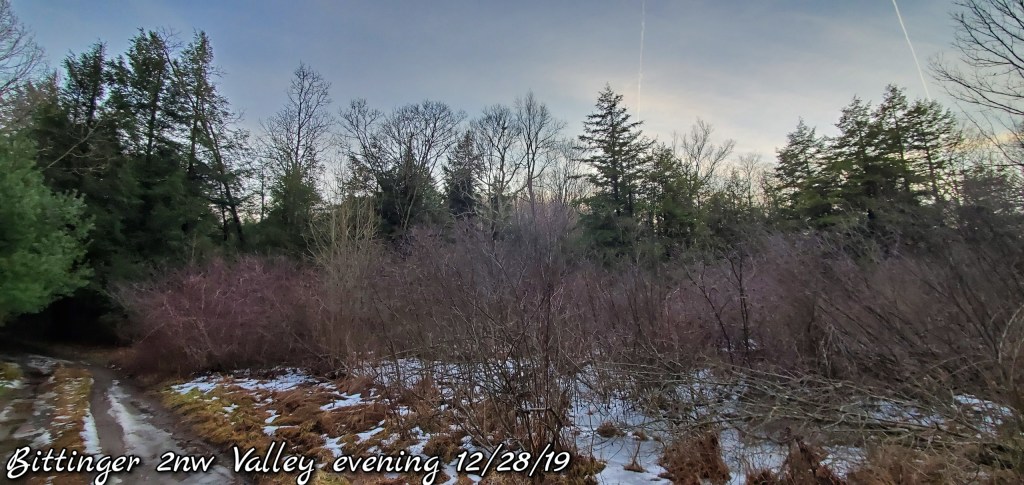
Bittinger 2nw Valley
MIN[31.4]—MAX[52.4]—AVERAGE MEAN[41.9]—TRUE AVERAGE[43.2]—PRECIP[T]7am
Snowfall season to date 20.8″
Garrett College
MIN[41.6]—MAX[58.3]—AVERAGE MEAN[49.9]—TRUE AVERAGE[48.4]—PRECIP[0]

Canaan Heights/Davis 3SE
MIN[43.0]—MAX[57.0]—AVERAGE MEAN[50.0]
Snowfall season to date 28.6″
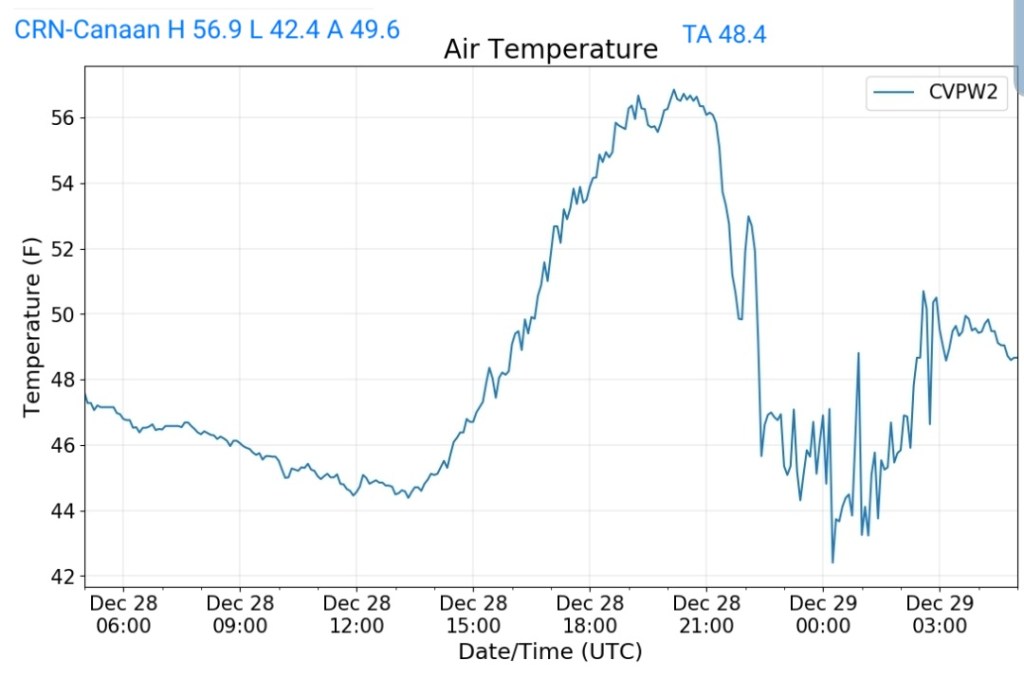
Climate Reference Network Canaan
MIN[42.4]—MAX[56.9]—AVERAGE MEAN[49.6]—TRUE AVERAGE[48.4]—PRECIP[0]
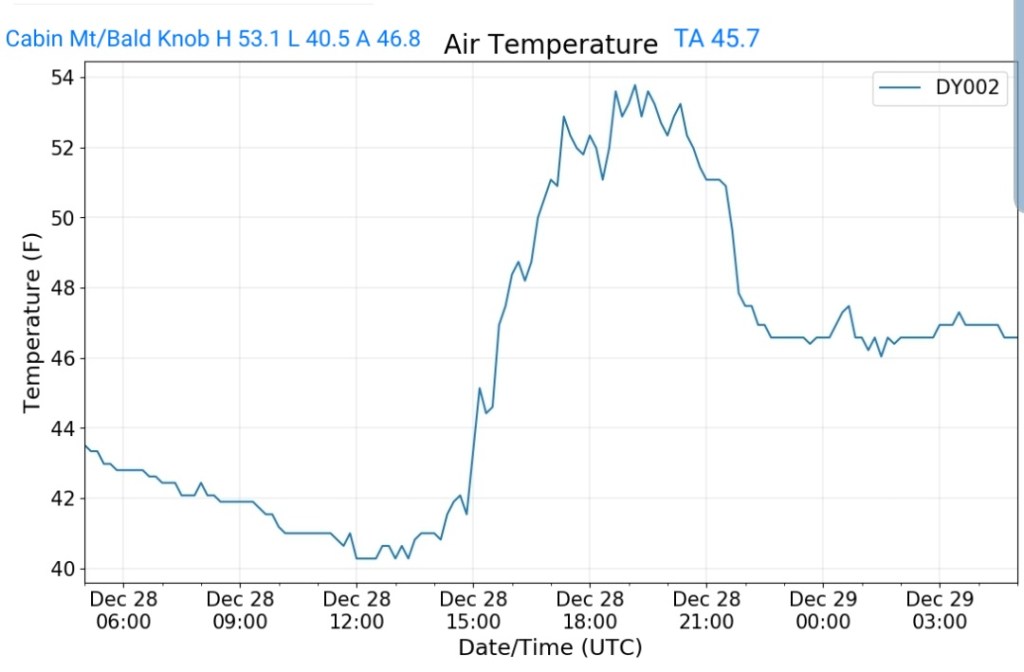
Cabin Mt at Bald Knob
MIN[40.5]—MAX[53.1]—AVERAGE MEAN[46.8]—TRUE AVERAGE[45.7]—PRECIP[0]
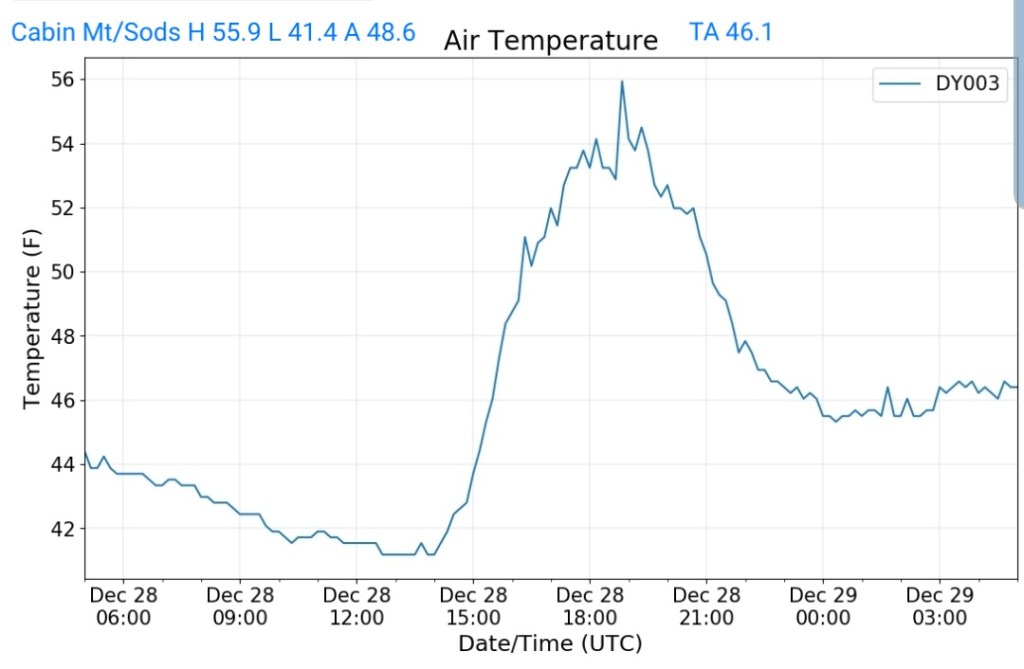
Cabin Mt-Western Sods
MIN[41.4]—MAX[55.9]—AVERAGE MEAN[48.6]—TRUE AVERAGE[46.1]
Spruce Knob
MIN[38.8]—MAX[51.6]—AVERAGE MEAN[45.2]—TRUE AVERAGE[43.8]—PRECIP[0]

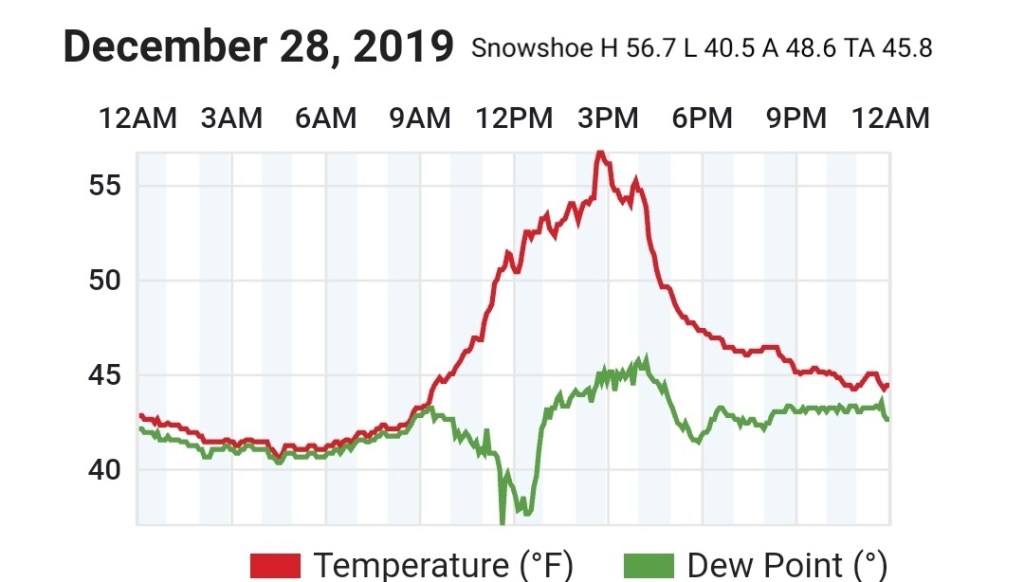
Snowshoe
MIN[40.5]—MAX[56.7]—AVERAGE MEAN[48.6]—TRUE AVERAGE[45.8]
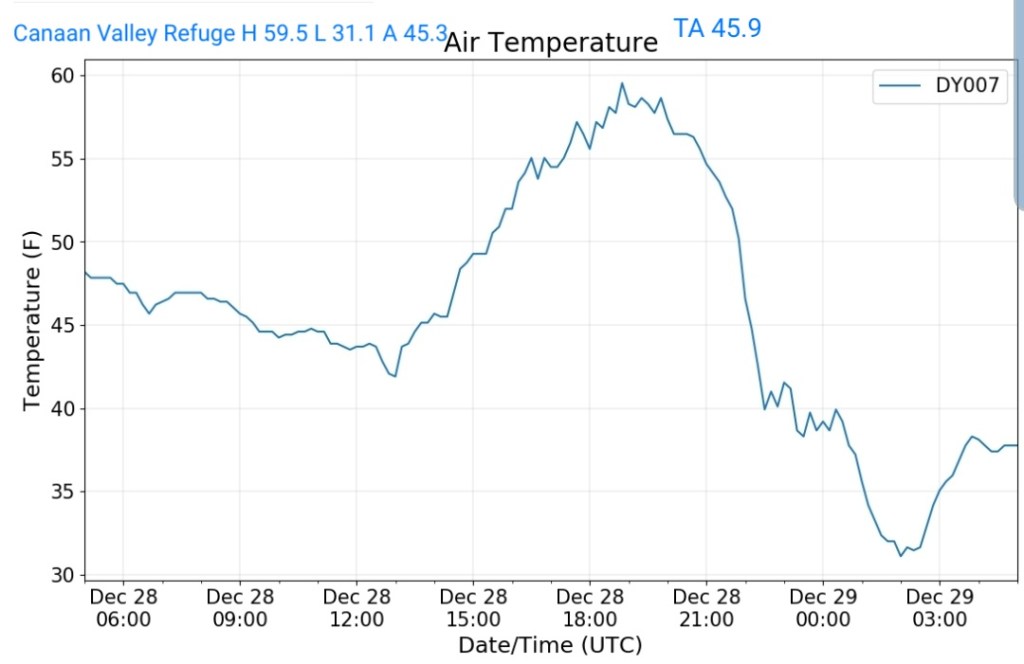
Canaan Valley Refuge
MIN[31.1]—MAX[59.5]—AVERAGE MEAN[45.3]—TRUE AVERAGE[45.9]
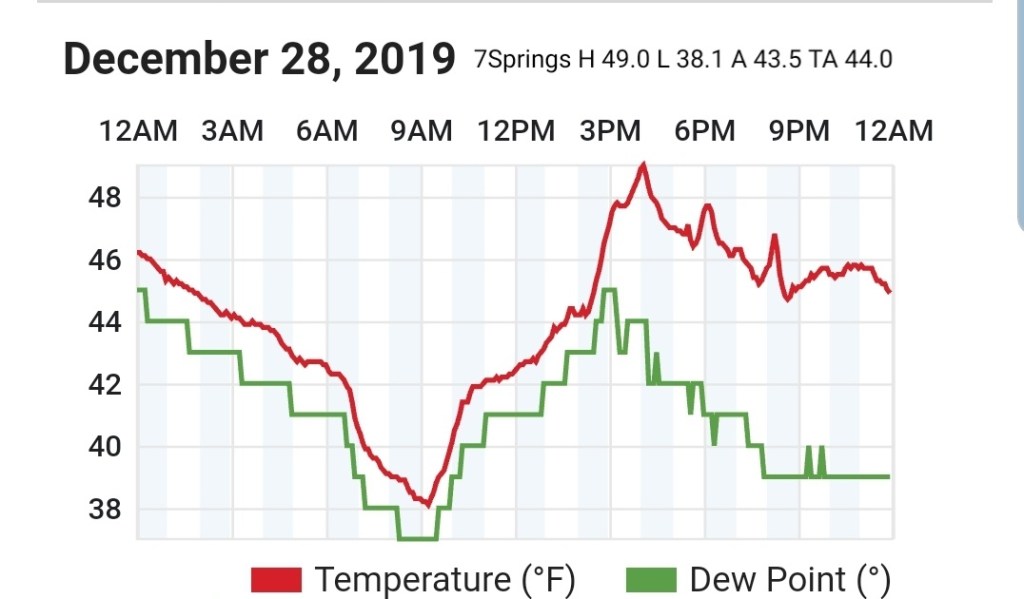
7Springs
MIN[38.1]—MAX[49.0]—AVERAGE MEAN[43.5]—TRUE AVERAGE[44.0]
Cumberland Airport
MIN[39.7]—MAX[62.6]—AVERAGE MEAN[51.1]—TRUE AVERAGE[48.7]

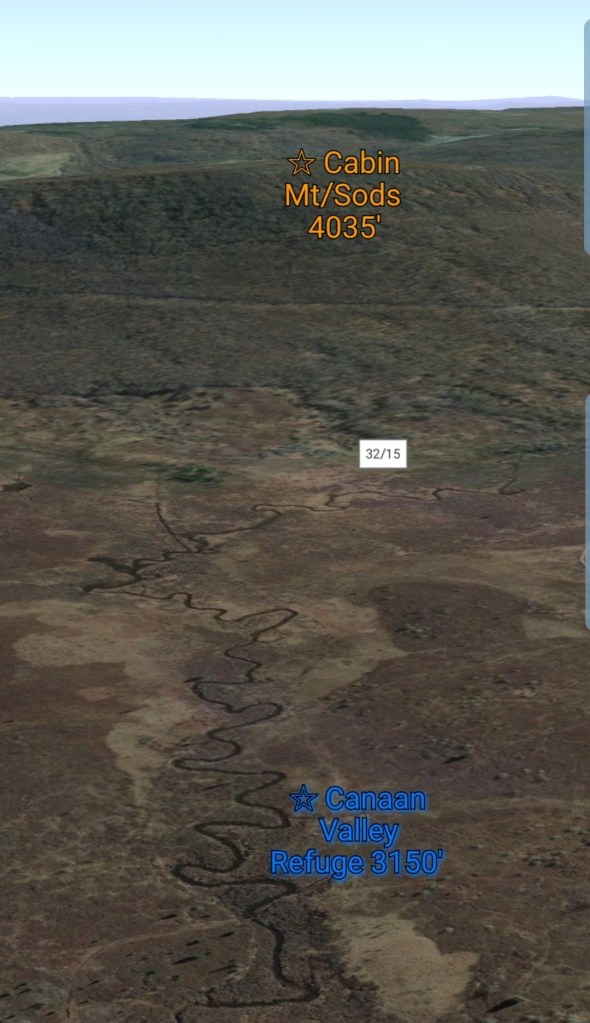
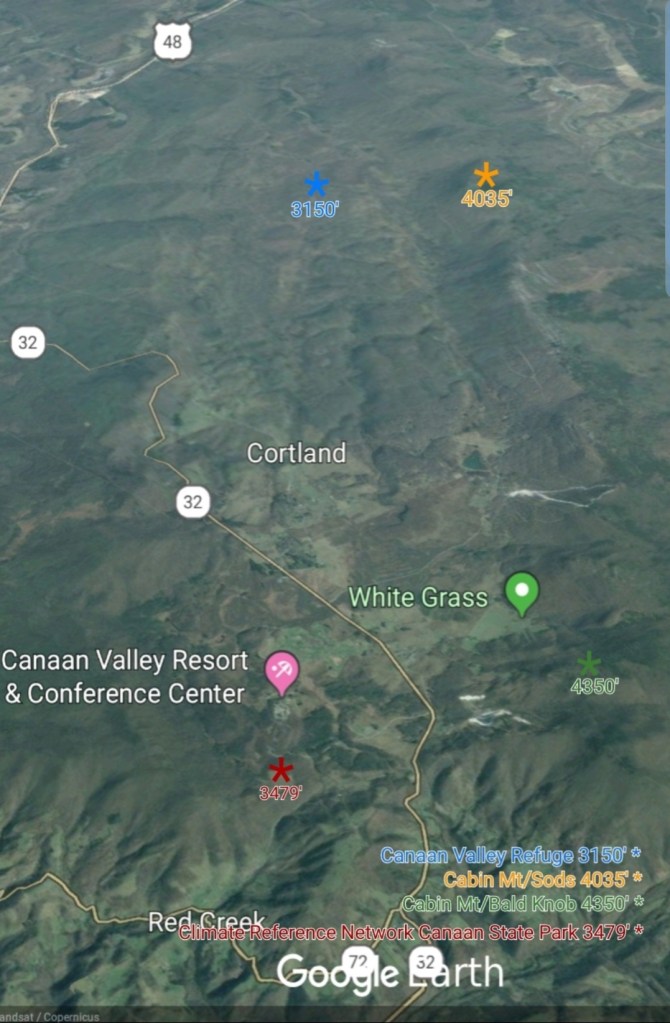
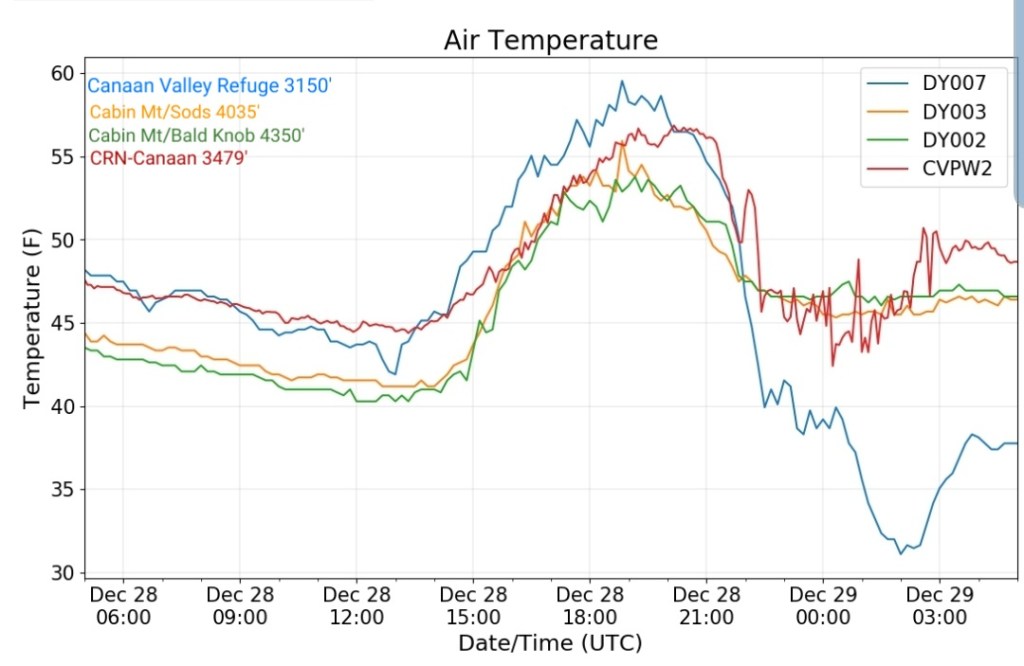
The Valley vs Cabin Mt


Canaan area temps
Comparison view
RTMA
Radar
Void of precip
Satellite
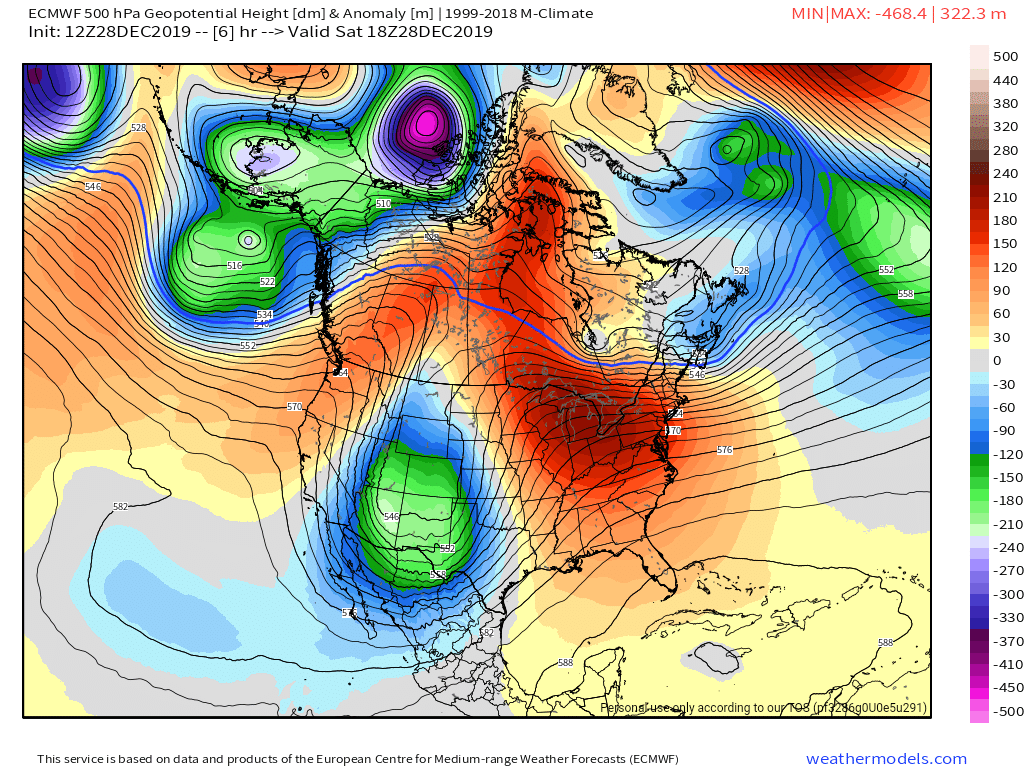
Flow
Surface features and 500mb height anomalies and flow

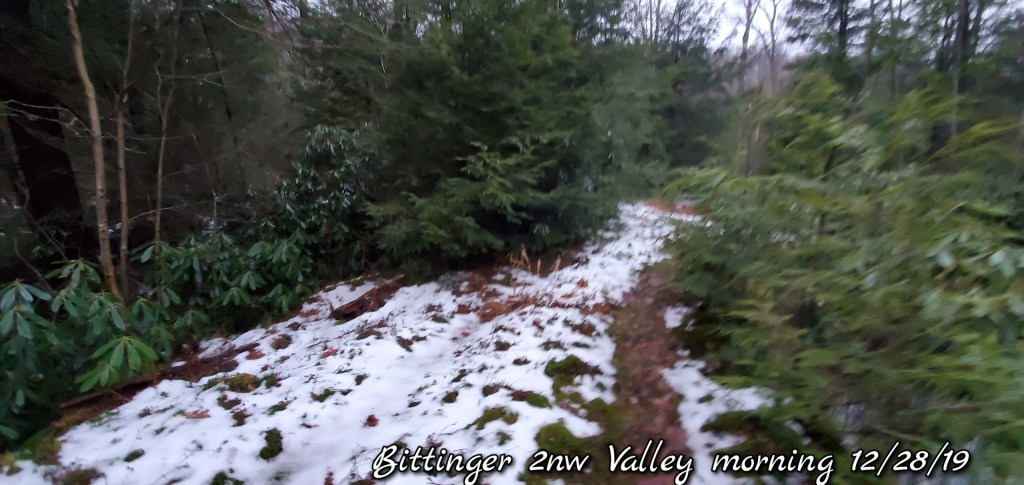
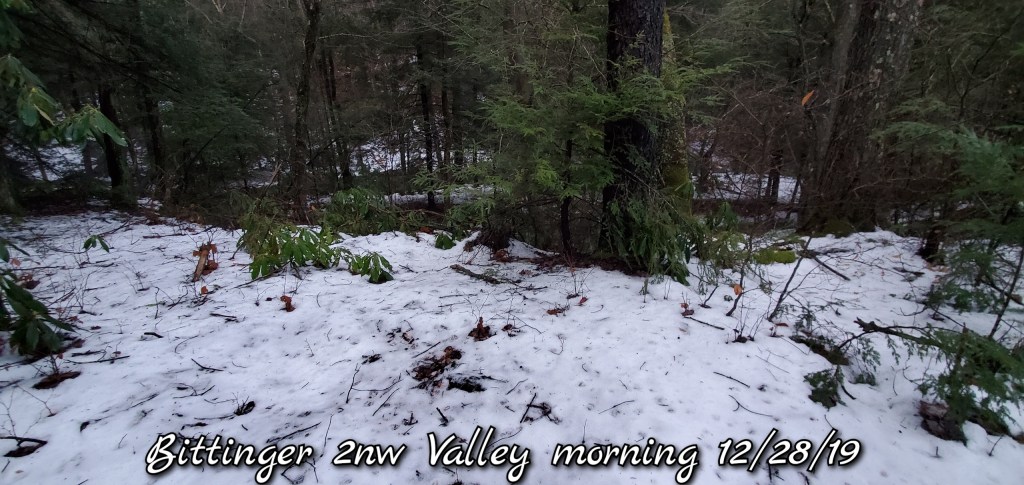
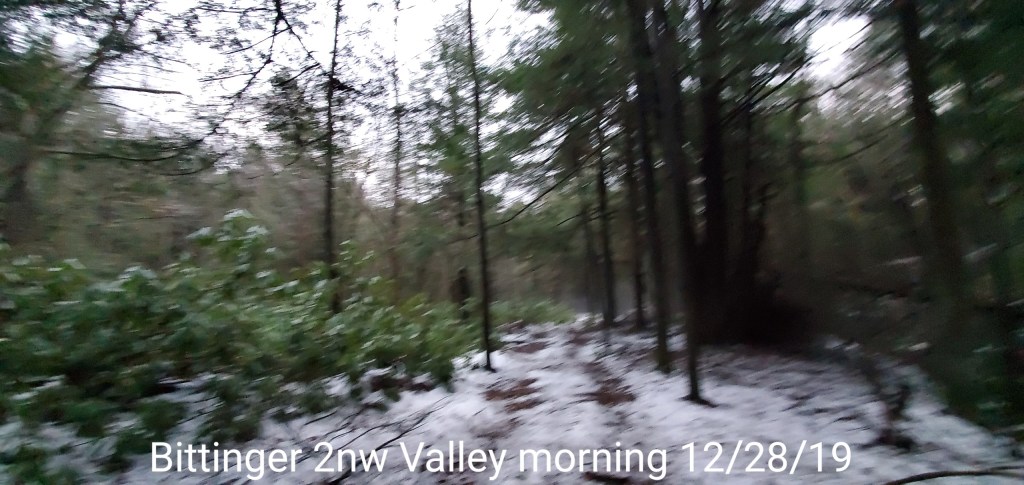
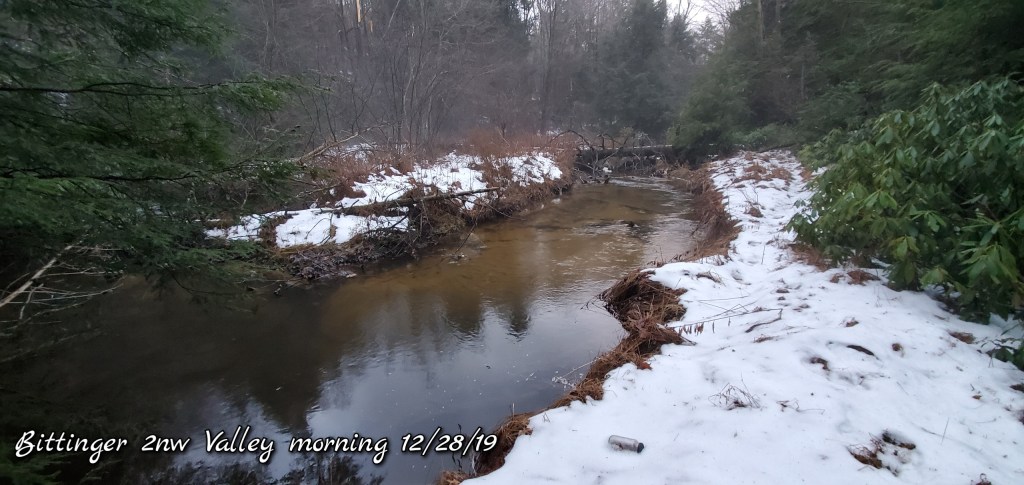
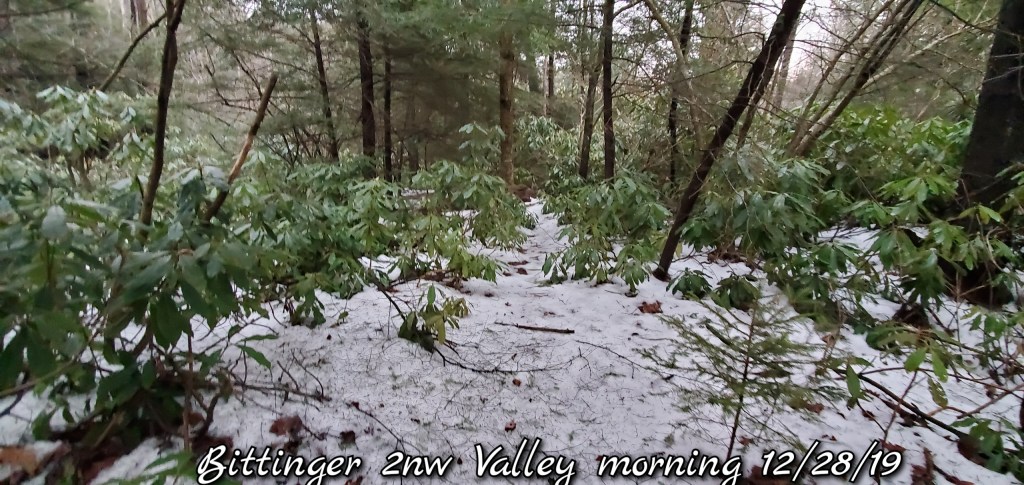
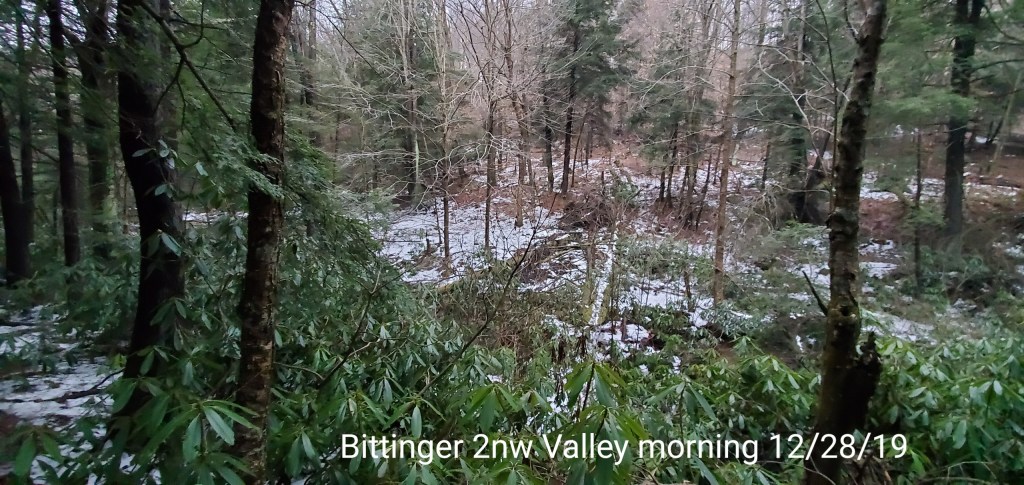
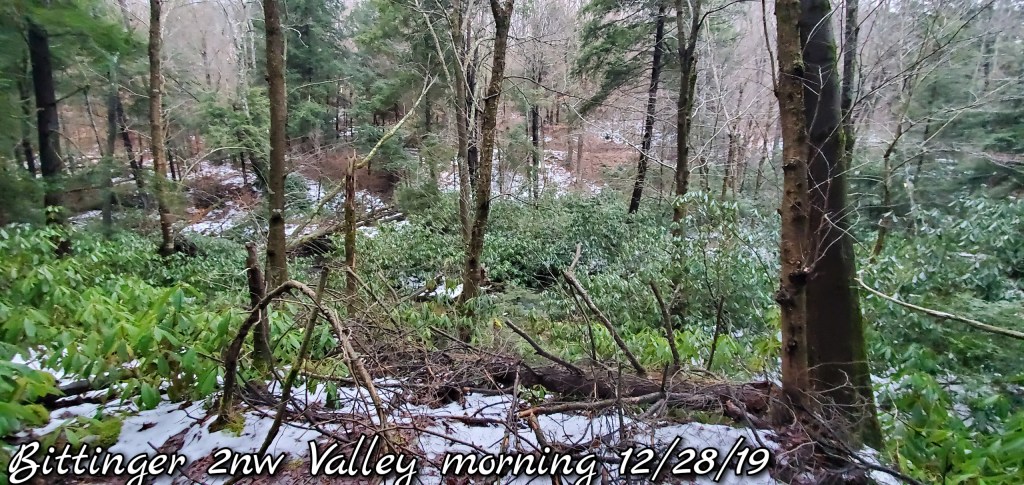
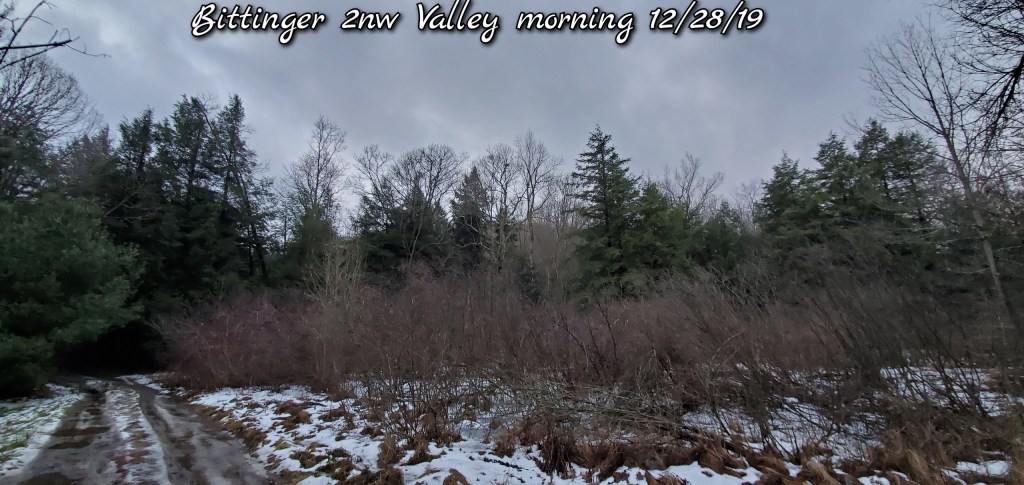
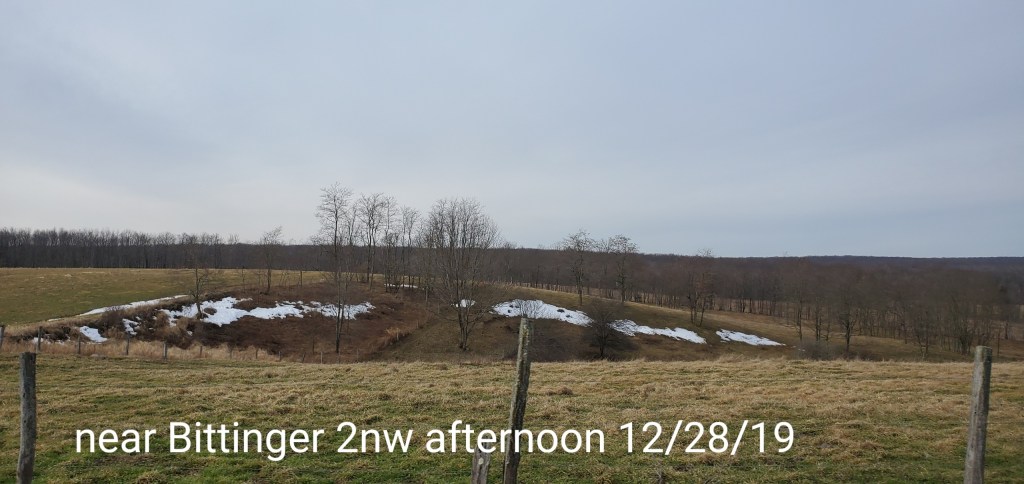
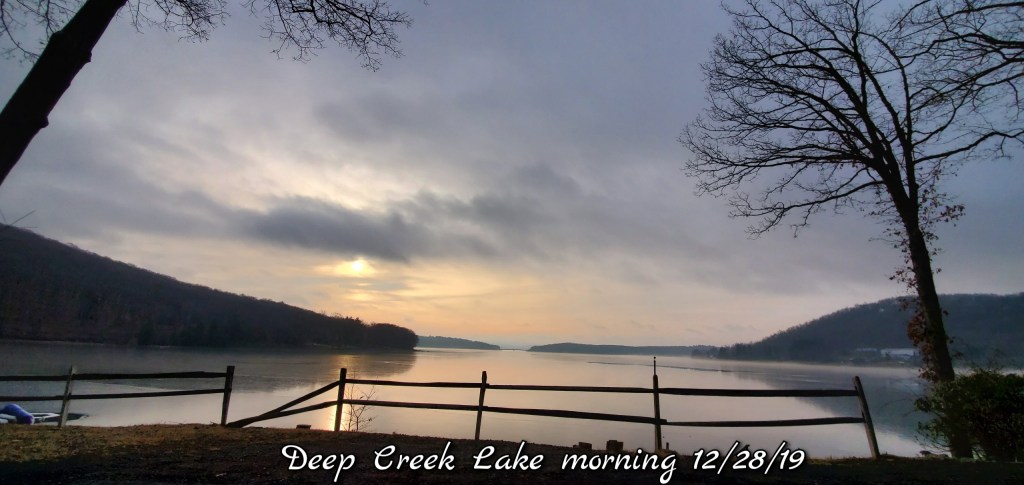
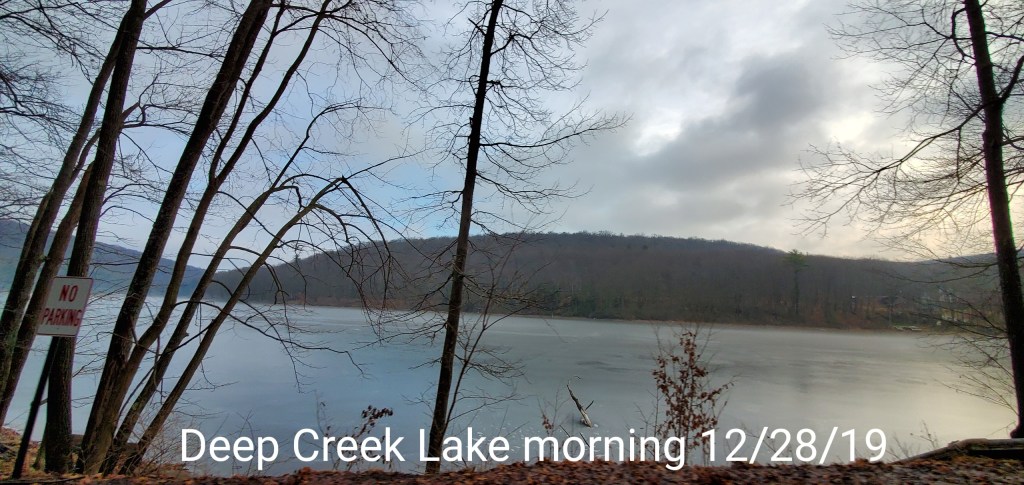
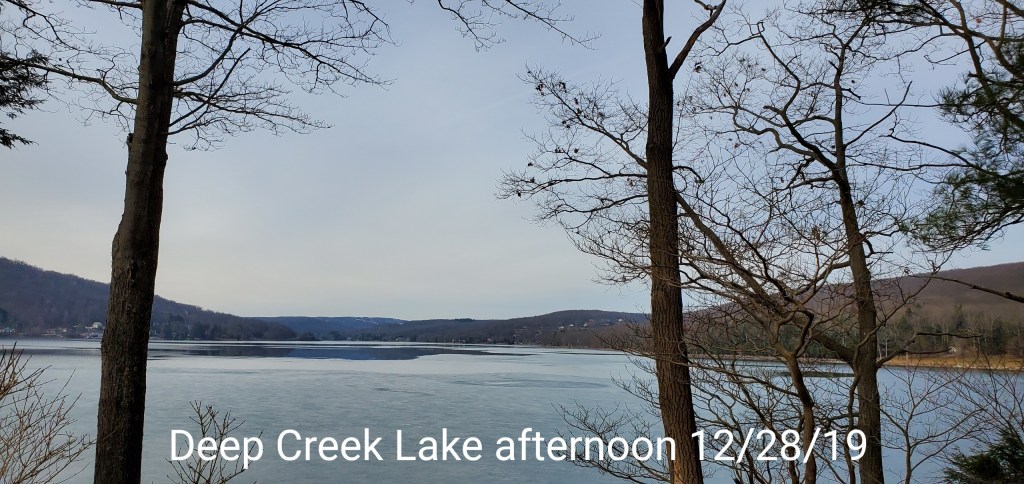
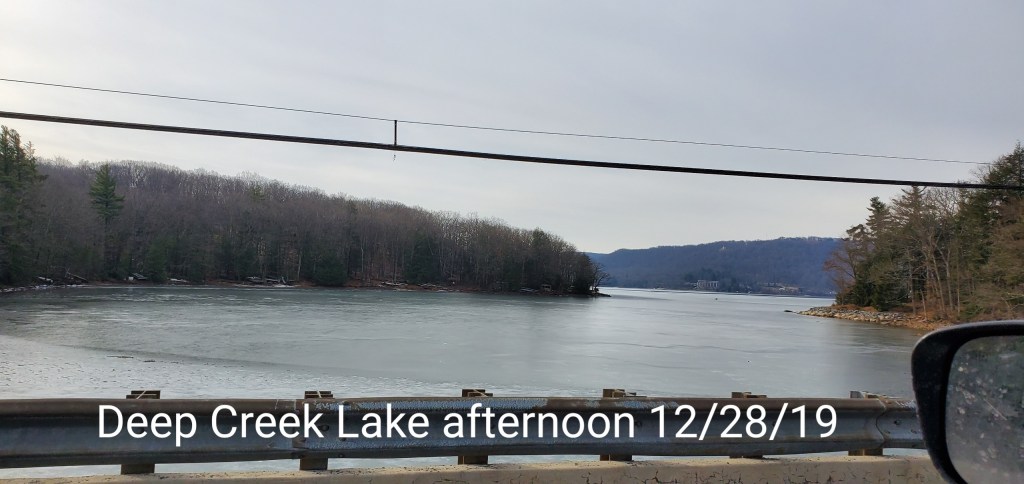
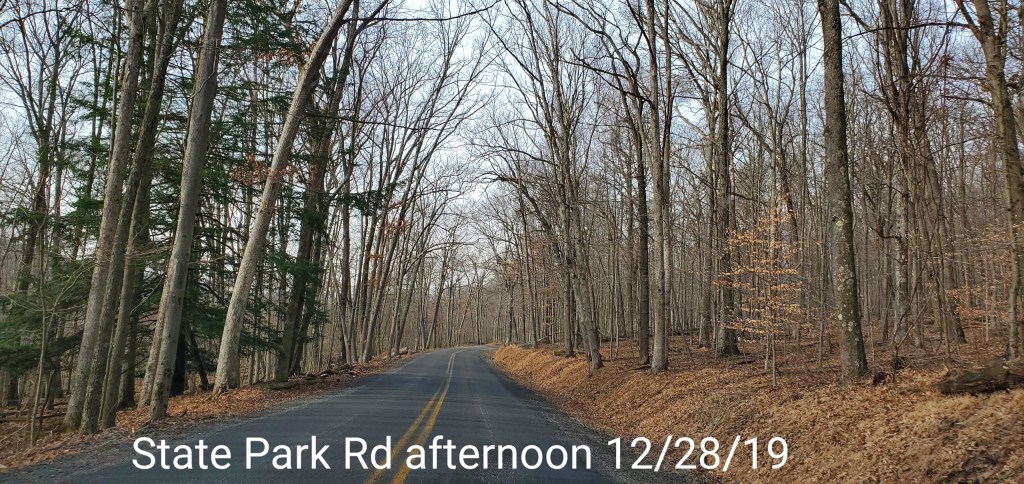
Pics today
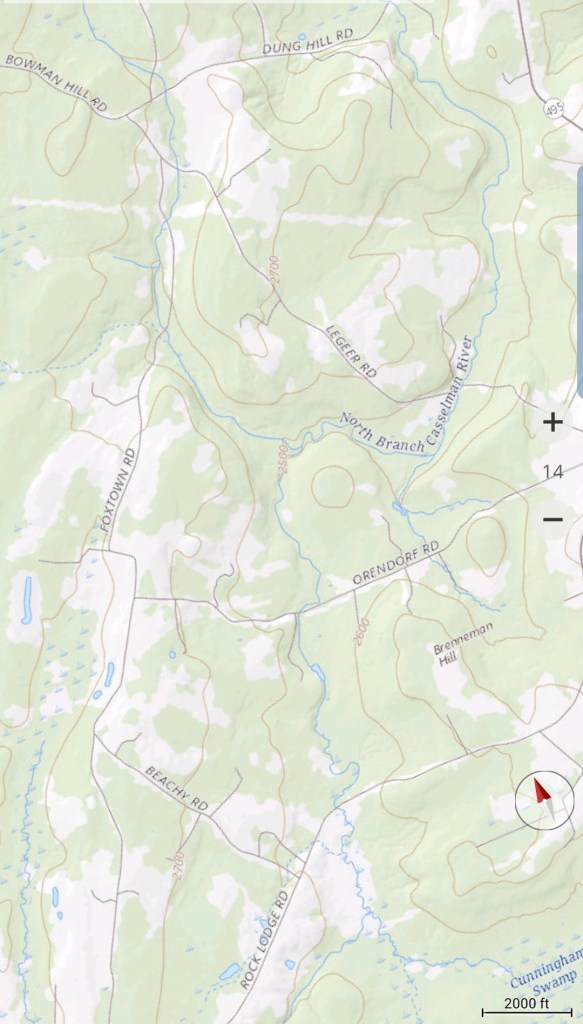
Bittinger area


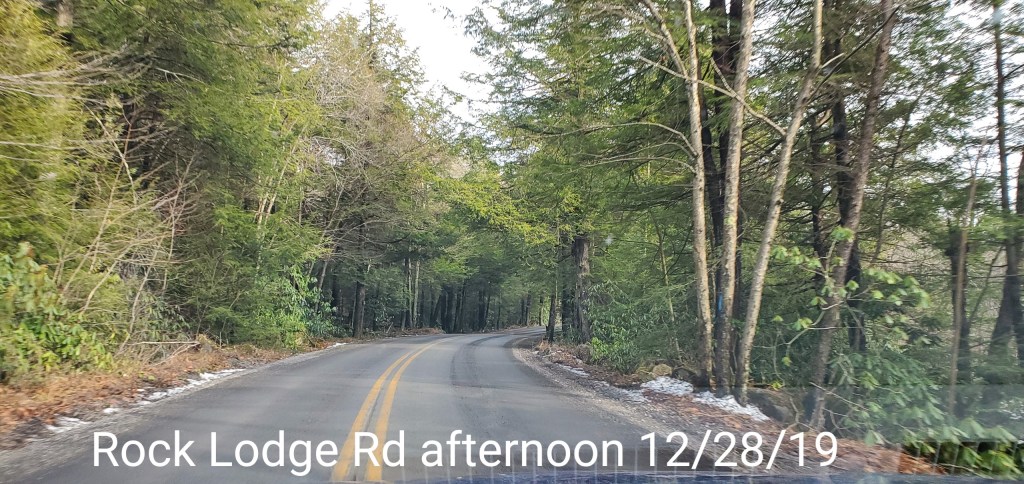


Deep Creek Lake area
Winter where art thou part deux…..
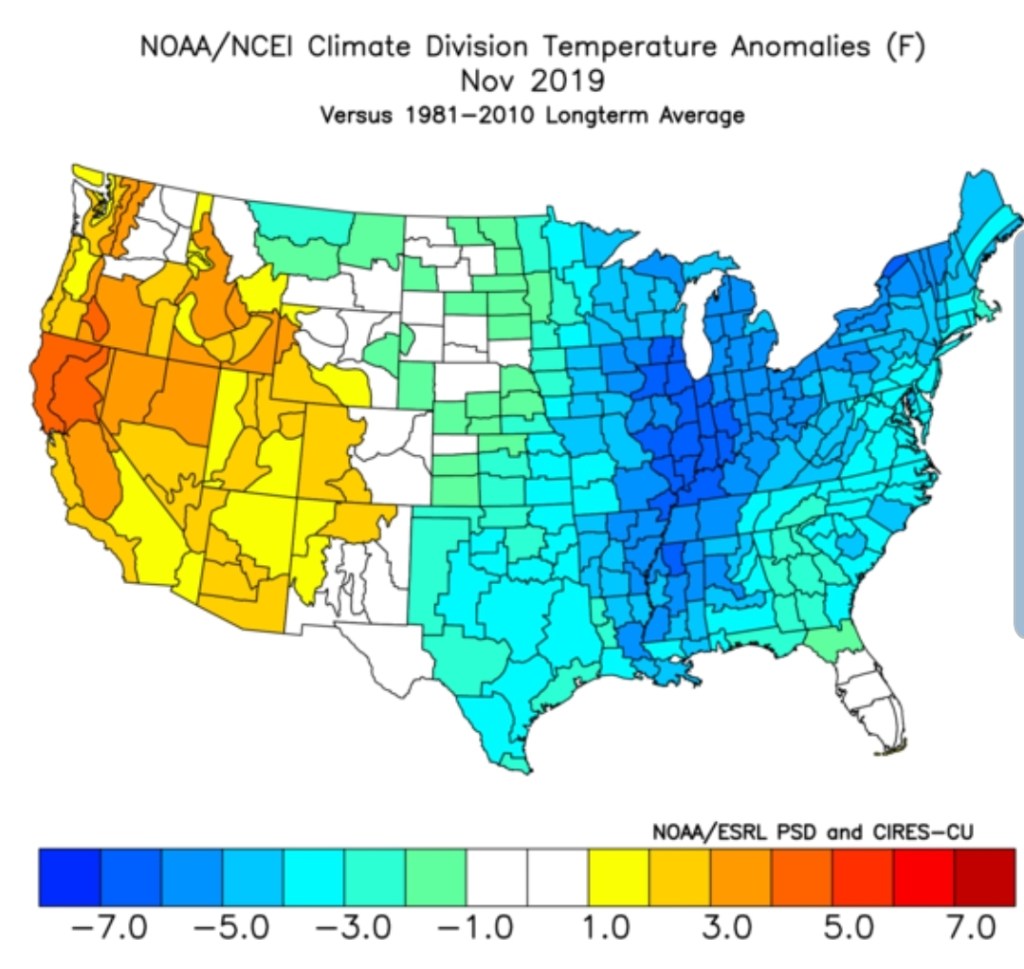
In yesterdays post, the 1936/37 winter was brought up, due to the similarities of the SST(sea surface temperature) anomalies of that year and this year. That year November was cold, and that cold was centered in the eastern 1/3 of the country
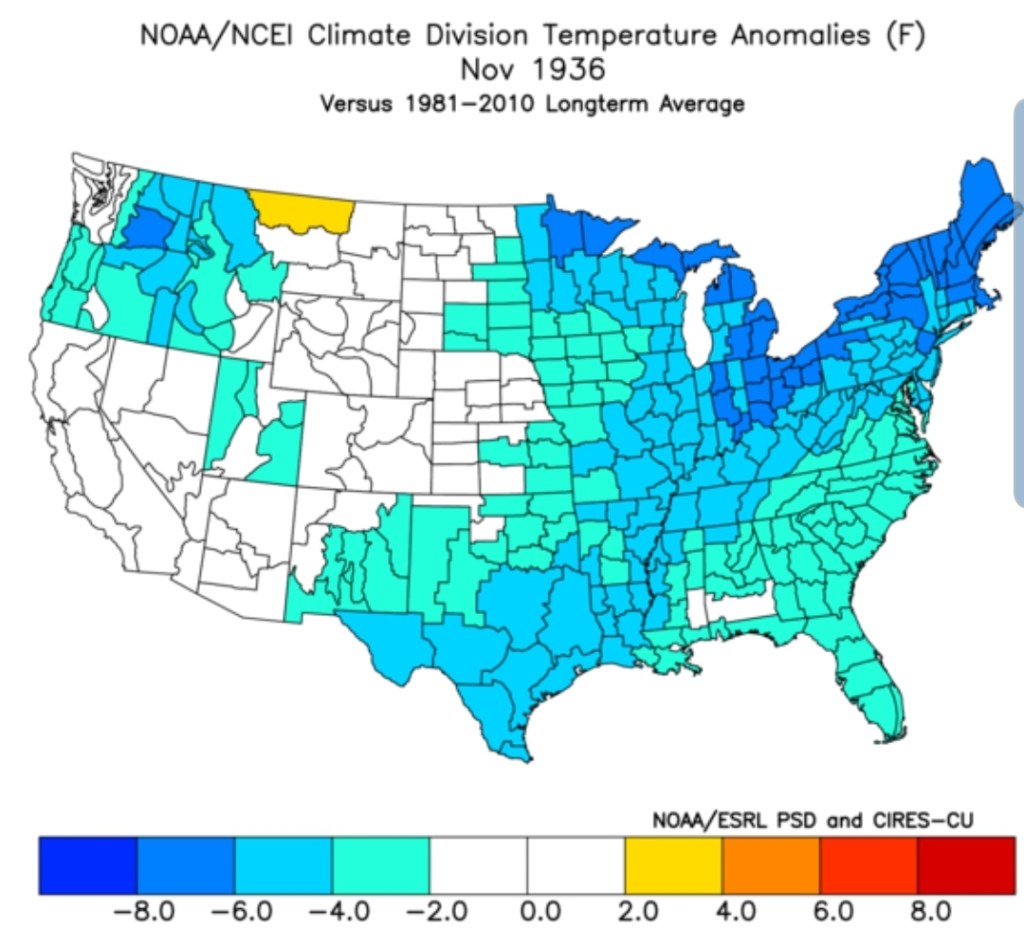
Along came this November, the cold centered in much the same area
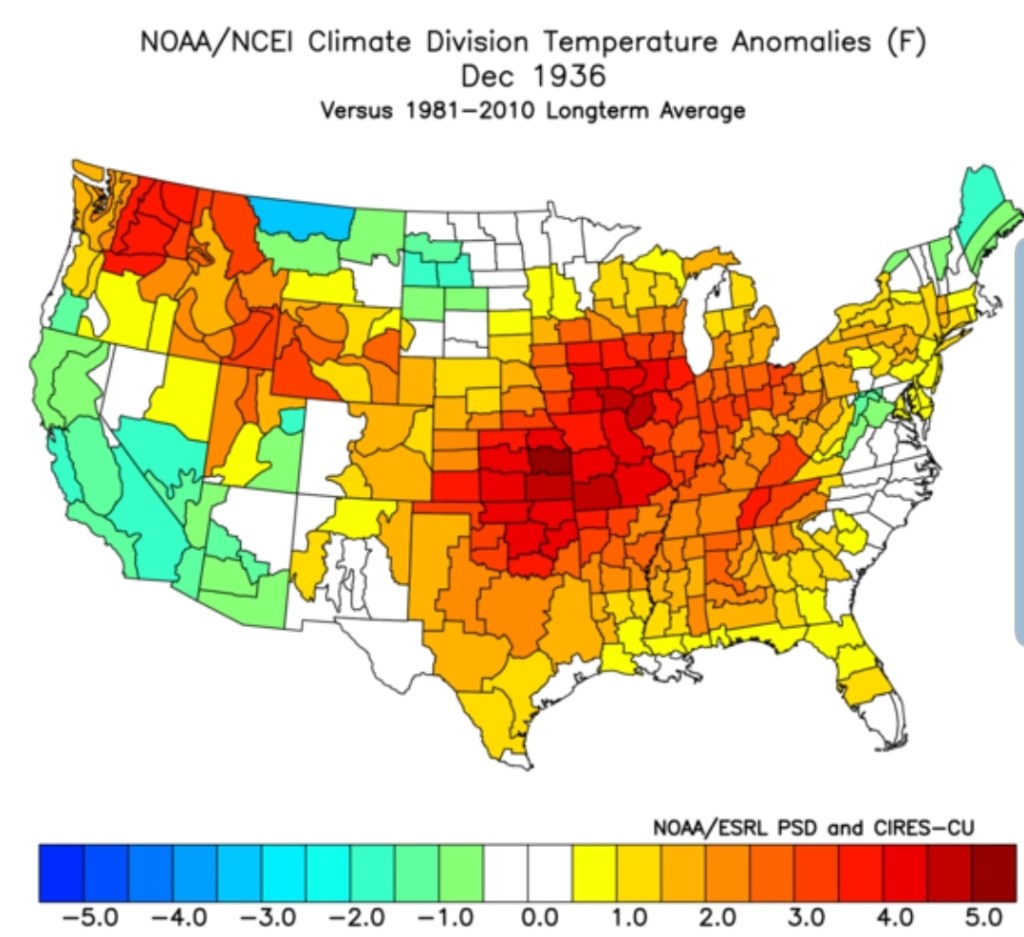
Then December came along and in 1936 went to this
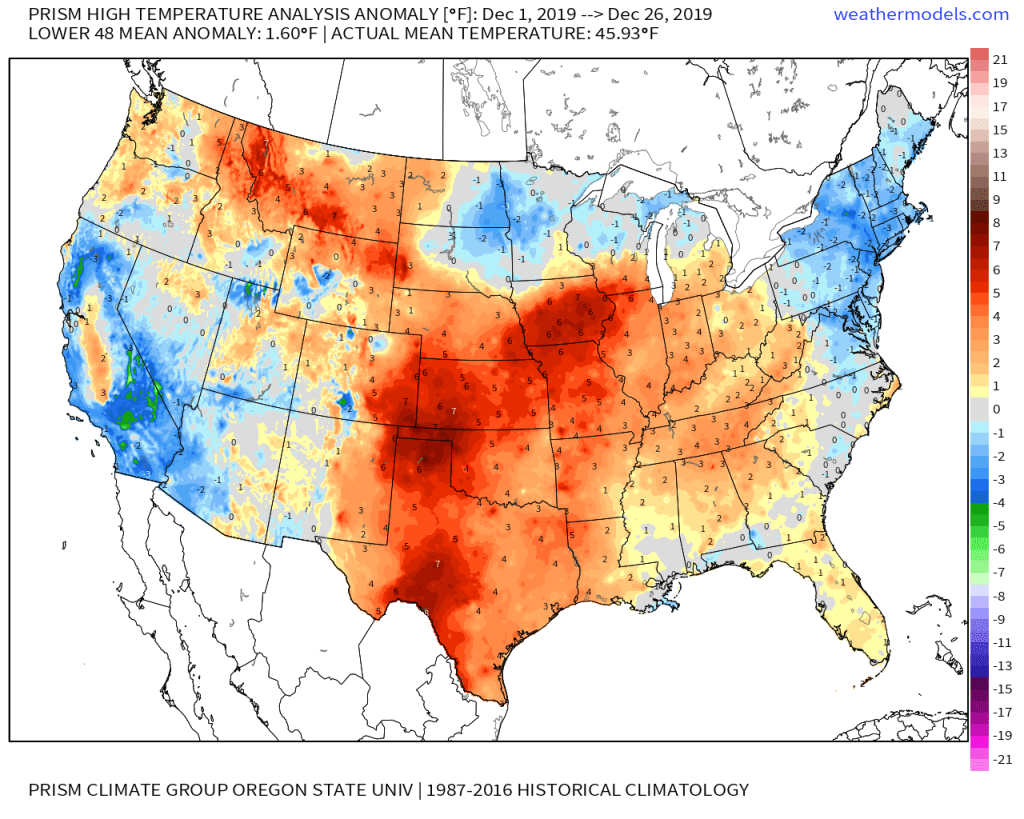
Then this December went to this
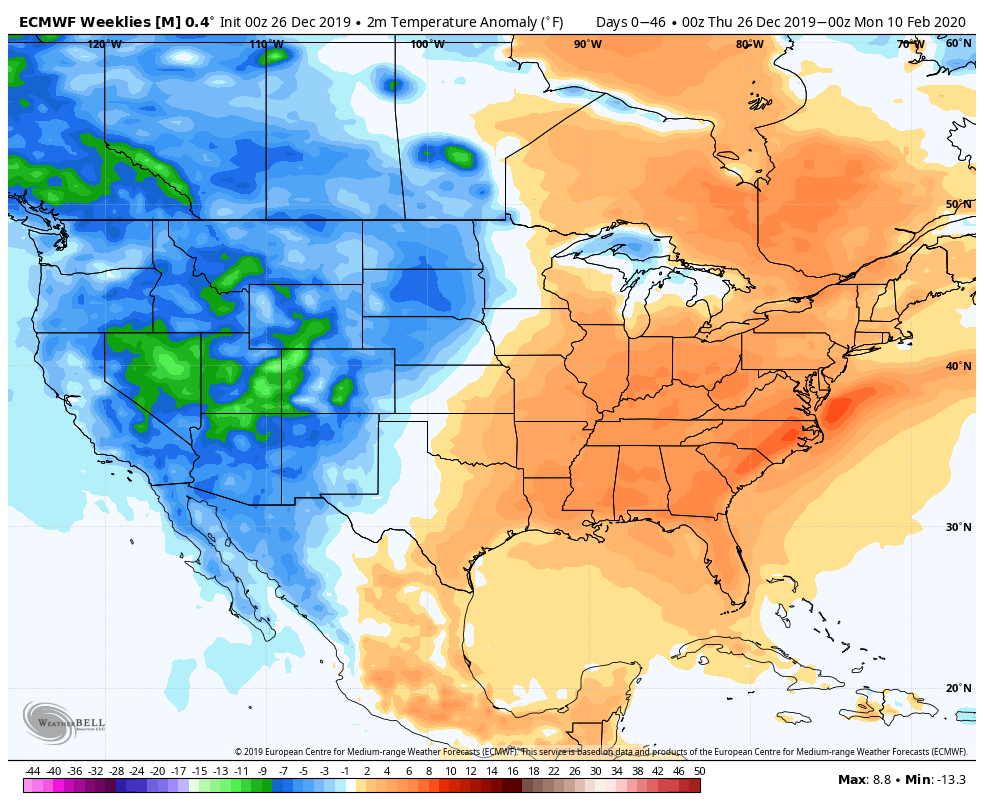
January on the most recent run of the European weeklies looked like this
January 1937 looked like this
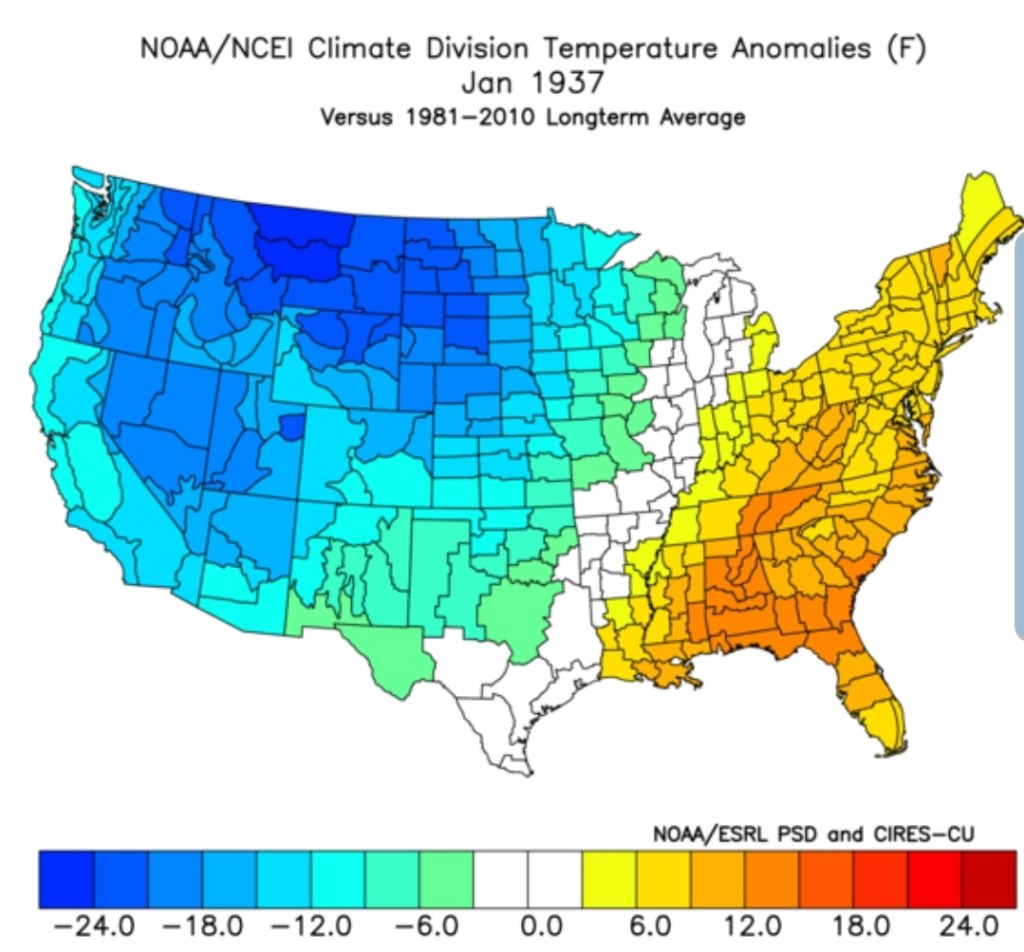
Now part deux-
Nothing overnight looked promising for anything as far as sustained winter over the next 2 weeks. Yes, it can still snow and even be cold a day or 3 in this pattern, but the SW flow aloft quickly over spreads the Wv high ground and melts things off. That big 500 ridge off the Florida coast remains on the overnight models like a bully.
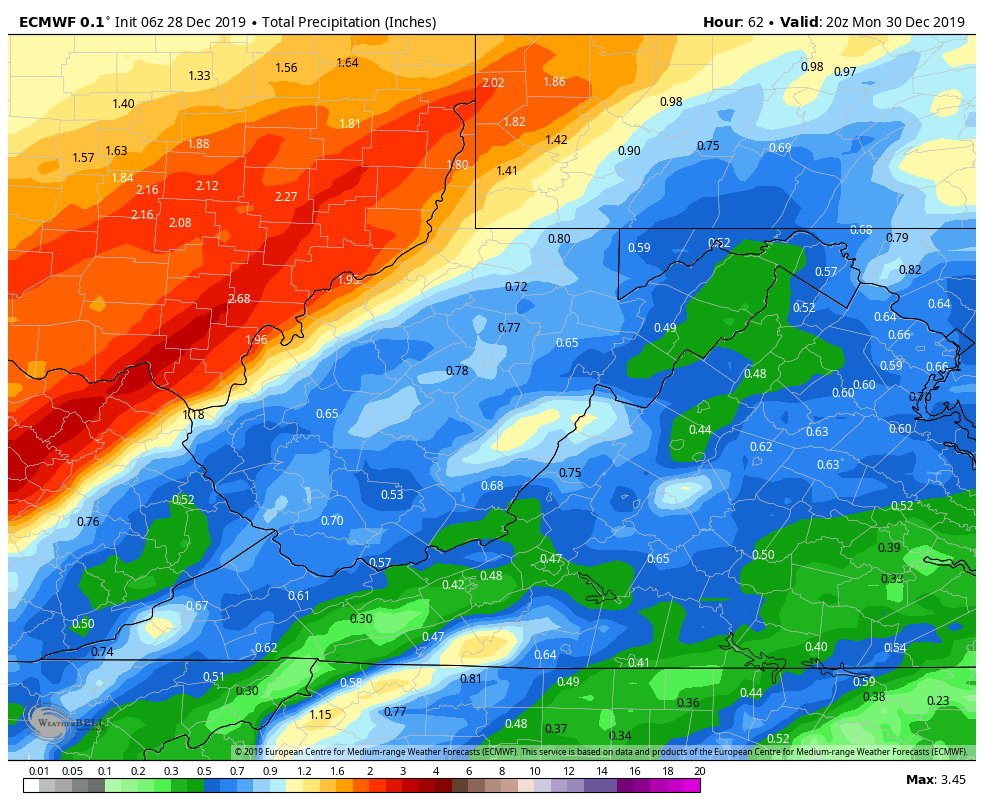
0z ECMWF
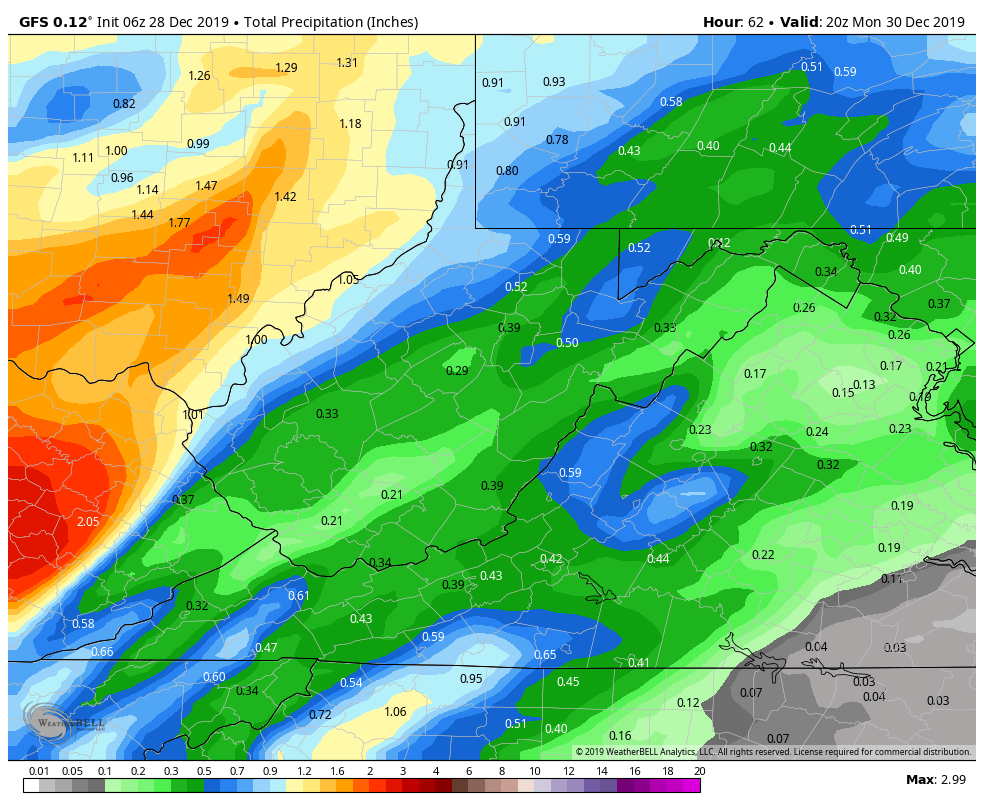
6z GFS
That look is not conducive for loads of winter time fun.
The 0z ECMWF Ensemble mean temperature anomaly outlook over the next 10 days.
The warmth continously trying to rebuild in the east is a response to the big ridge in the southeast. The push of cold around the 6th-8th looks to be a response to the model having a negative EPO at that time. If that occurs, odds are it bounces back positive rapidly.
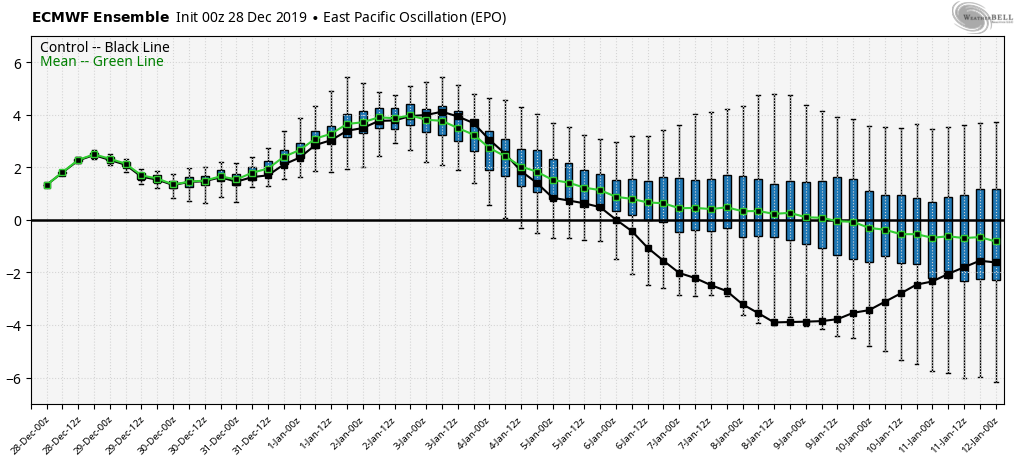
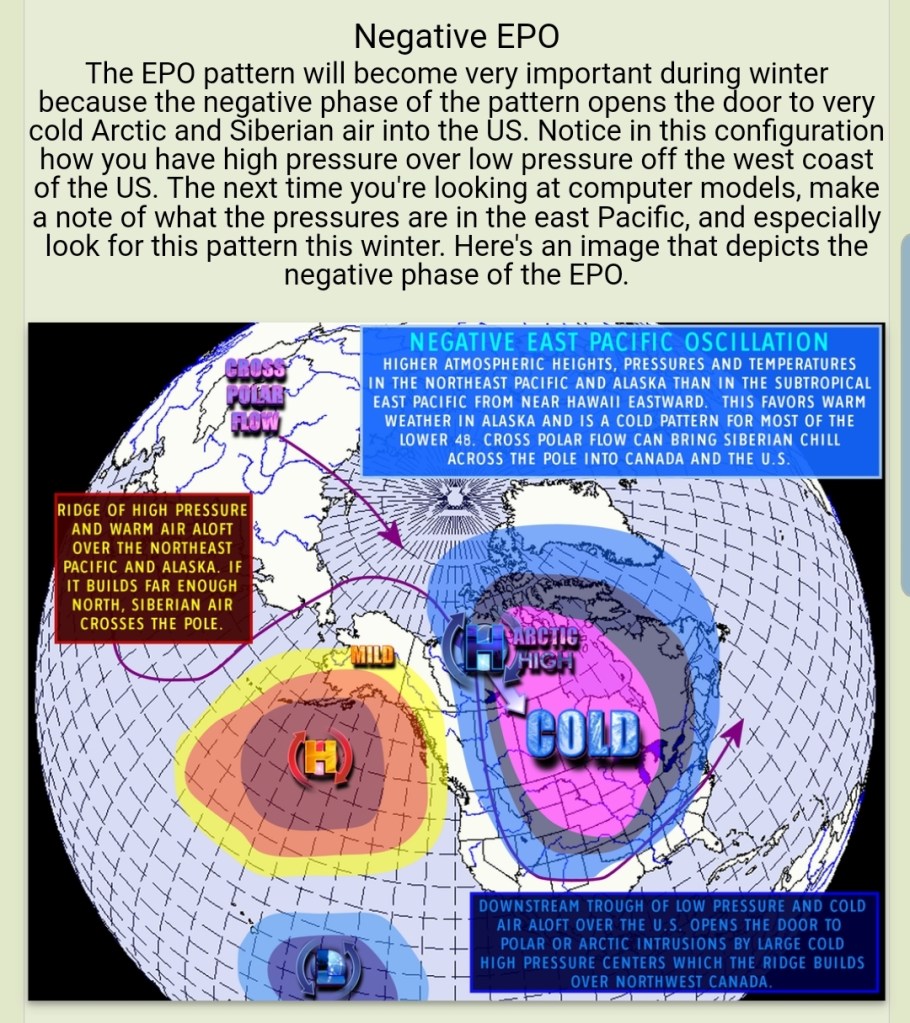
The EPO, nice description of it from Dacula weather site
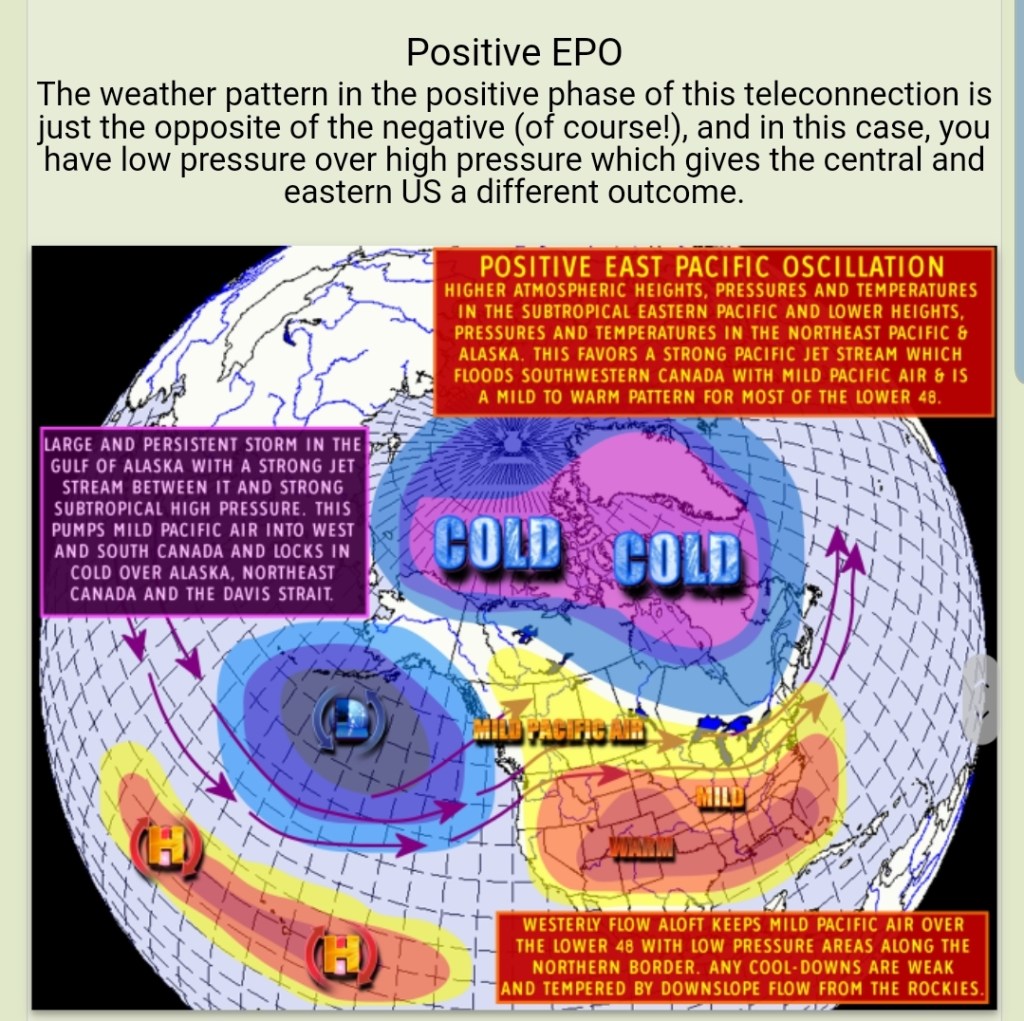
However the GFS holds the EPO positive, but it does fall some in that period. The GFS is also slightly less bullish on the southeast ridge…
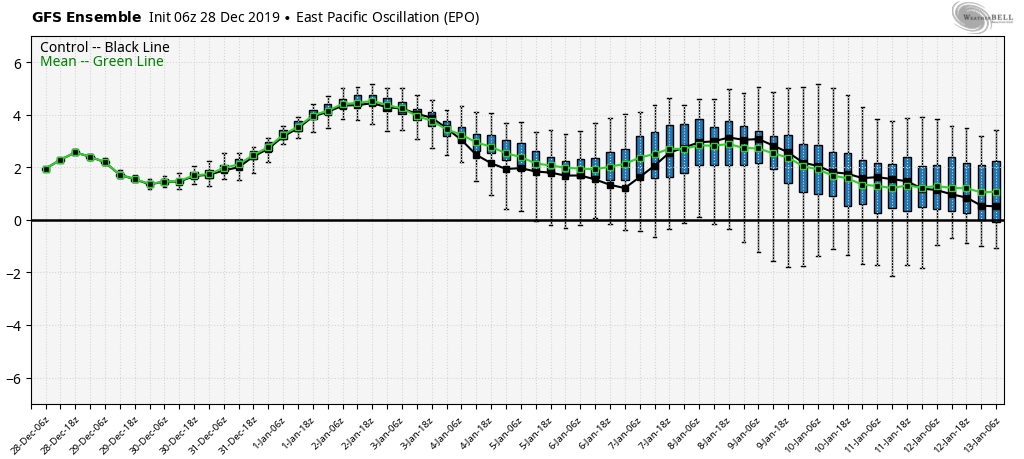
6z GFS Ensemble temp anomaly next 2 weeks
Models however have continously tried to bring cold in the long term only to see it disappear in the time leading up to it.
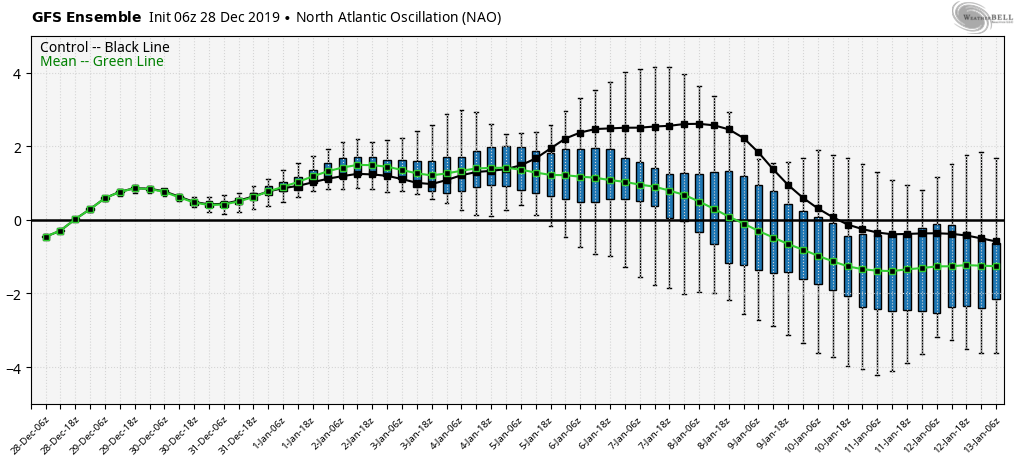
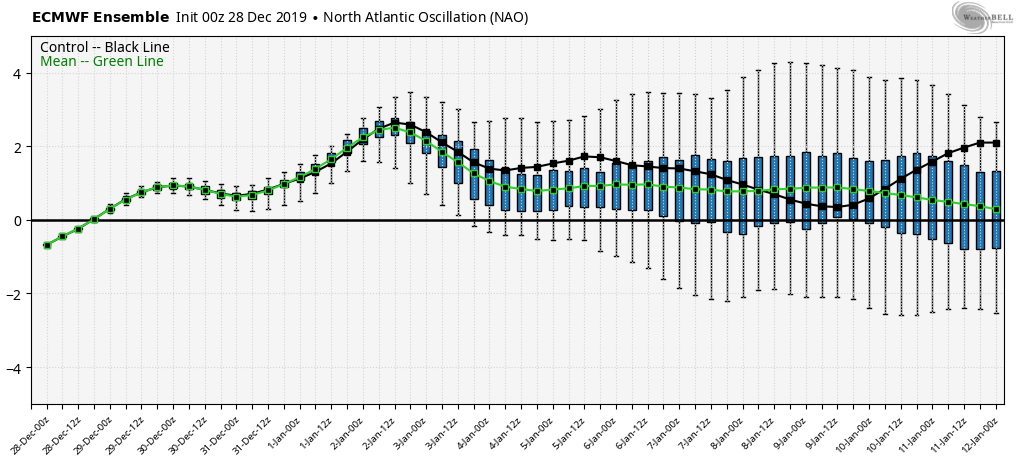
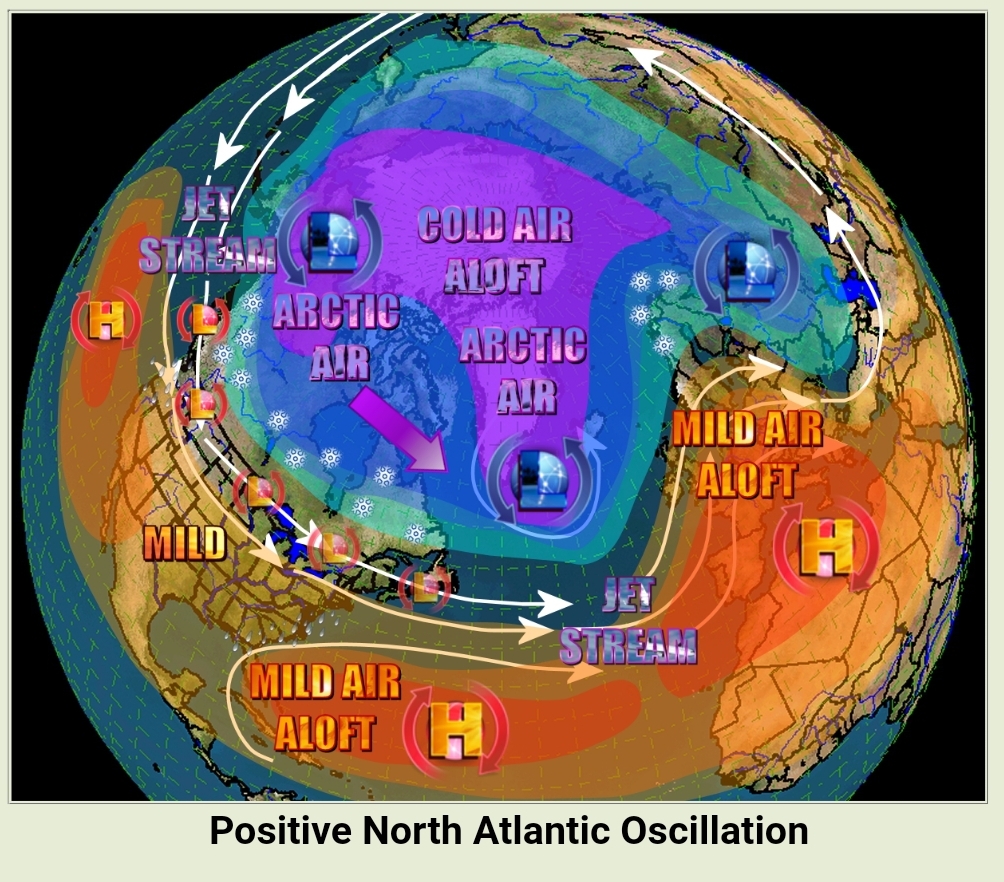
The NAO overall looks poor with a bit of a favorable trend of the GFS. Models do struggle with this .
The GFS and ECMWF ensemble
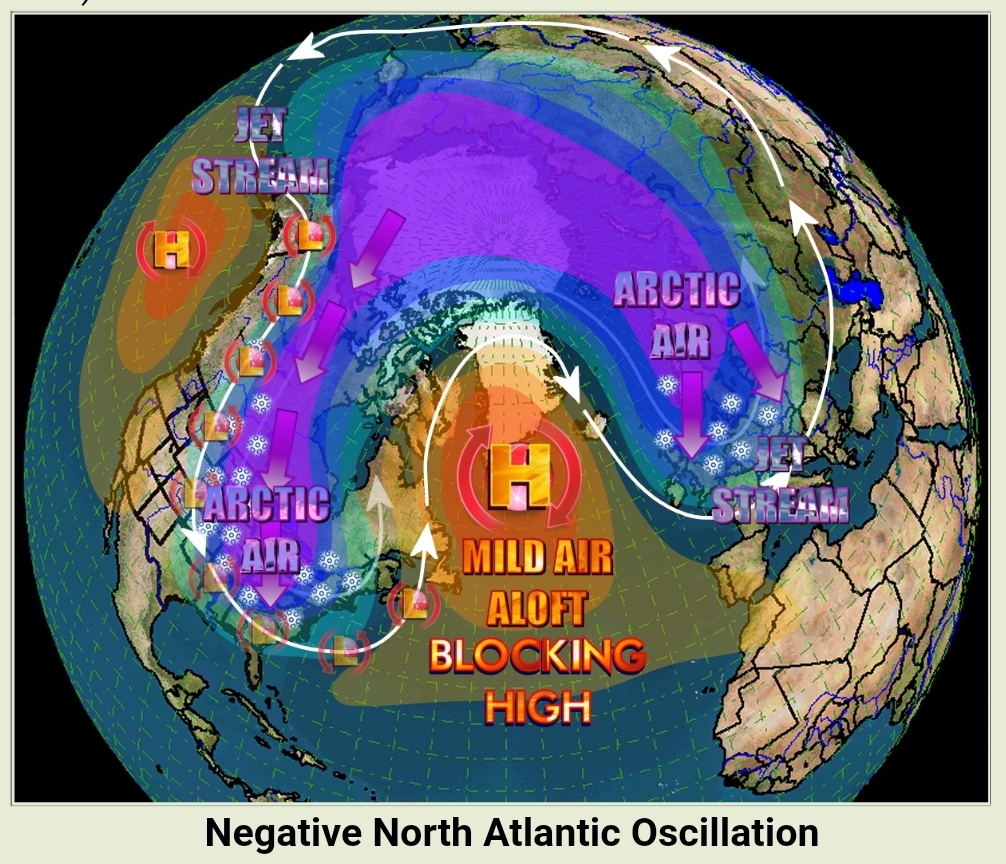
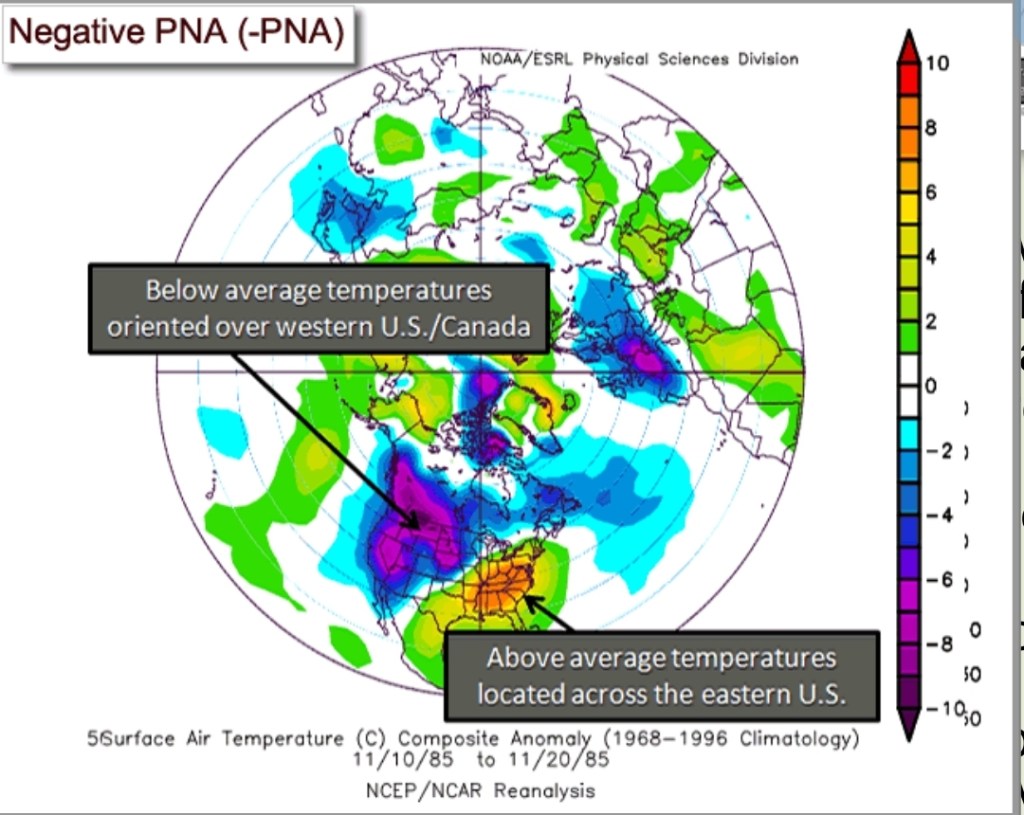
Again a nice graphic from the Dacula weather site
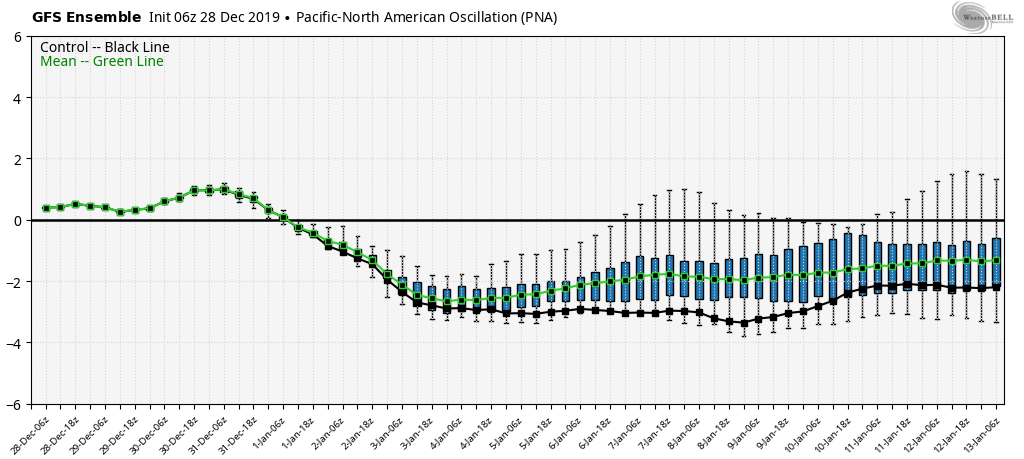
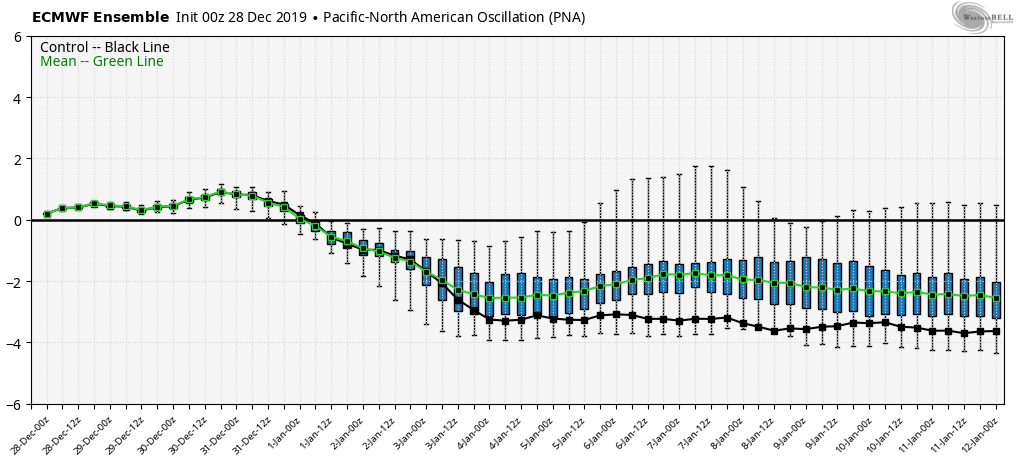
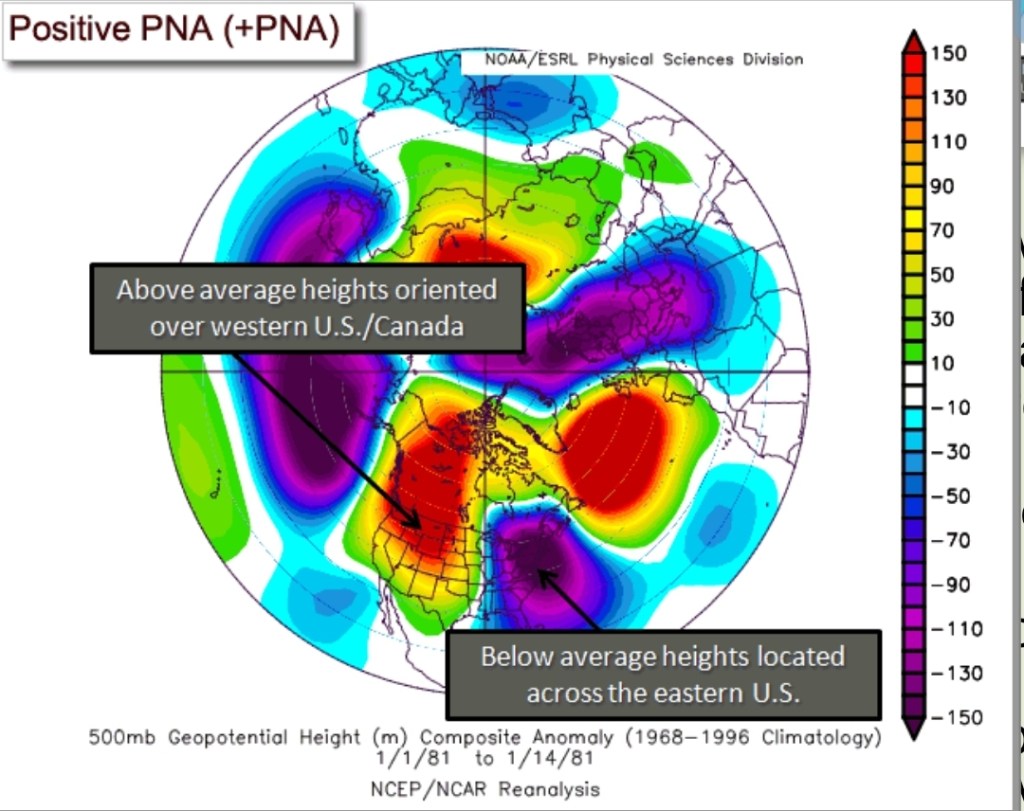
The PNA is unfavorable
Again the GFS and ECMWF ensembles
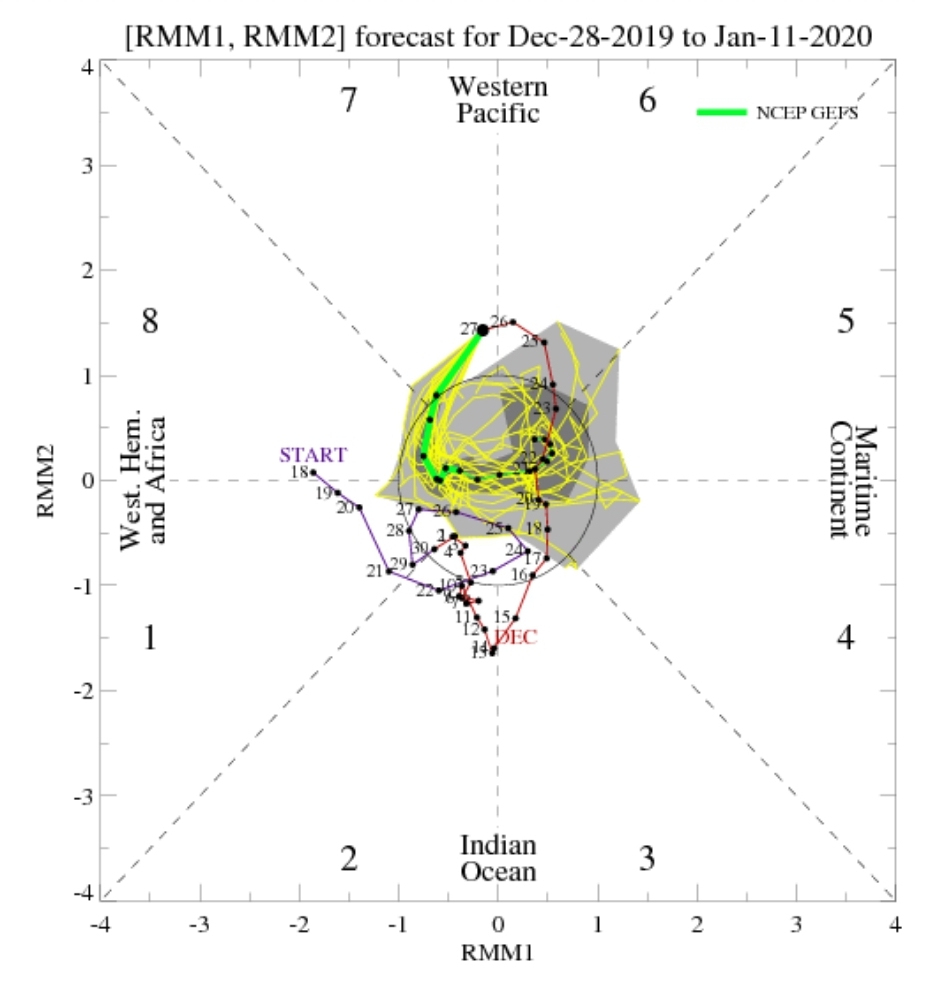
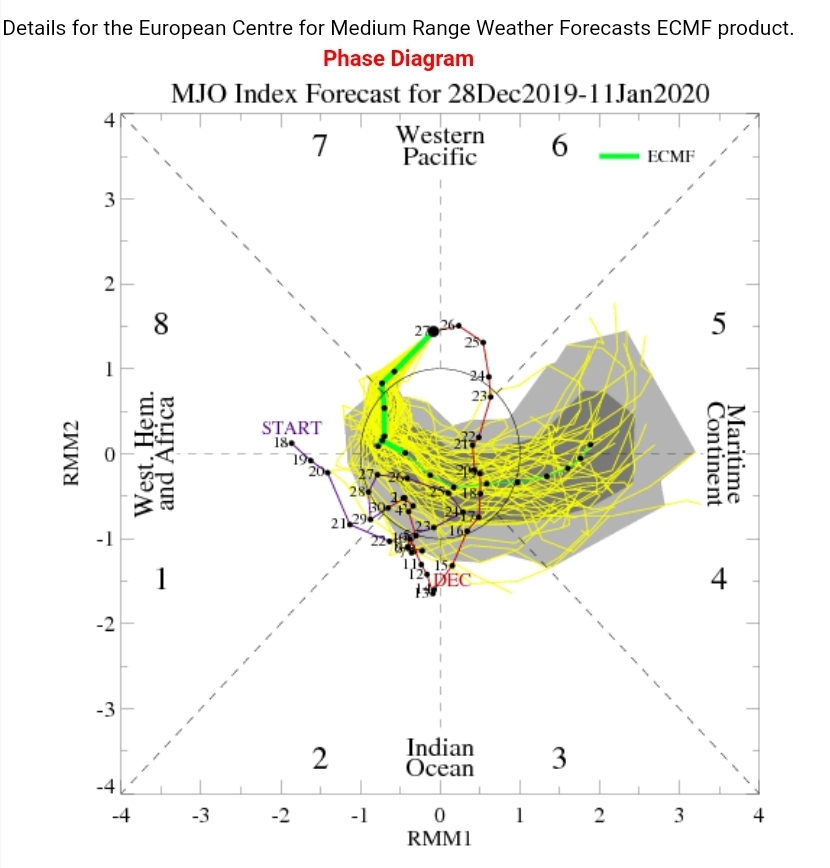
The MJO in 7 and headed to the null phase and modeled to circle back out into 4, 5,6… that’s a anti winter look
The GFS MJO and ECMWF MJO outlook
Correlation
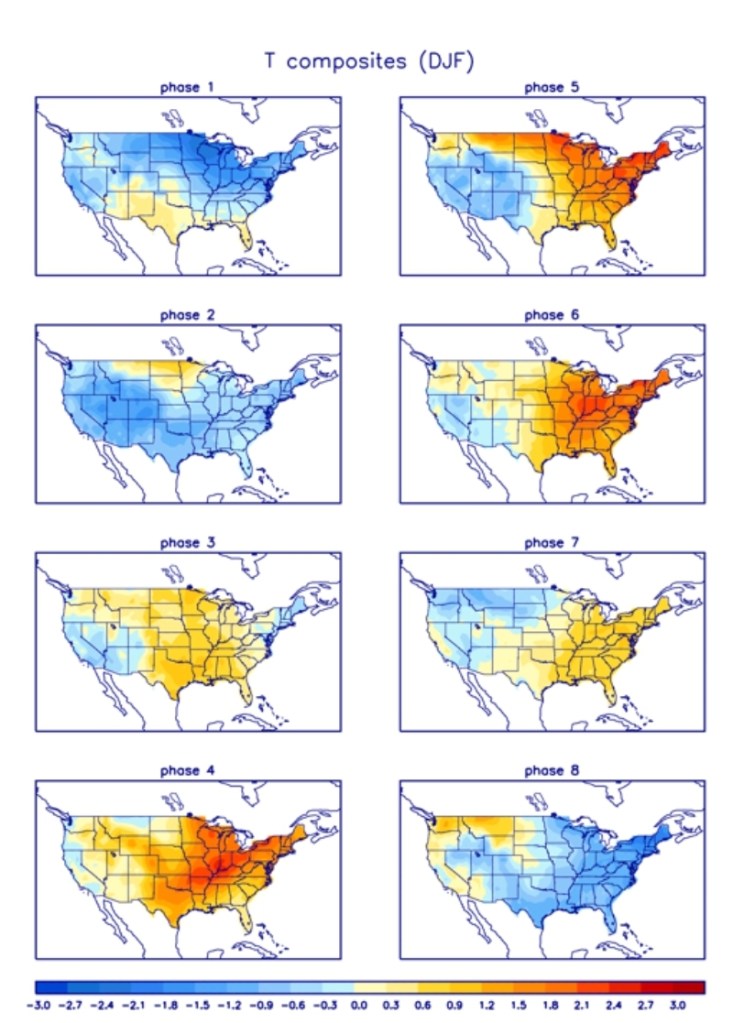
The overall dominant appearance of all these features gives a look that favors this.

The hope is the EPO can hold negative and the ridge breaks down. That’s the hope anyhow if you like sustained winter.
Onward-
So, 1937 with more similarities. Admittingly this is for fun, but interesting to see the likenesses. Snowfall data sets are the least valuable datasets as observer technique is unknown for some of the data. At any rate-
Snowfall to date at the Oakland site in 1937

Current snowfall from the Mt.Lake Park observer who is much better than what’s out of Oakland now days
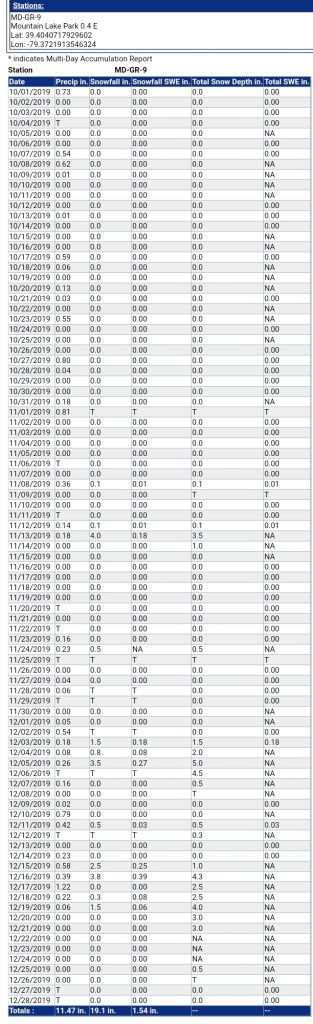
18.0 then, current observer at 19.1. Obersever technique and error can cover that.
Oakland snowfall through January 37. A monthly jump from 18 to 22.

How about some other sites
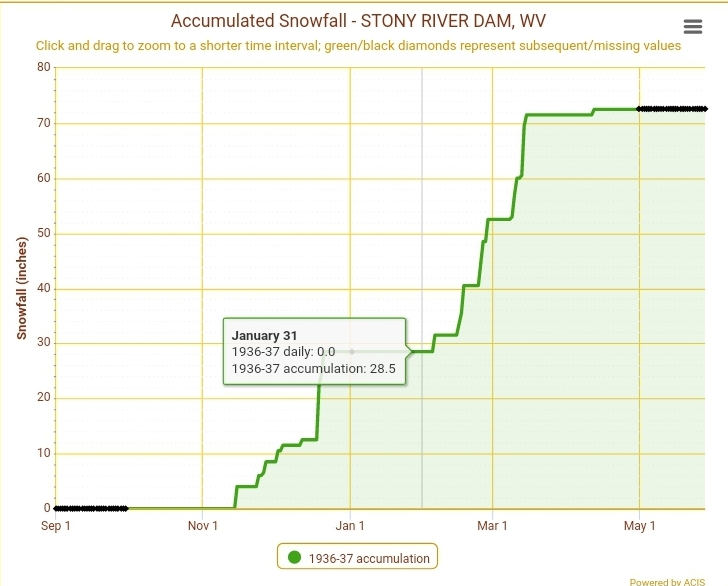
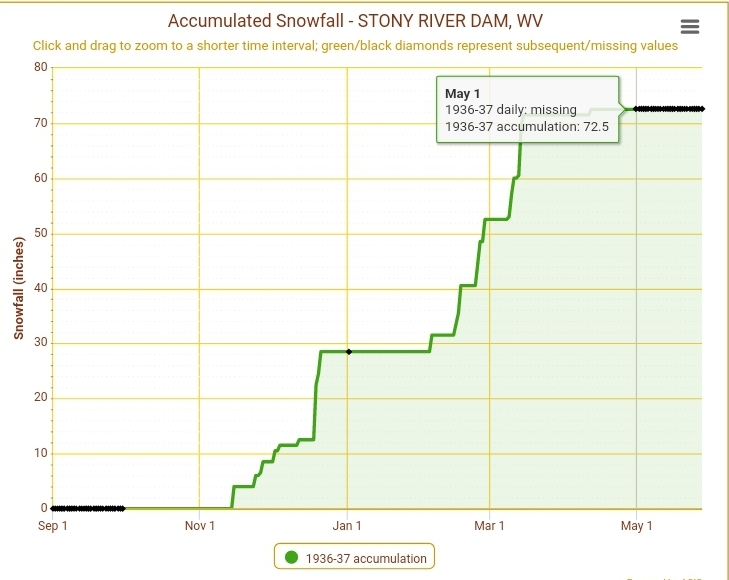
Back up to the Stony River Dam site. No longer in existence, but it provides some data pre Canaan co-op days
Through today’s date, 28.5″ was recorded on the season in 1936

Now, through December 28 of this year, Dave Lesher at Davis 3SE is at 28.6″
Through Jan that year, Stony River site added 0
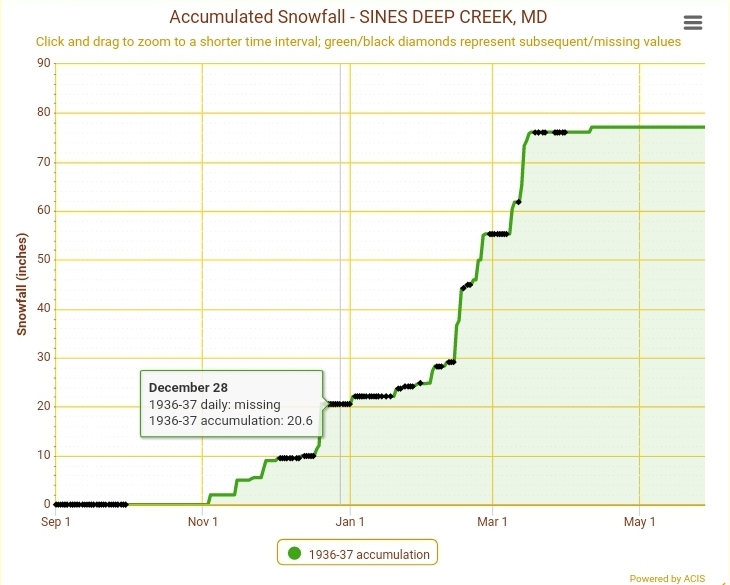
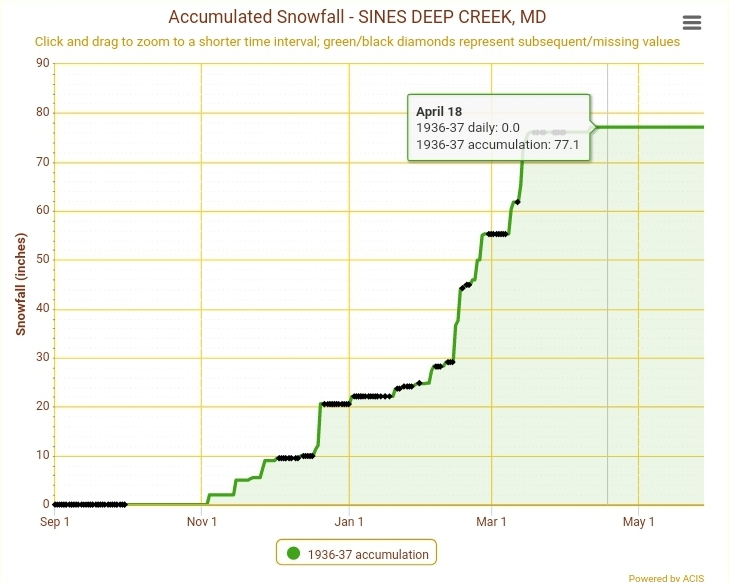
Station at Sines Deep Creek, not exactly my location- was at 20.6″ on the season
*this site has missing data. In all appearances it’s highly likely they only recorded in snowfall obs when it occured.
So far this season to date, I’m at 20.8″
through January they gained only 4.7″
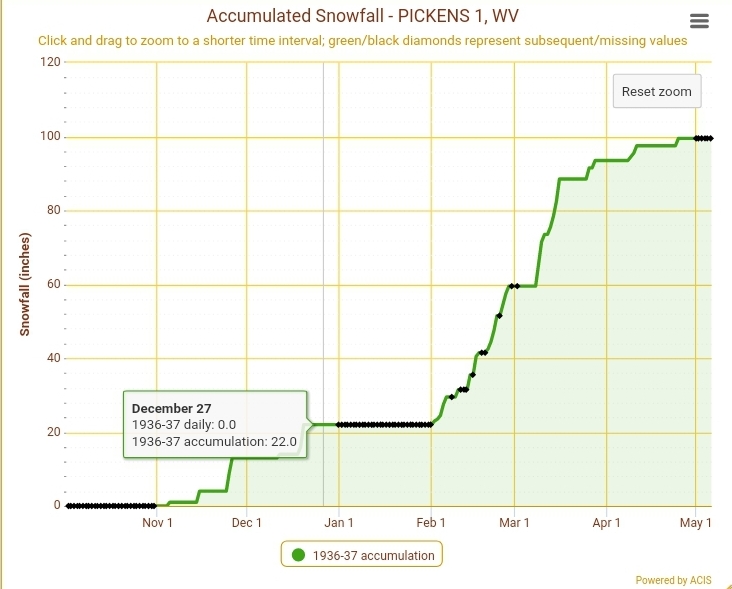
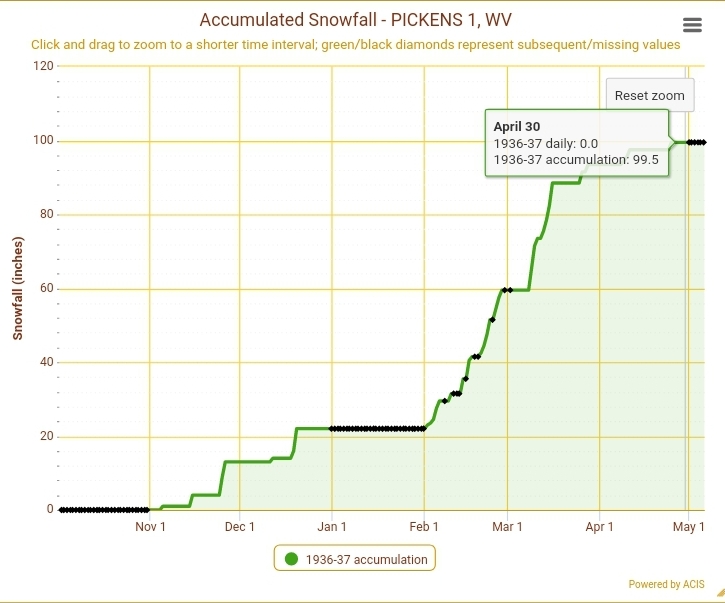
A jump down to Pickens Wv. Unfortunately there us no good comparison site currently.
At Pickens through the date on snowfall for the season
At 22.0″
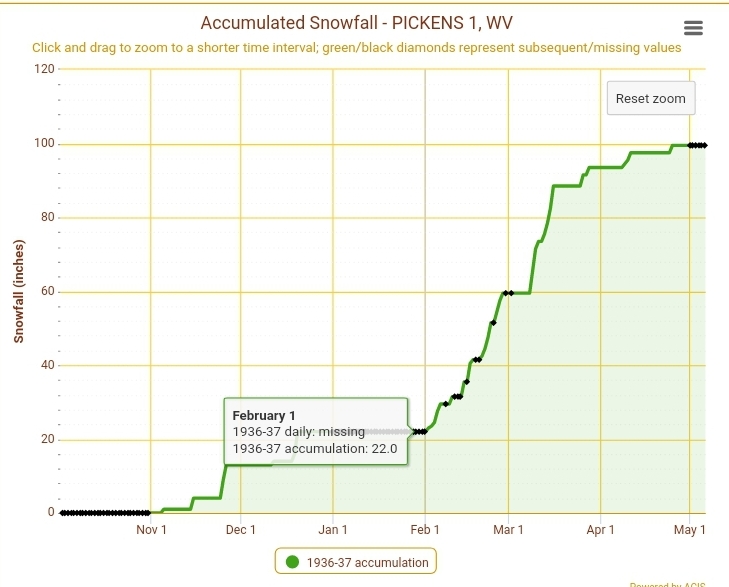
Through January of 37… reason to believe the missing days were simply due to no snowfall occurring and it goes right along with other sites.
Marching forward-
Where did 37 go in February and March
Feb of 1937 seen some variability in temps, that ended in a overall normal month

Some of that variability in temperature can be seen here at the Oakland site. Each bar representing the max/min. Lots of up and down swings through the 2nd half of the winter with colder air outweighing the warmth, but even then, some warmth was still existent.

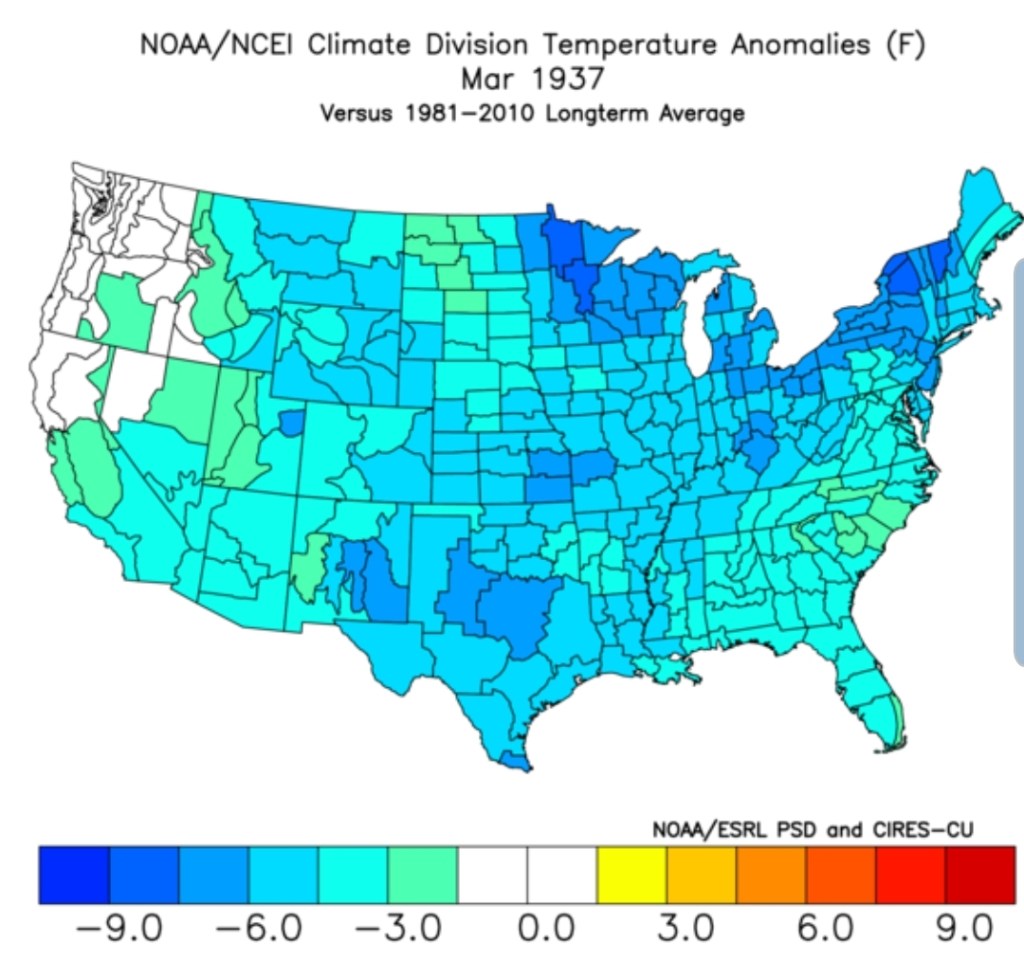
Then in March
And April

As far as snowfall
Oakland ended up seeing most of its snowfall post Feb 1, jumping from 22″ to 68″ to end the season

Stony River Dam
Jumped from 28 Feb 1 to 72 to end the season
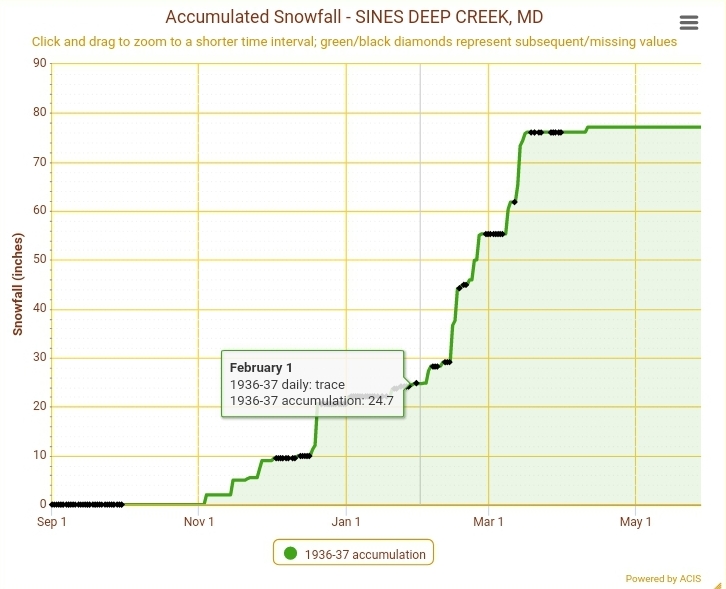
Sines Deep Creek jumped from 24.7 Feb 1 to 77.1 to end the season
Pickens jumped from 22 on Feb 1 to 99.5 to end the season.
As far as the ” least of winter” , that season, nor this one likely will go to that territory. Some late 20s winters, the winter of 26-27, 31-32, 41-42, 48-49, 51-52 are some example of ones even worse(if you like snow)
In the end, hopefully all of this rambling is for not and winter turns on a dime much sooner and offers a January surprise.
Upcoming several days
Tomorrow we see the local climatology boundary come into play. Easterly flow. That north central Garrett area and points east, north, northeast hold much chillier than the Wv high ground and points west. 3km Nam does a superb job in the setup routinely
Showers through Sunday increasing late
Precip amounts to be .4 to .8 range, locally higher. Heaviest remains west.
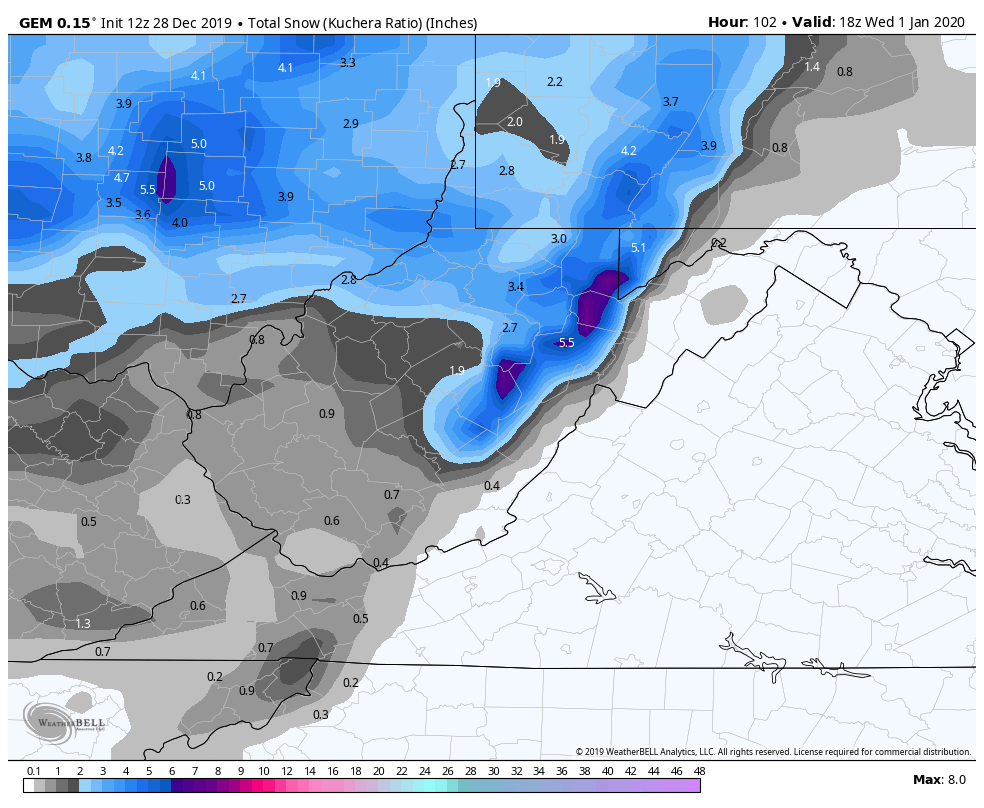
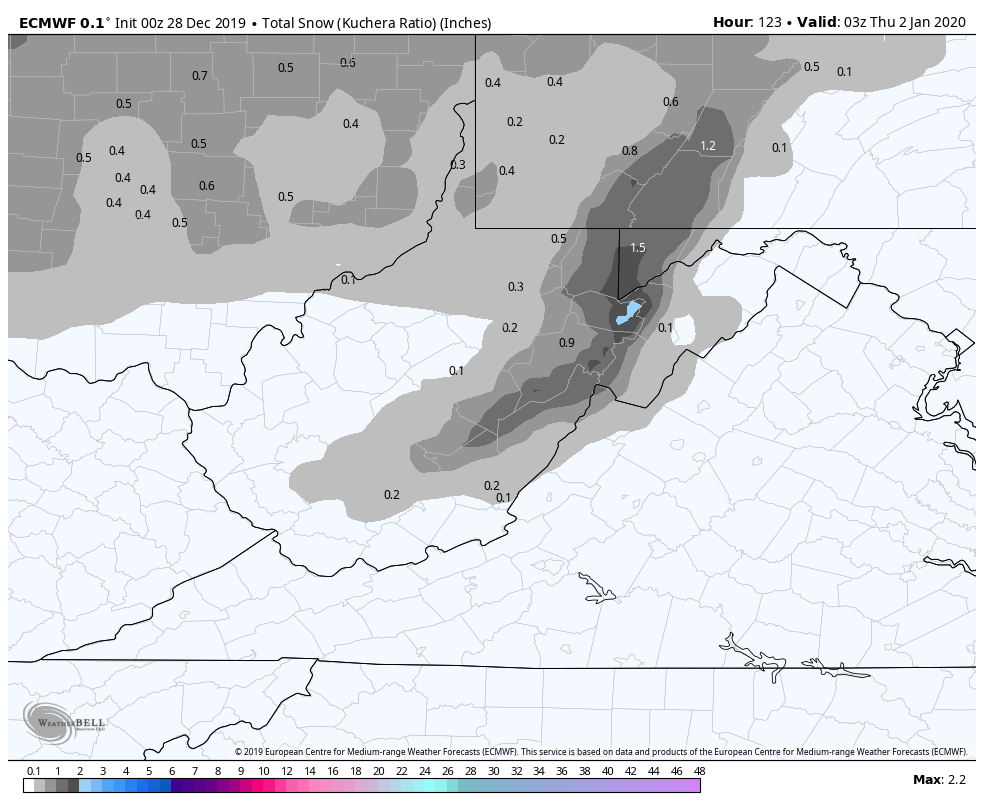
6Z GFS and 0z ECMWF
Colder air begins to ooze in later Monday and borderline temps for snowmaking late Monday night, better Tuesday night through the day Wednesday and Wednesday night before things rebound under the SW flow late week. Snowfall, the GFS has ticked down, the ECMWF ticked up, and the Canadian remains most generous Tuesday into Wednesday.
A widespread 1-3″ looks likely with up to 5″ across the Wv high ground. Tweaks to come, but likely minimal either way.

Temps off the 6z GFS
Temps off the 0z ECMWF
