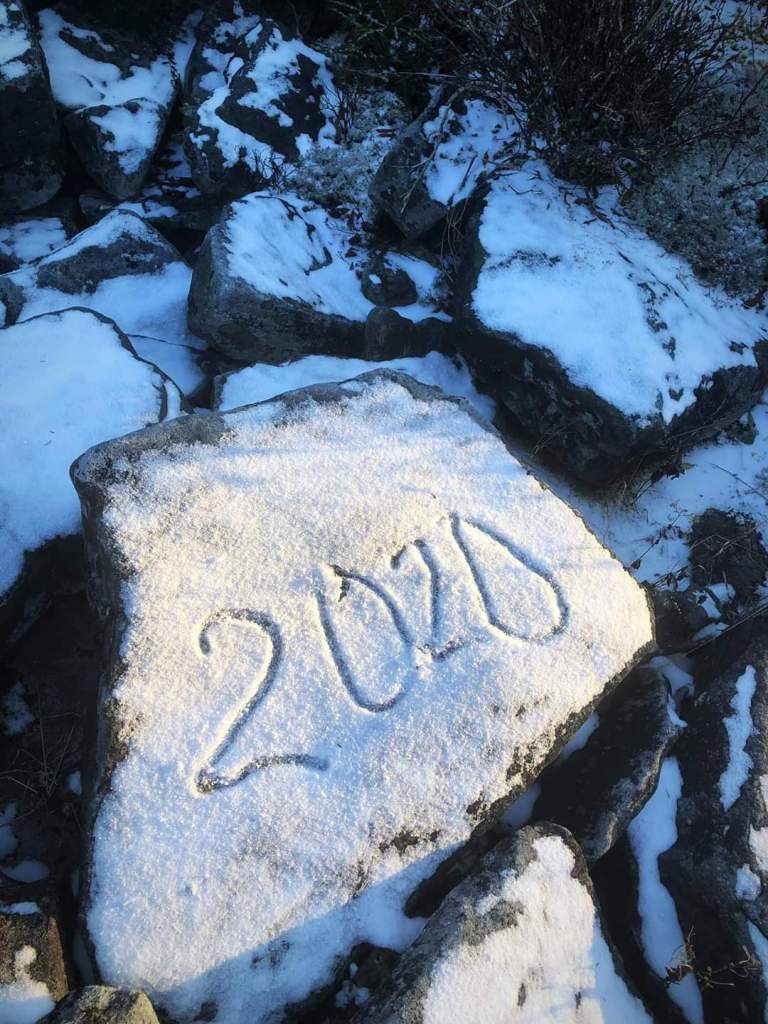
January 1, 2020
Jan 1(Wed)
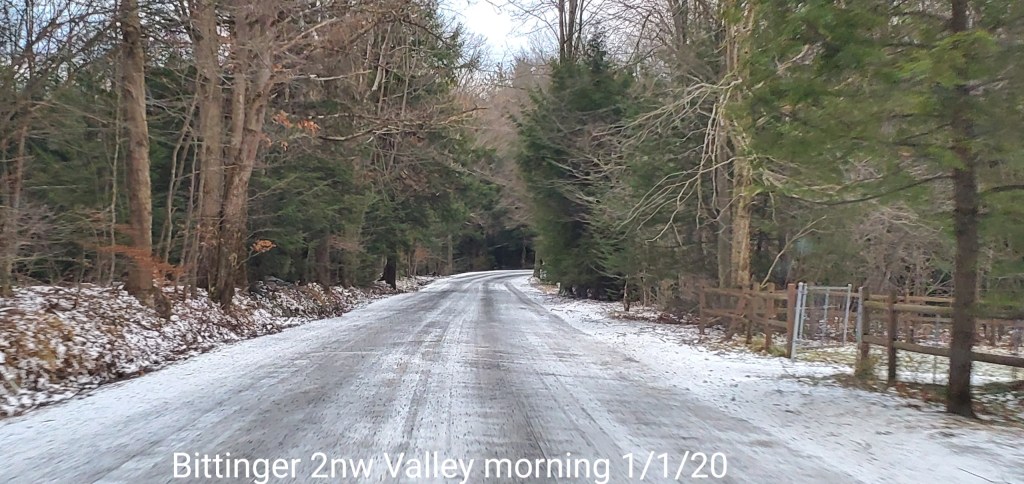
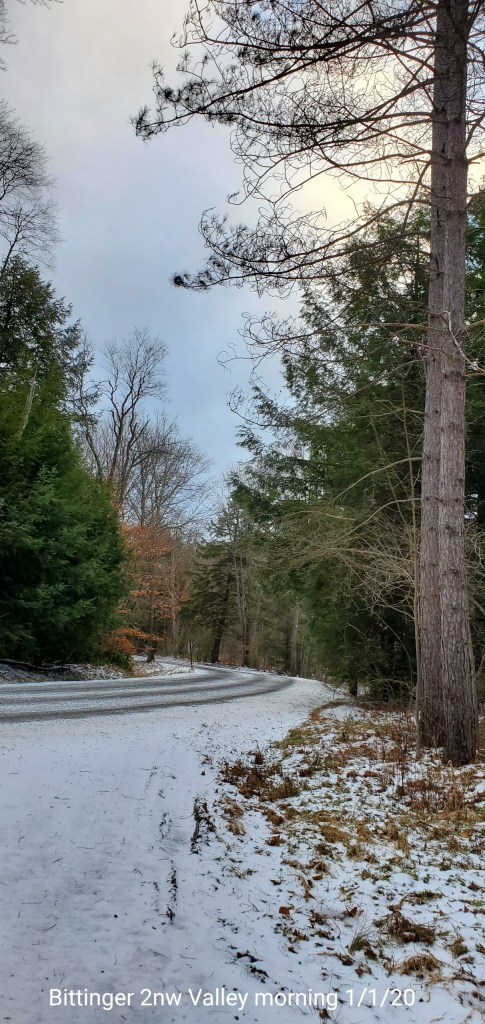
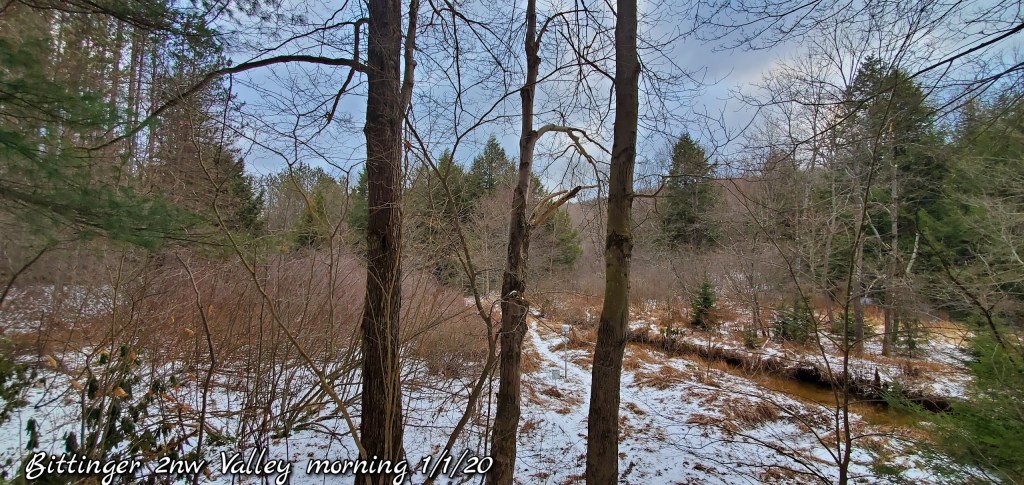
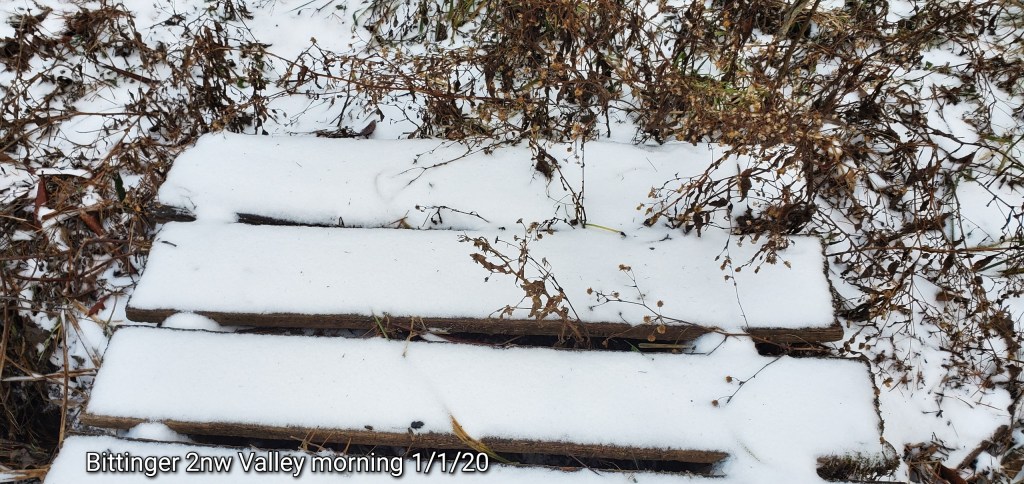
The day began cloudy, lingering flurries after pockets of light snow overnight. Skies broke and cleared as the day wore on.
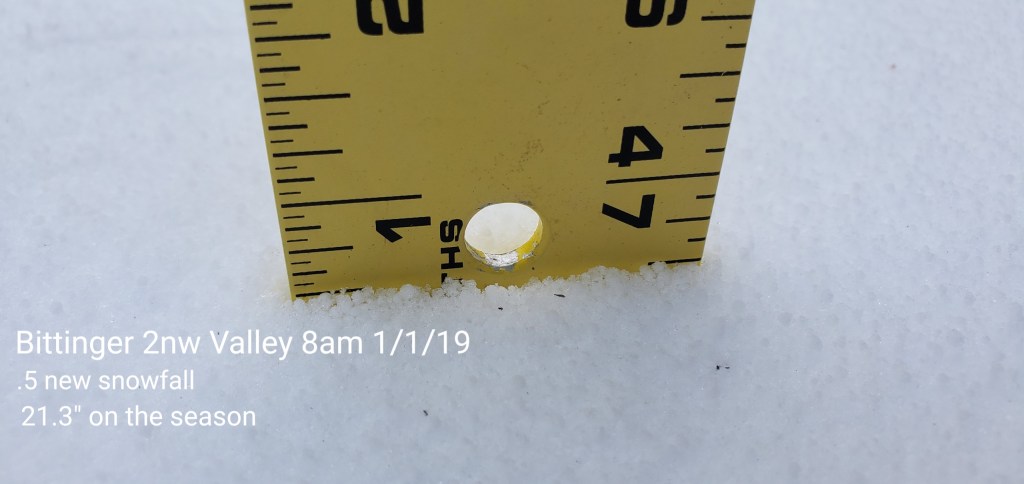
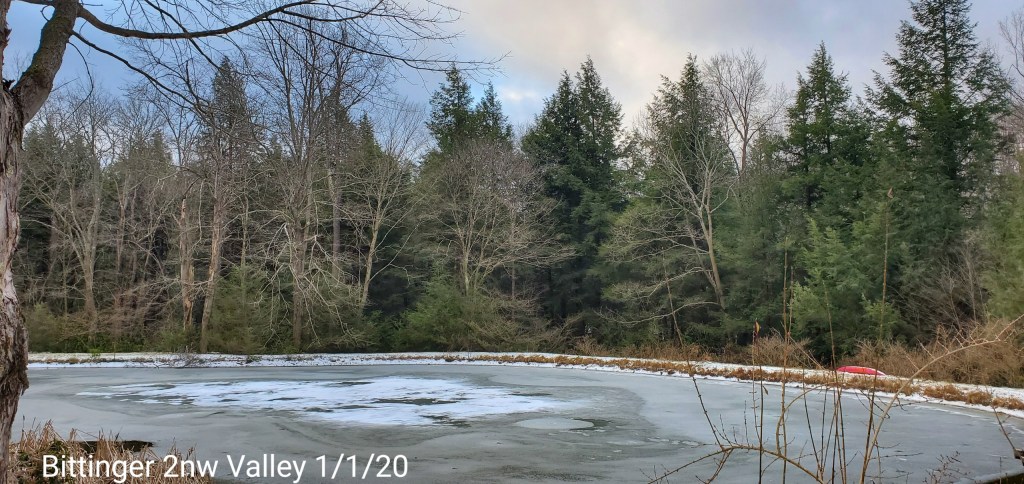
Bittinger 2nw Valley
MIN[23.9]—MAX[33.3]—AVERAGE MEAN[28.6]—TRUE AVERAGE[28.7]—PRECIP[0]
Snowfall- picked up .5″ overnight through completion
Season to date snowfall 21.3″

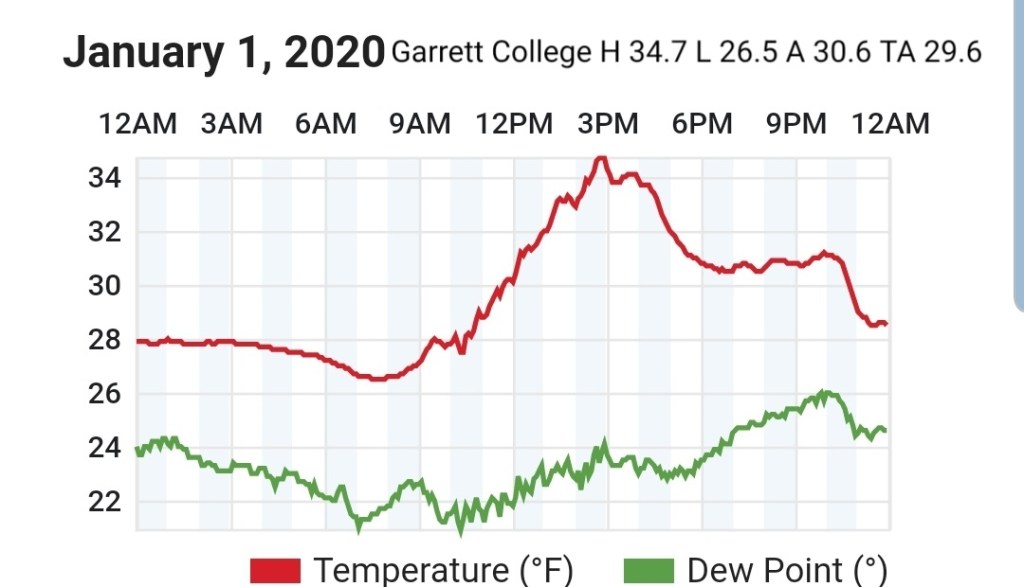
Garrett College
MIN[26.5]—MAX[34.7]—AVERAGE MEAN[30.7]—TRUE AVERAGE[29.6]—PRECIP[0]
Canaan Heights/Davis 3SE
MIN[22.0]—MAX[30.0]—AVERAGE MEAN[26.0]—PRECIP[T]
Snowfall-trace
Snowfall season to date 28.6″
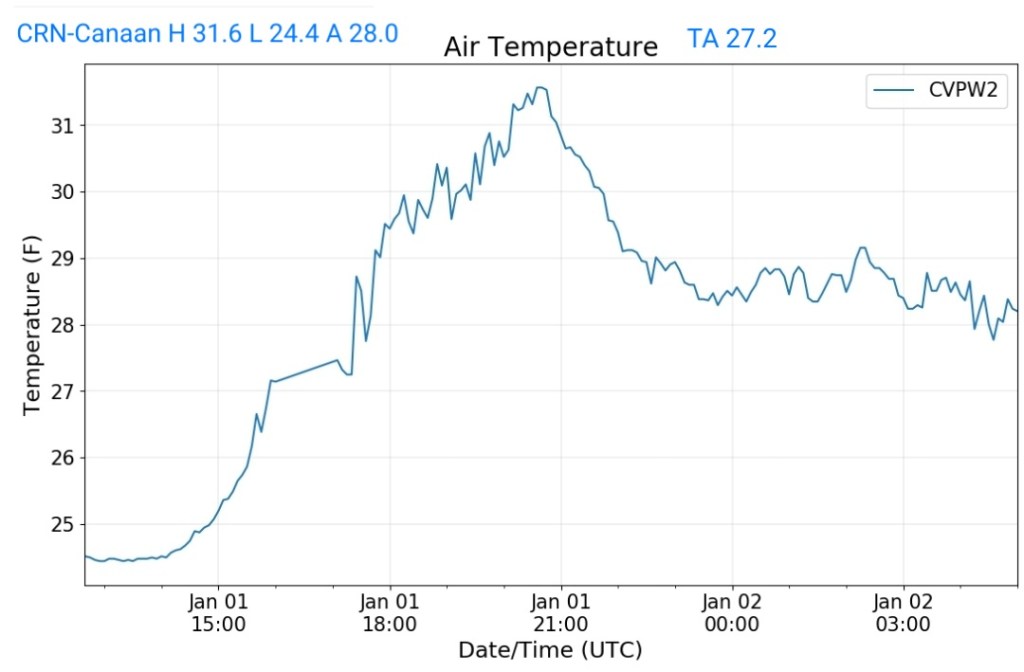
Climate Reference Network Canaan
MIN[24.4]—MAX[31.6]—AVERAGE MEAN[28.0]—TRUE AVERAGE[27.2]—PRECIP[0]
Cabin Mt at Bald Knob
MIN[19.4]—MAX[27.1]—AVERAGE MEAN[23.2]—TRUE AVERAGE[22.8]—PRECIP[0]

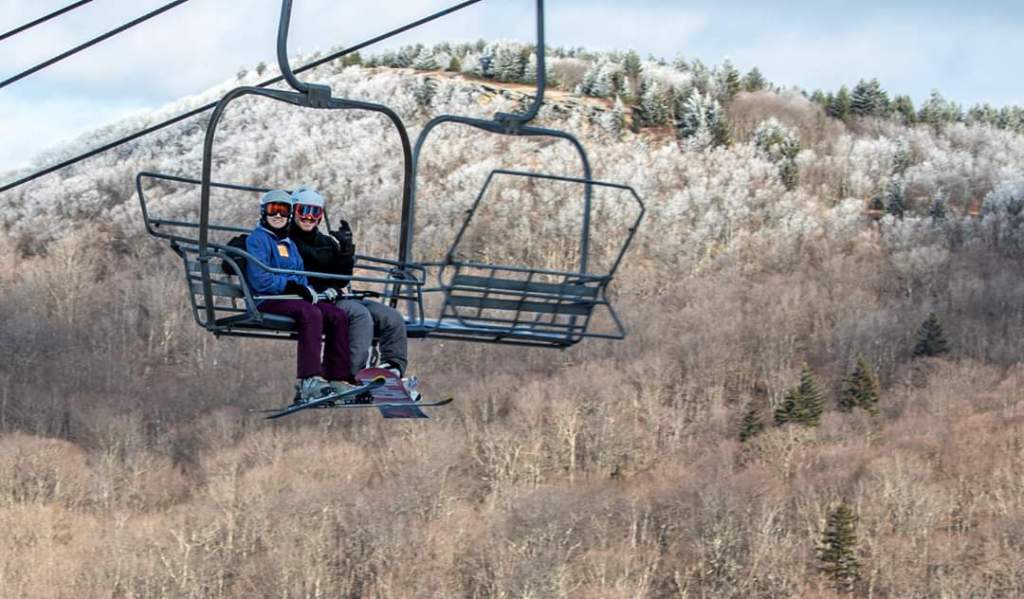
Photo by Justin Harris at Canaan Valley Resort looking towards Bald Knob today with some rime coated trees
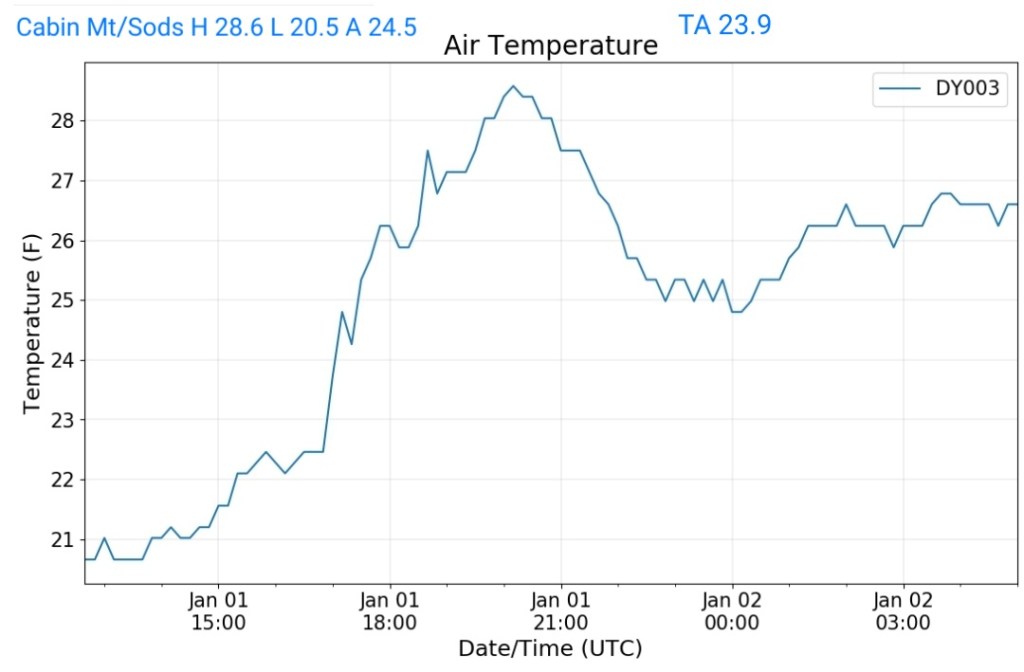
Cabin Mt-Western Sods
MIN[20.5]—MAX[28.6]—AVERAGE MEAN[24.5]—TRUE AVERAGE[23.9]—PRECIP[0]
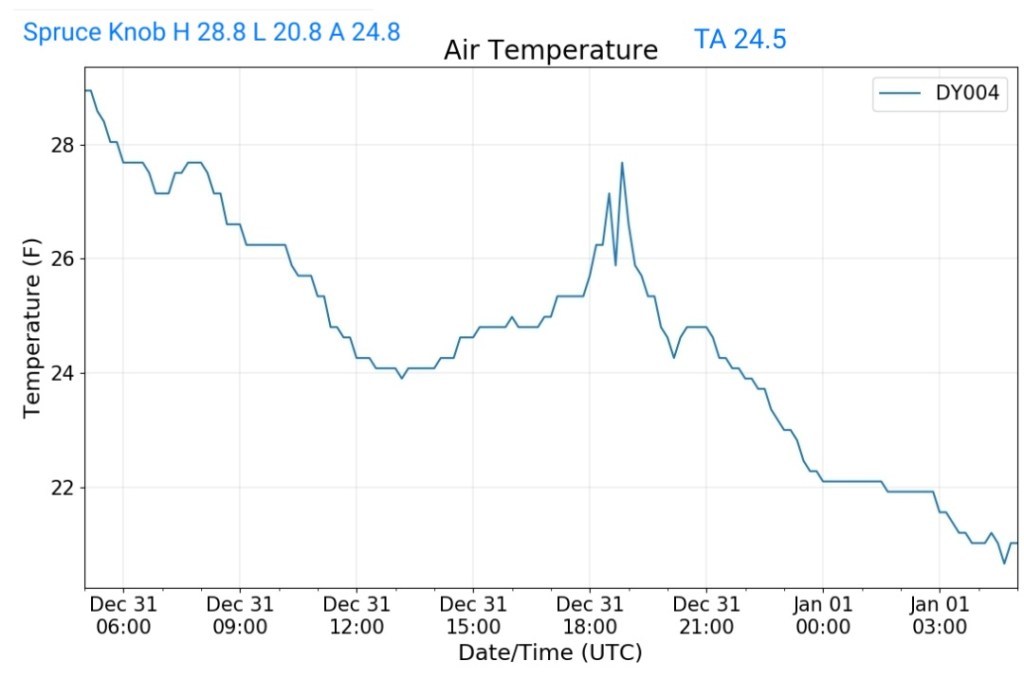
Spruce Knob
MIN[20.8]—MAX[28.8]—AVERAGE MEAN[24.8]—TRUE AVERAGE[24.5]—PRECIP[0]
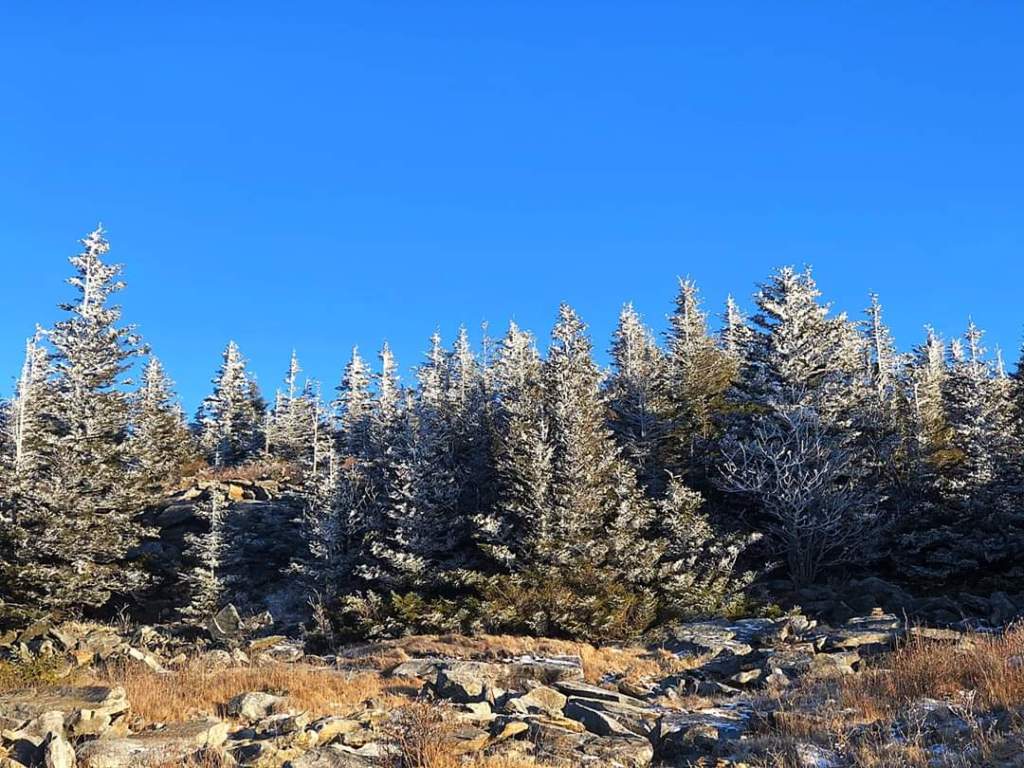
Photos today by Ashley Berg at Spruce Knob
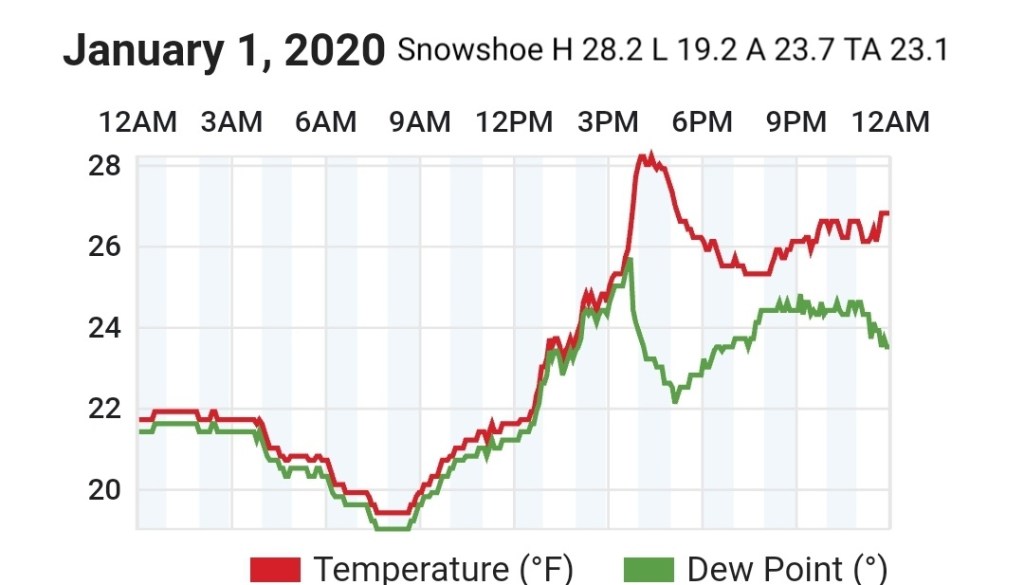
Snowshoe
MIN[19.2]—MAX[28.2]—AVERAGE MEAN[23.7]—TRUE AVERAGE[23.1]
Canaan Valley Refuge
MIN[15.3]—MAX[33.4]—AVERAGE MEAN[24.3]—TRUE AVERAGE[27.2]

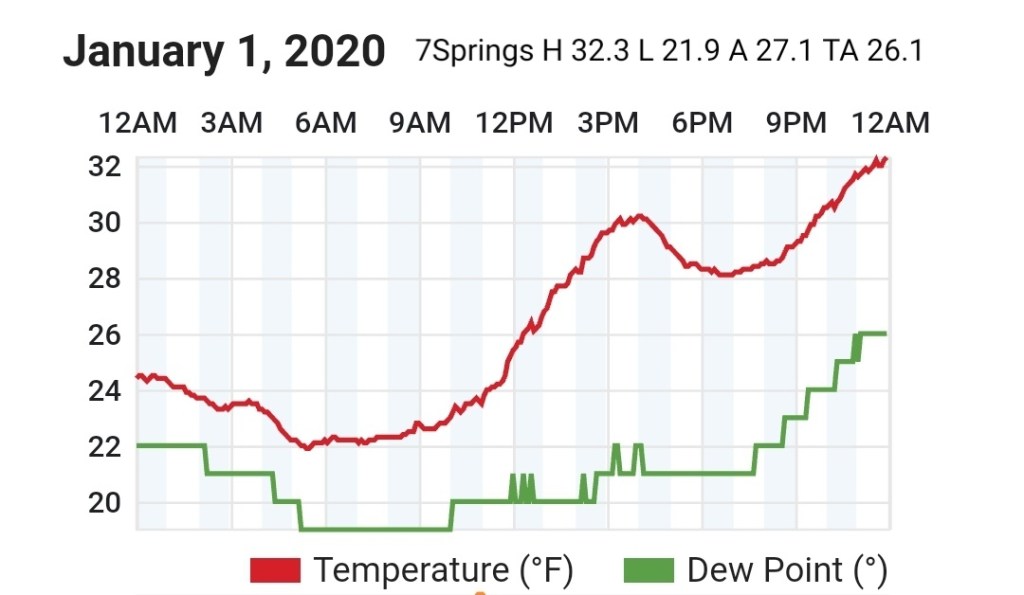
7Springs
MIN[21.9]—MAX[32.3]—AVERAGE MEAN[27.1]—TRUE AVERAGE[26.1]
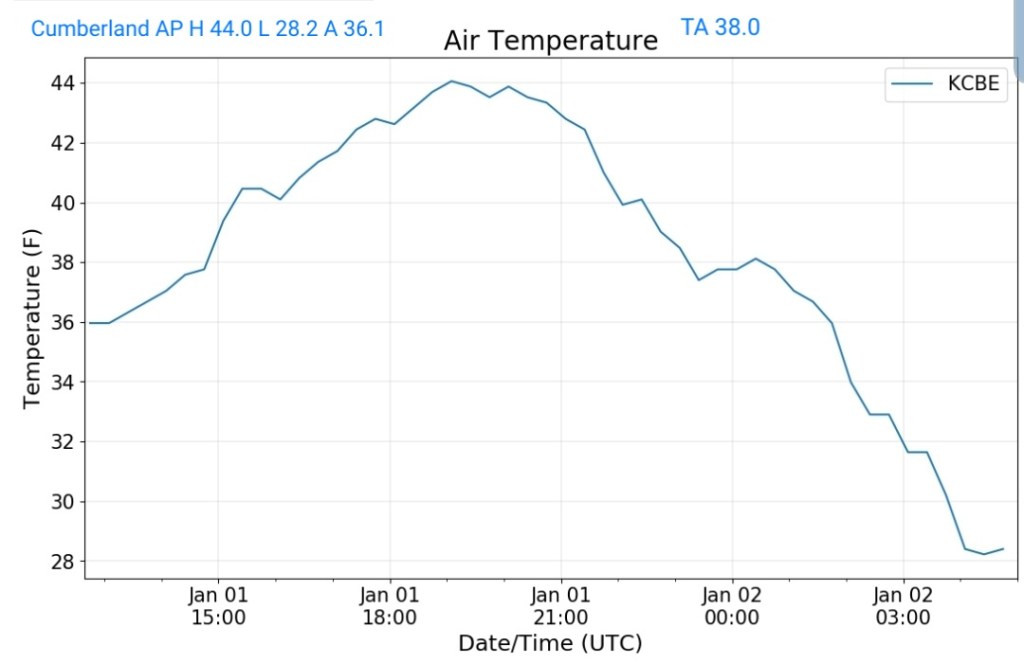
Cumberland Airport
MIN[28.2]—MAX[44.0]—AVERAGE MEAN[36.1]—TRUE AVERAGE[38.0]
The Valley vs Cabin Mt

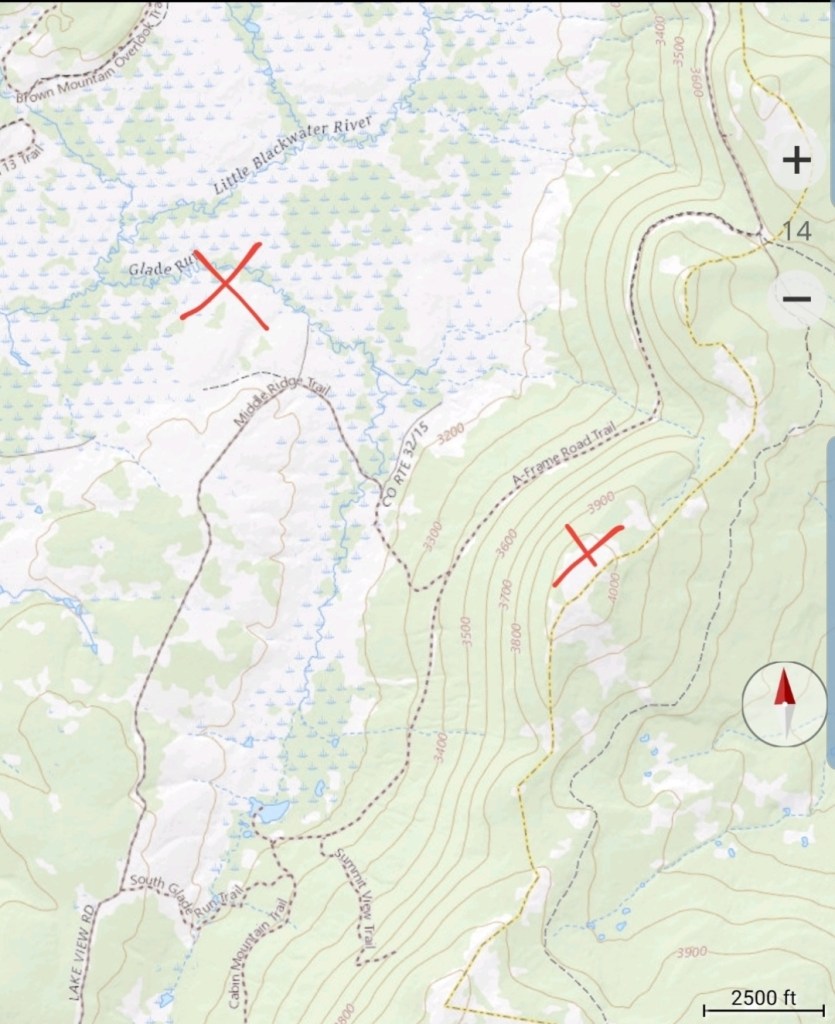
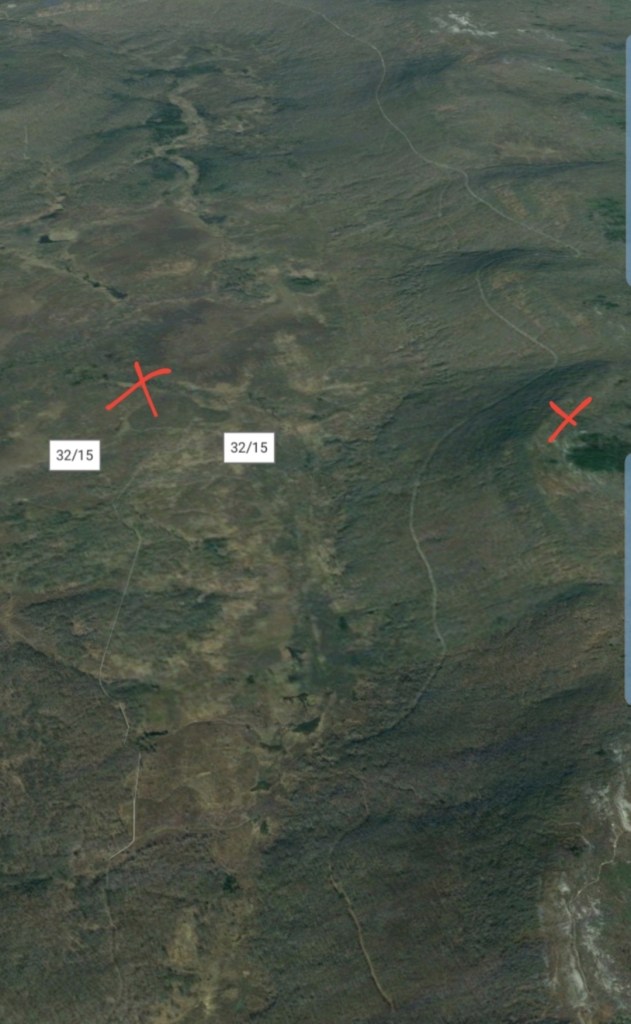
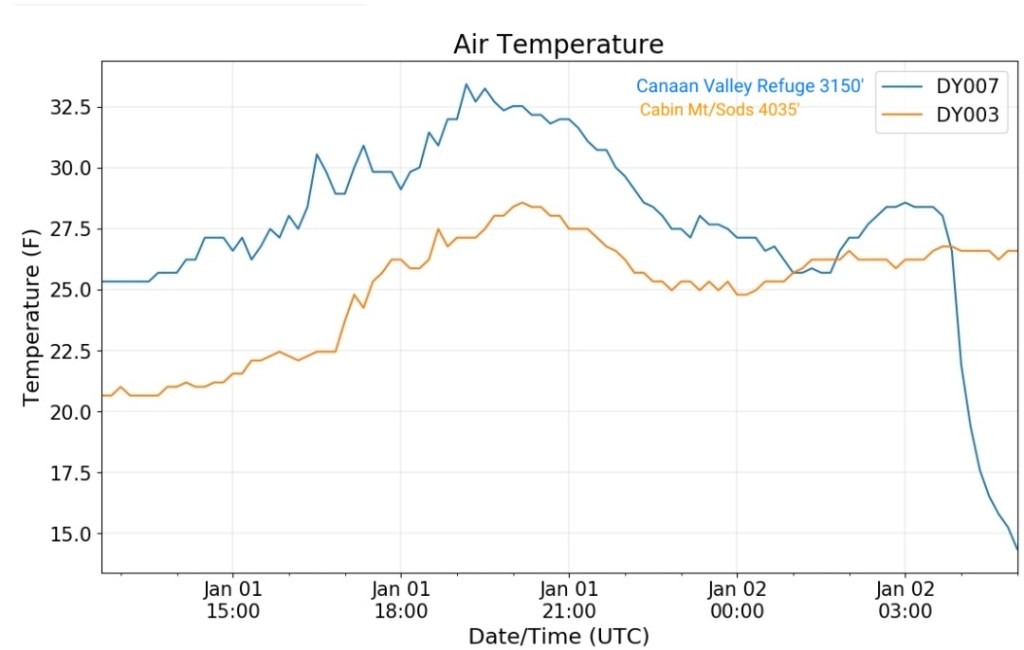
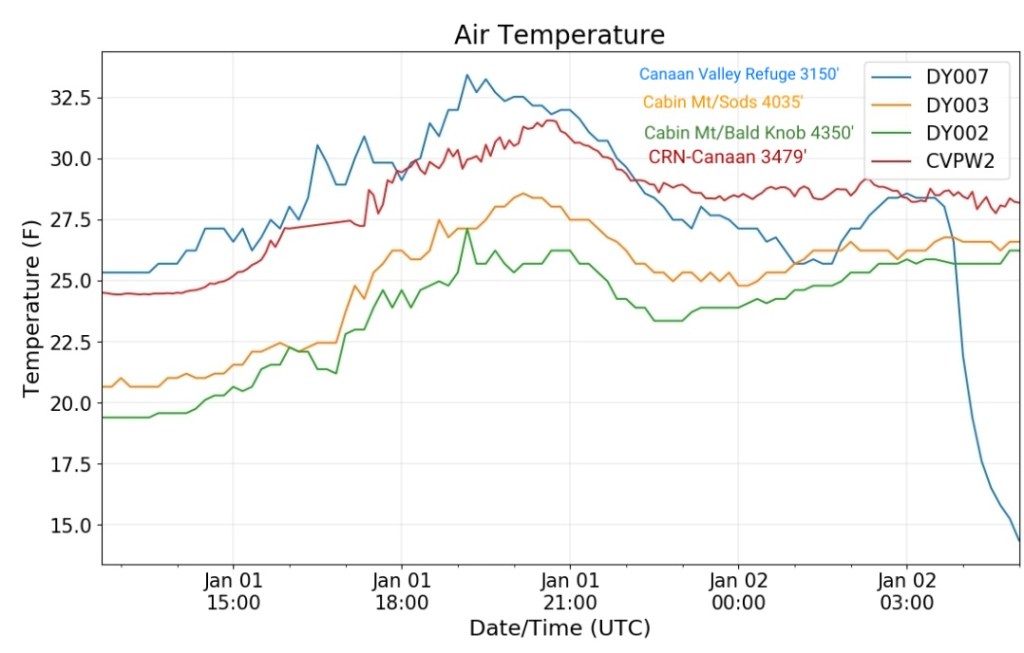
Canaan area temps
Comparison view

RTMA
Radar
Void. Few morning flurries not detected
Satellite
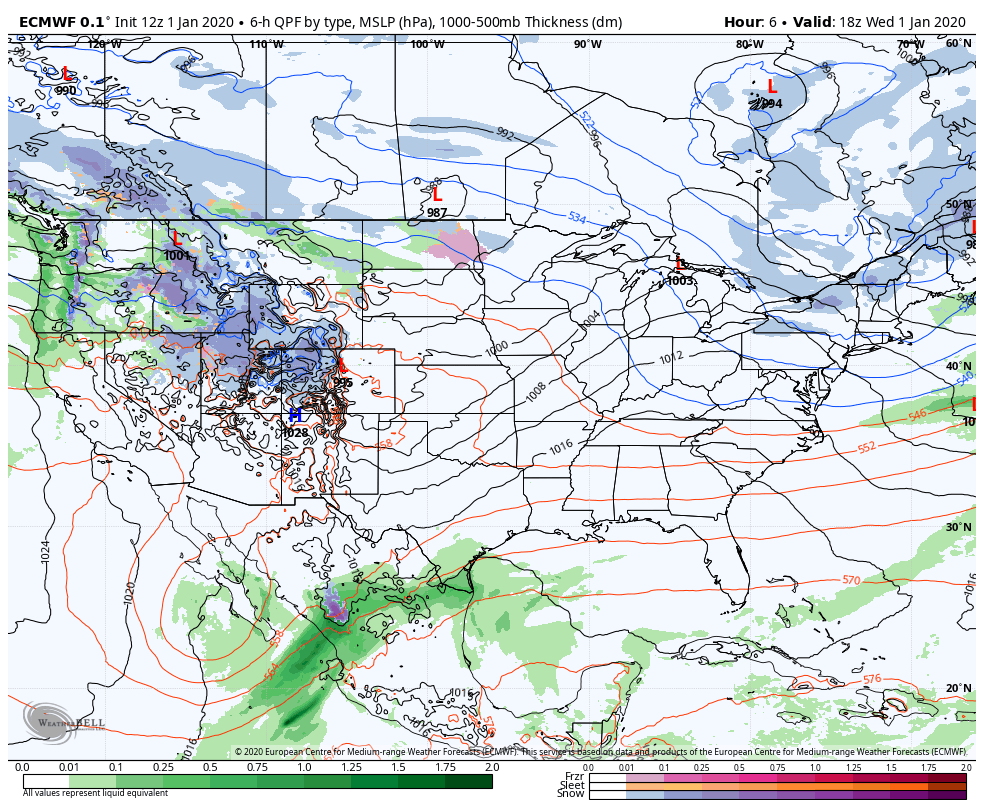
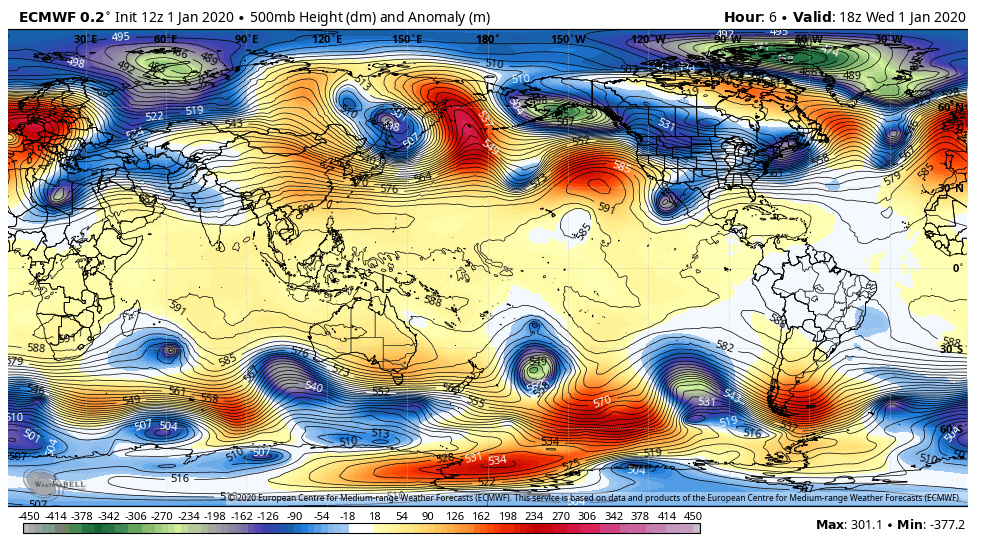
Flow
Surface features and 500mb height anomalies and flow
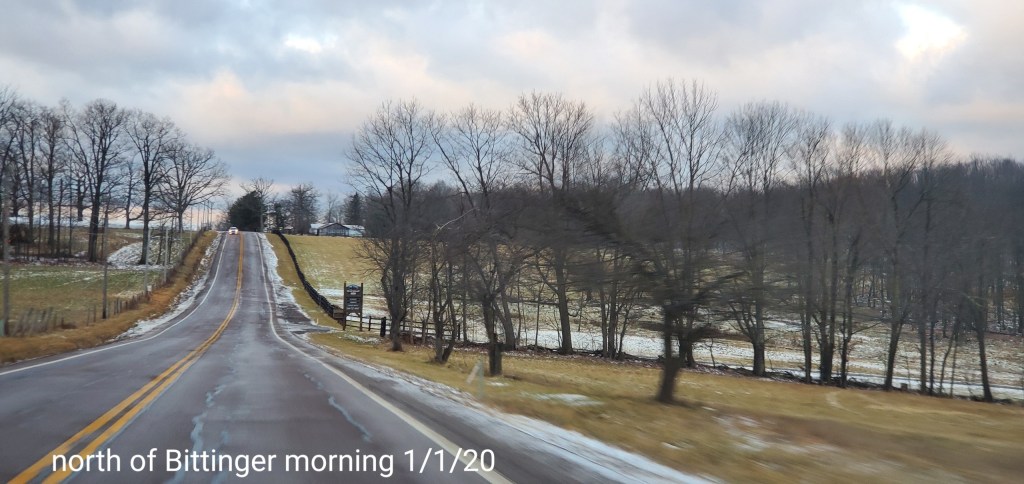
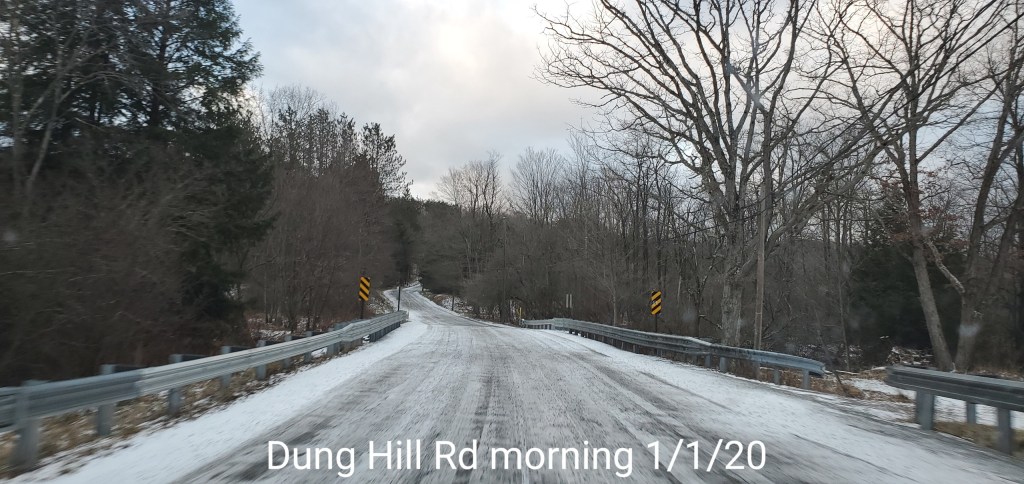
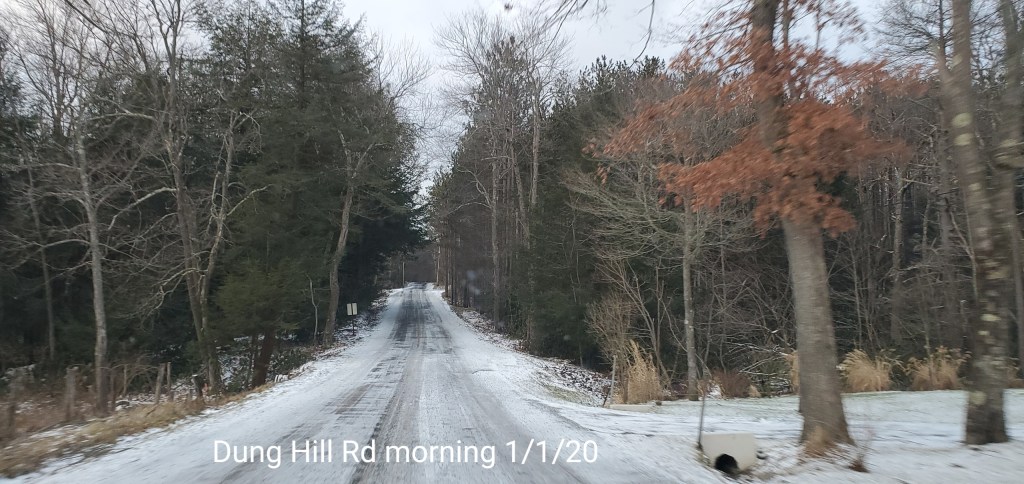
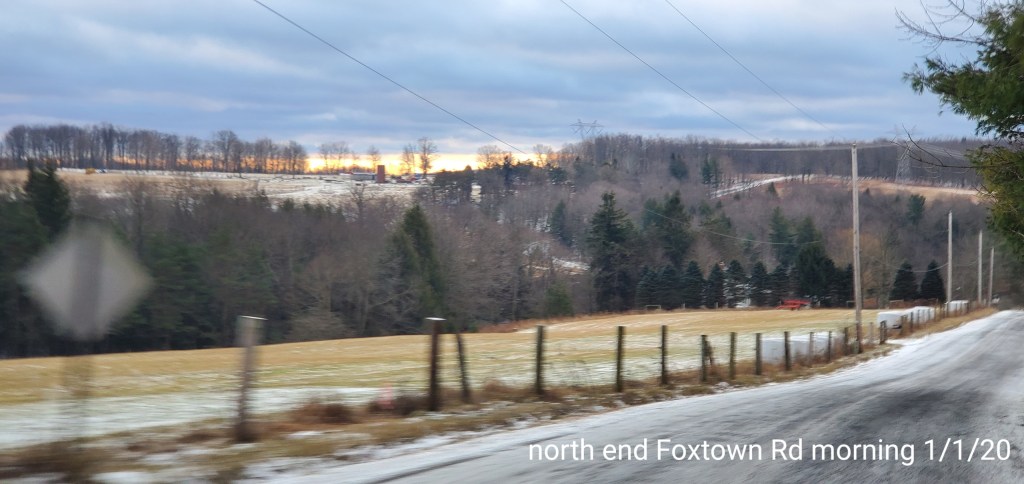
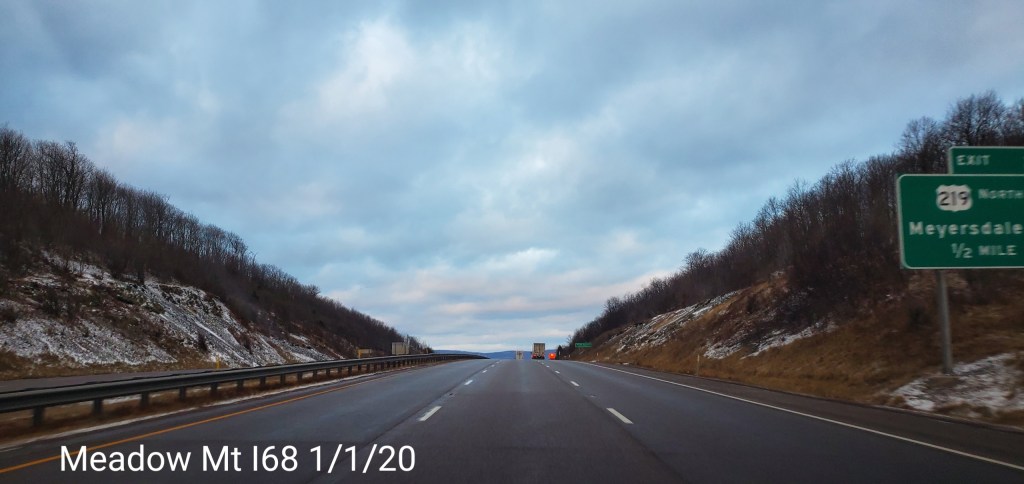
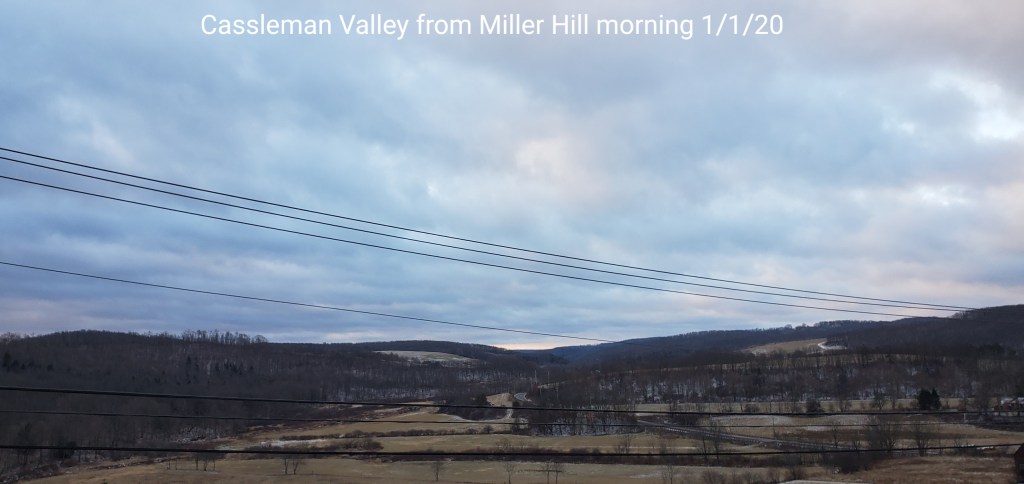
Pics today
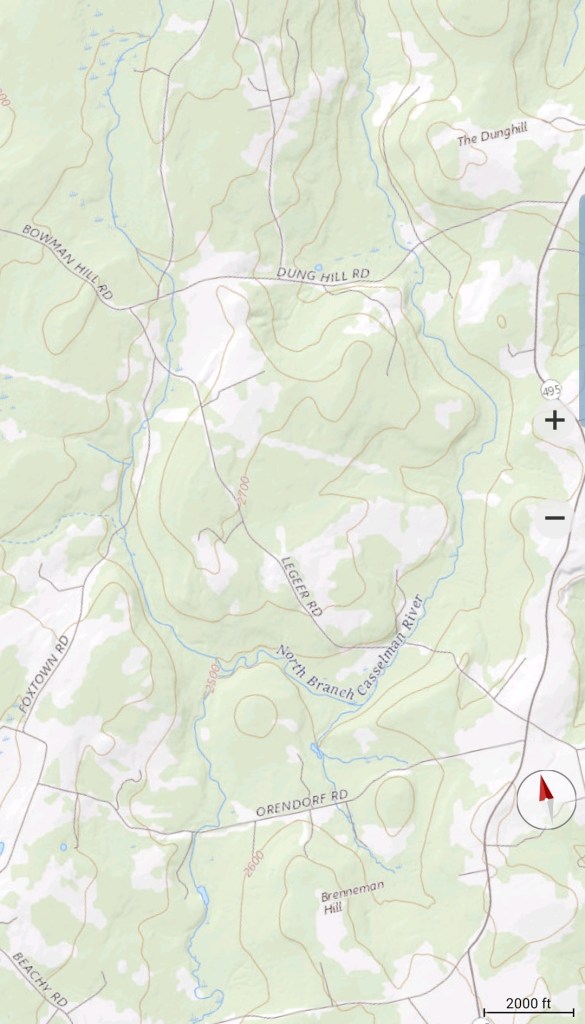
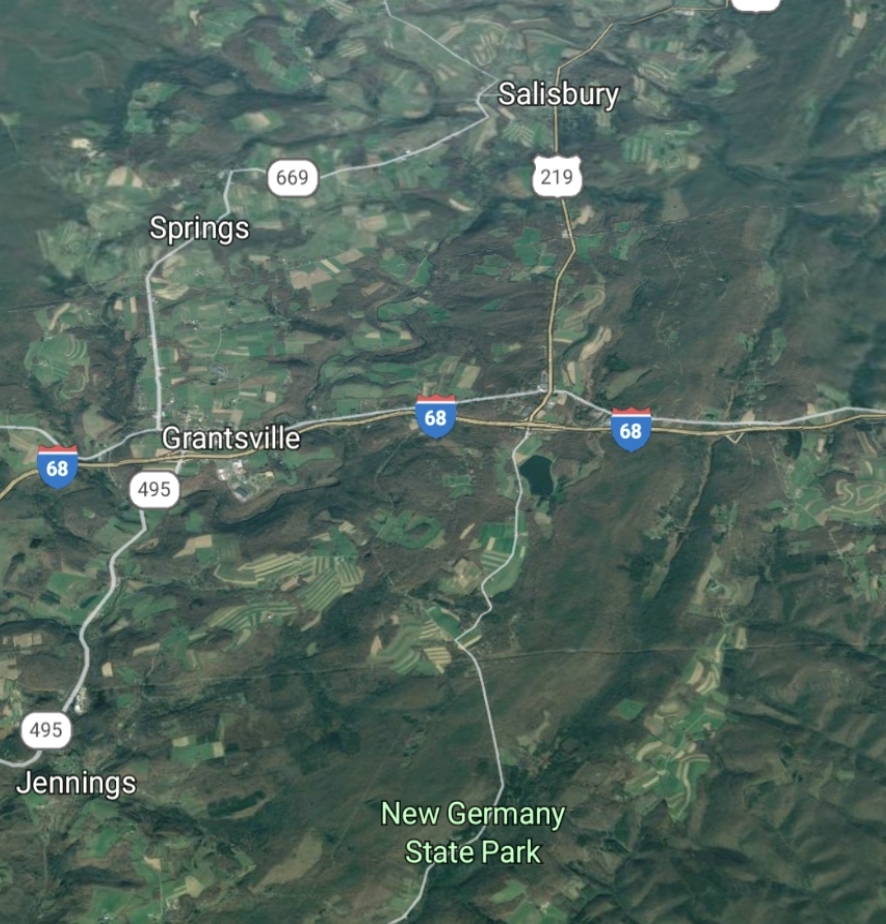
Bittinger area
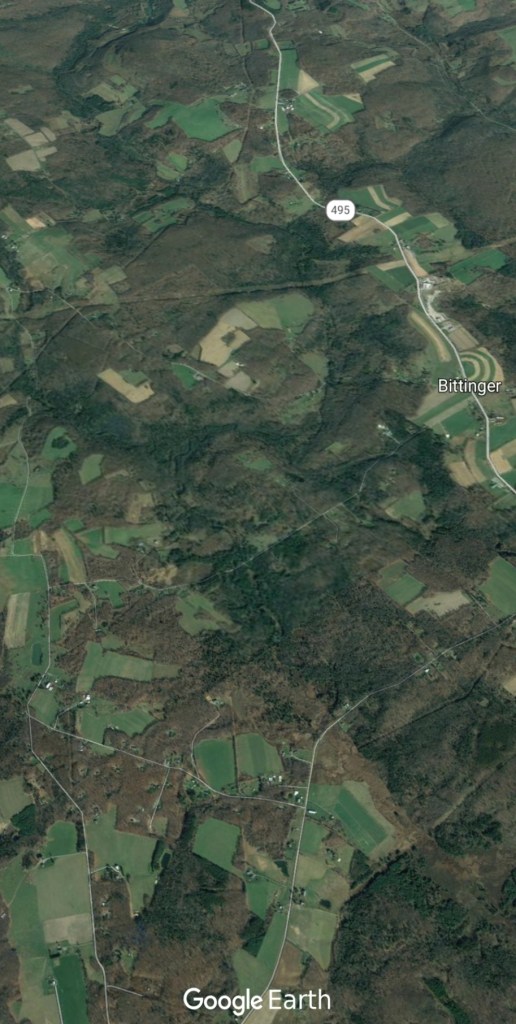


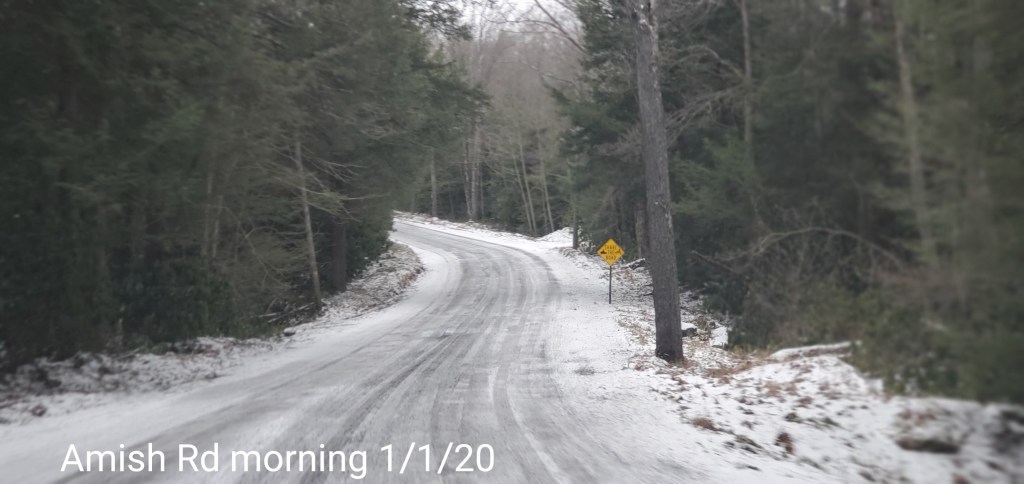
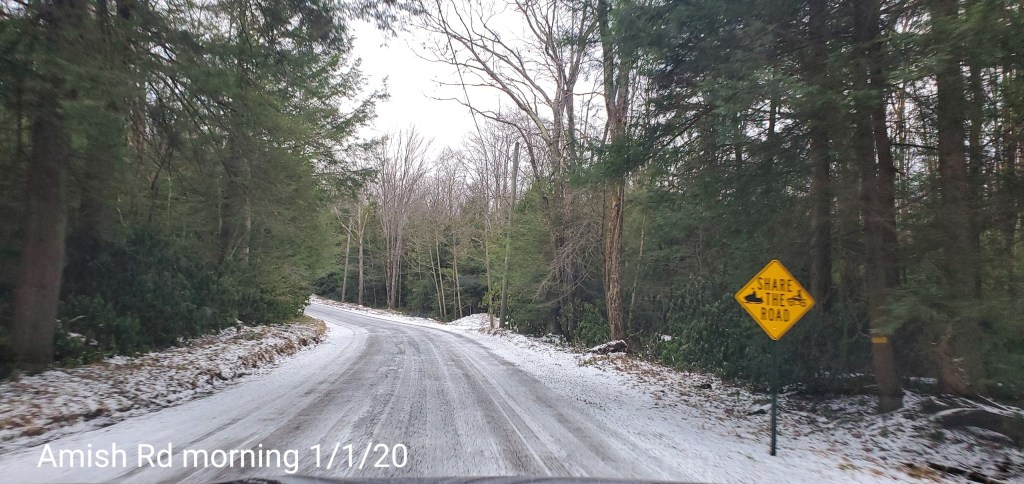
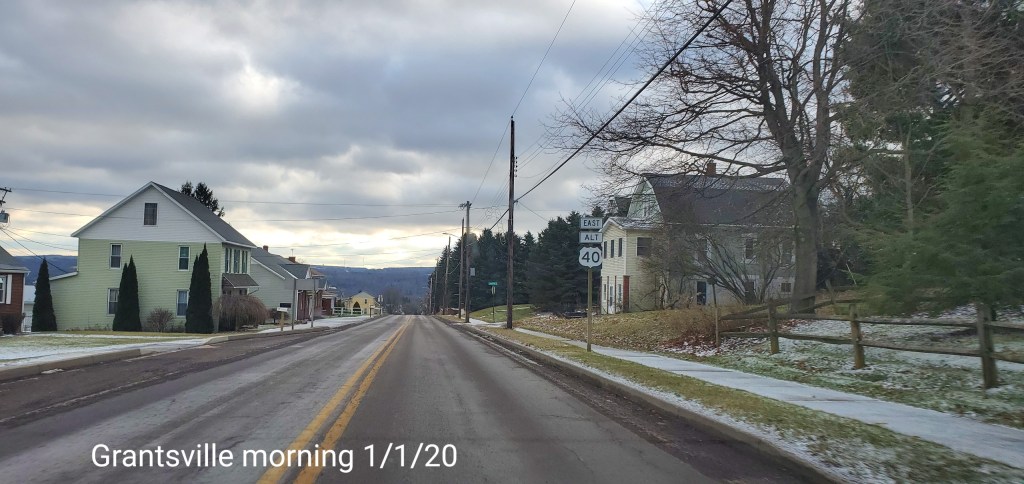
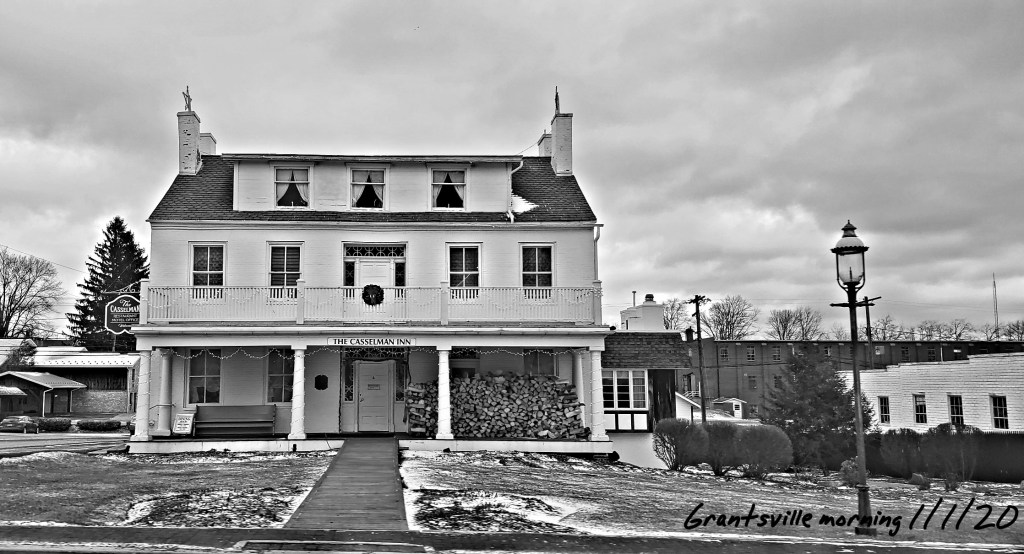
Grantsville area
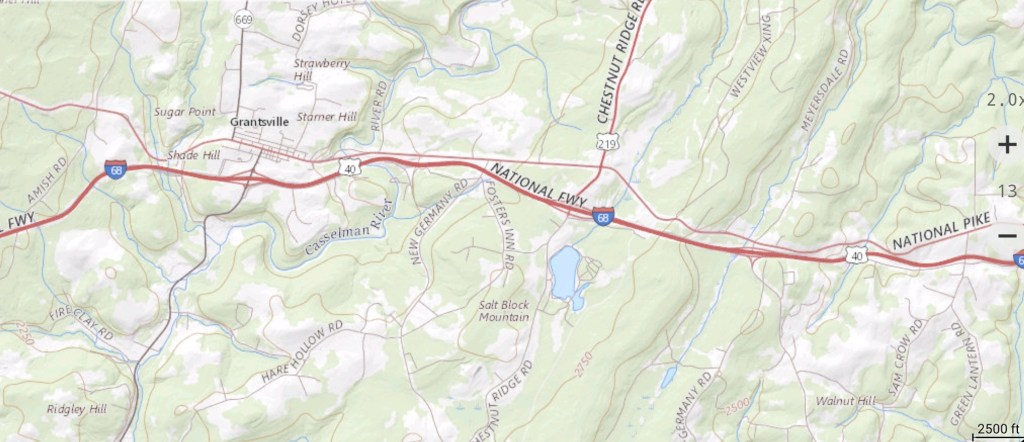
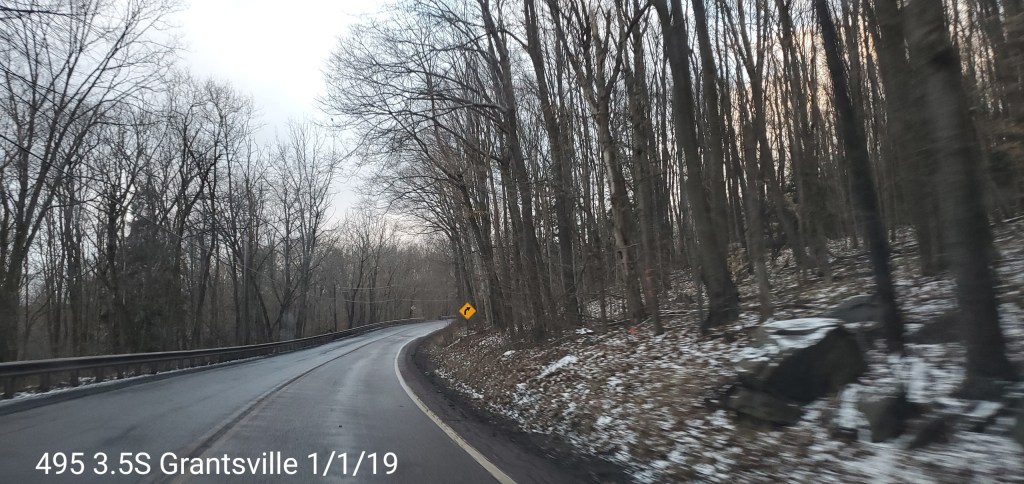
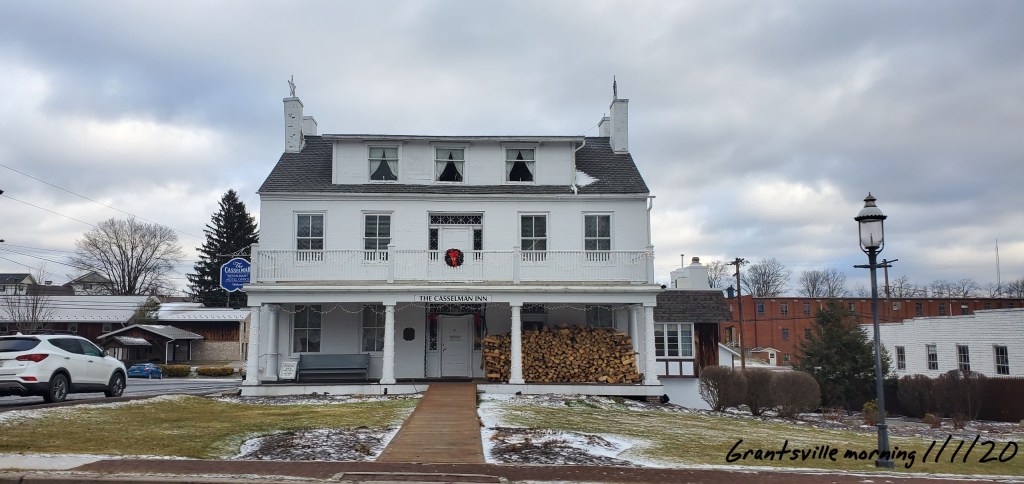
a little back in time look
January trends across the high ground….
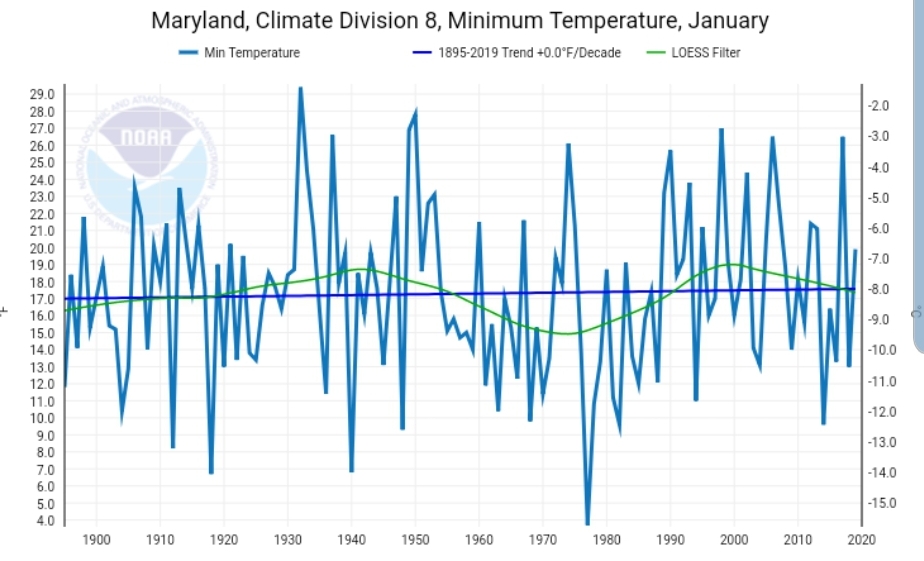
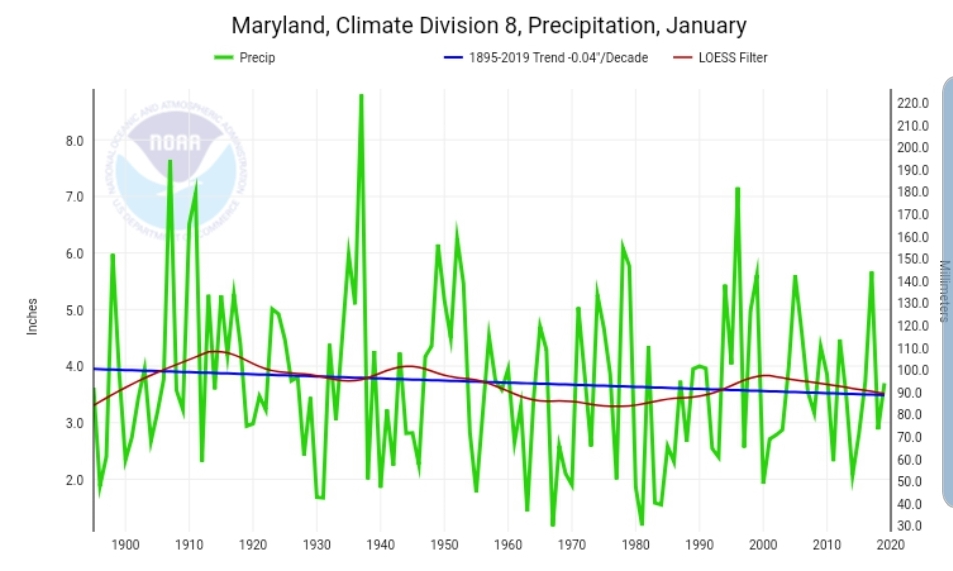
In Maryland, Climate Division 8, which is solely Garrett County
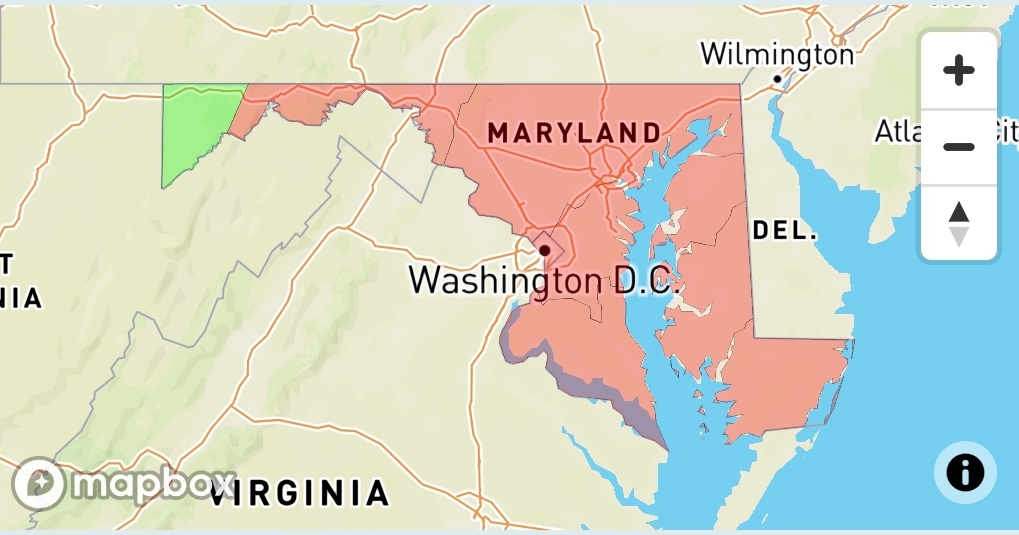
Average January temperature trend

Maximum temperature trend

Minimum temperature trend
Precipitation trend
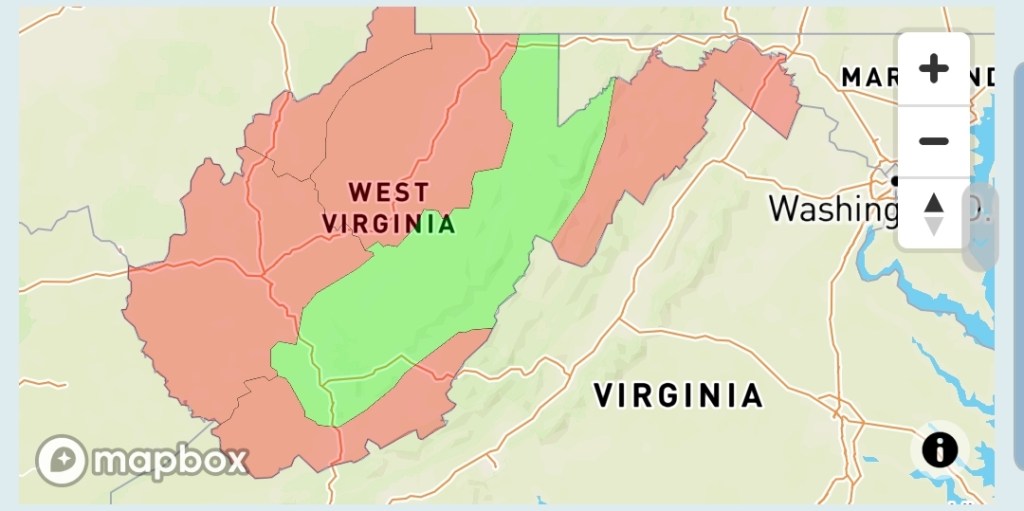
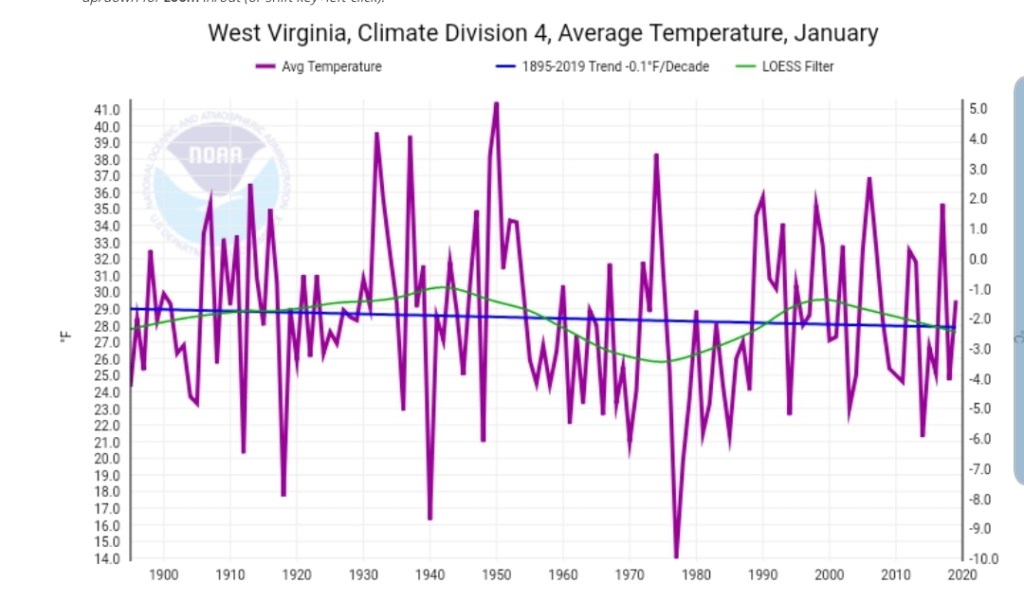
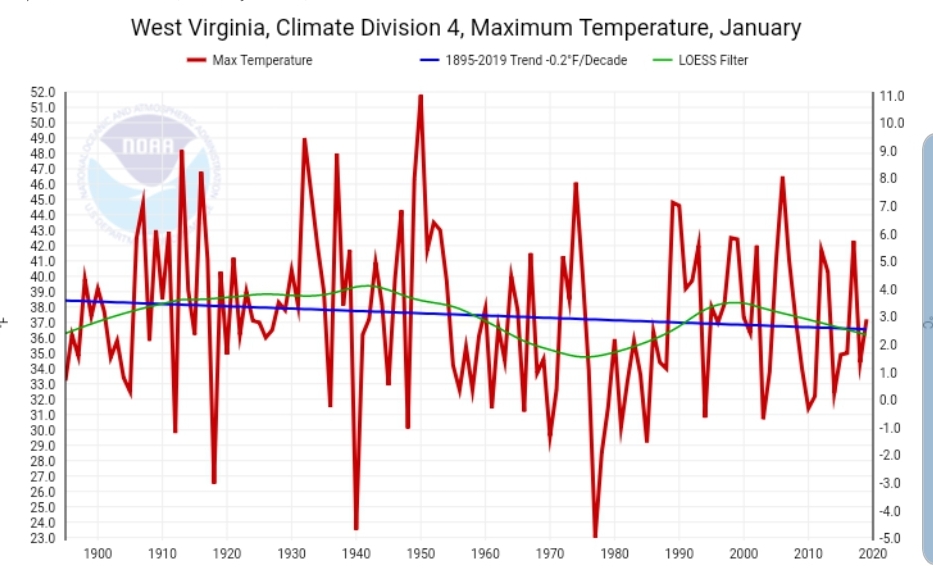
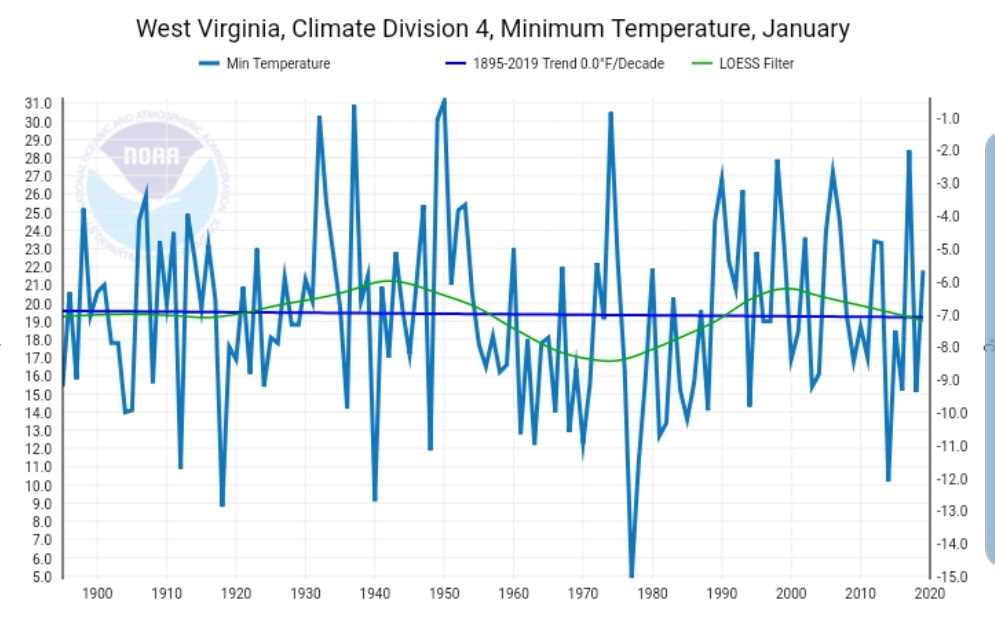
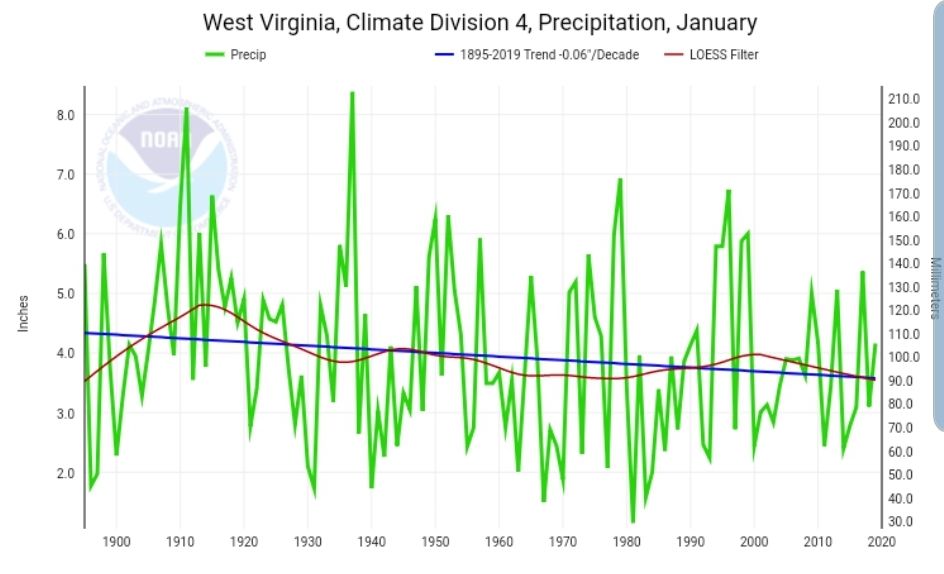
West Virginia, Climate Division 4
Average January temperature trend
Maximum temperature trend
Minimum temperature trend
Precipitation trend
Looking ahead…..
Here we are on the first, looking out. The signals look warm, as has been posted the past few days. Nothing much has changed today. We have a window however that looks to produce snow. That sits between the 5th to the 9th and 2 potential moderate events. I will post model snowfall images, but only for the sake of seeing how they performed after the event(s) is over. So far models have been performing subpar on snowfall amounts. This last event, only the ECMWF performed well. Let’s look
It went from showing nothing, to light amounts, an occasional run would put out 1-2″, but this was the primary look of the model
A quick evaluation of this most recent performance
(Initialized top left)
Reality turned out like

The new upgraded GFS looked like
And the model held several inches in spots up through yesterday mornings run. Total bust and just terrible by this “upgraded” American model. It definitely needs to be approached with caution. That said, the Nam and Canadian products were poor as well.
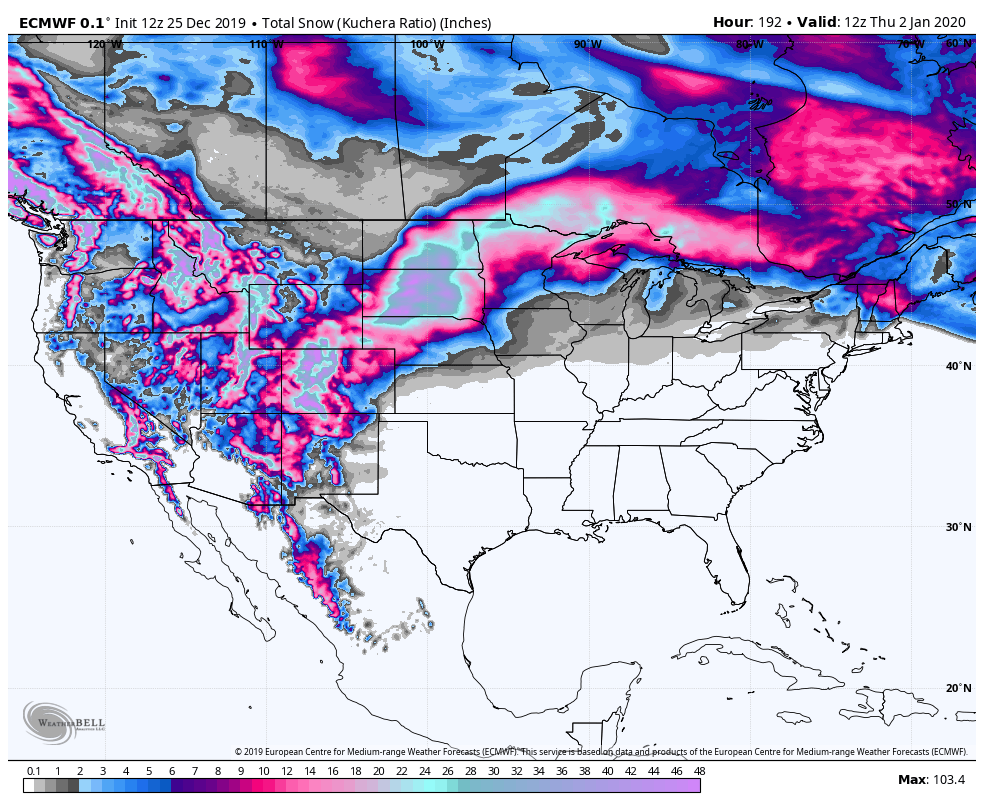
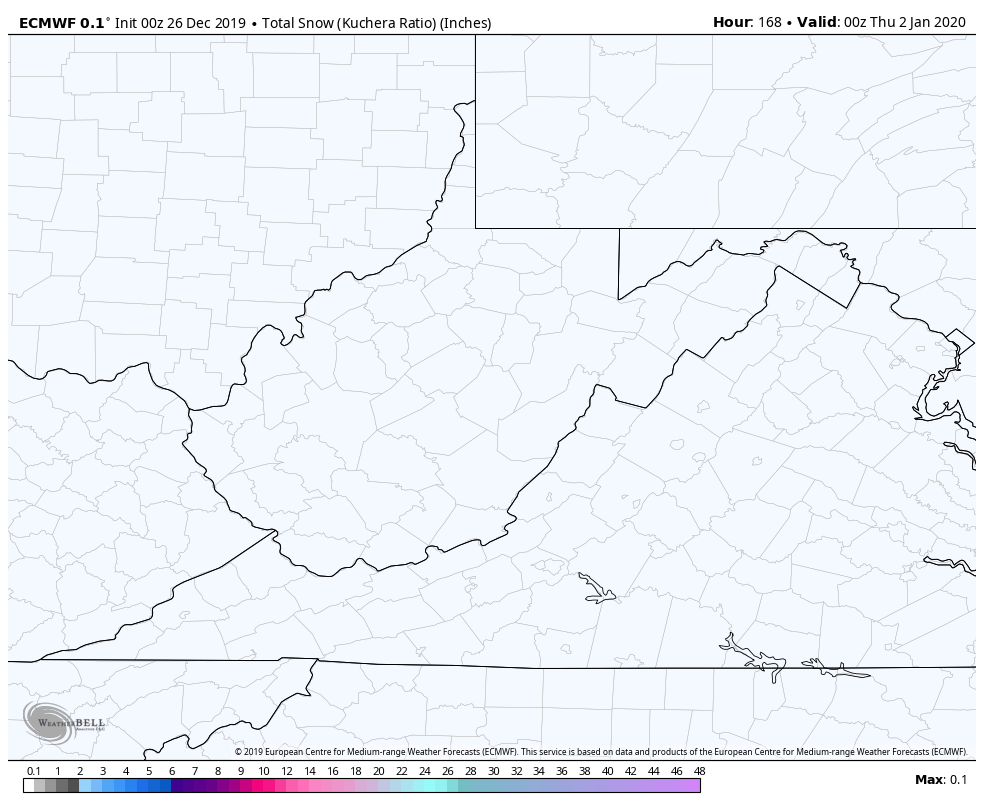
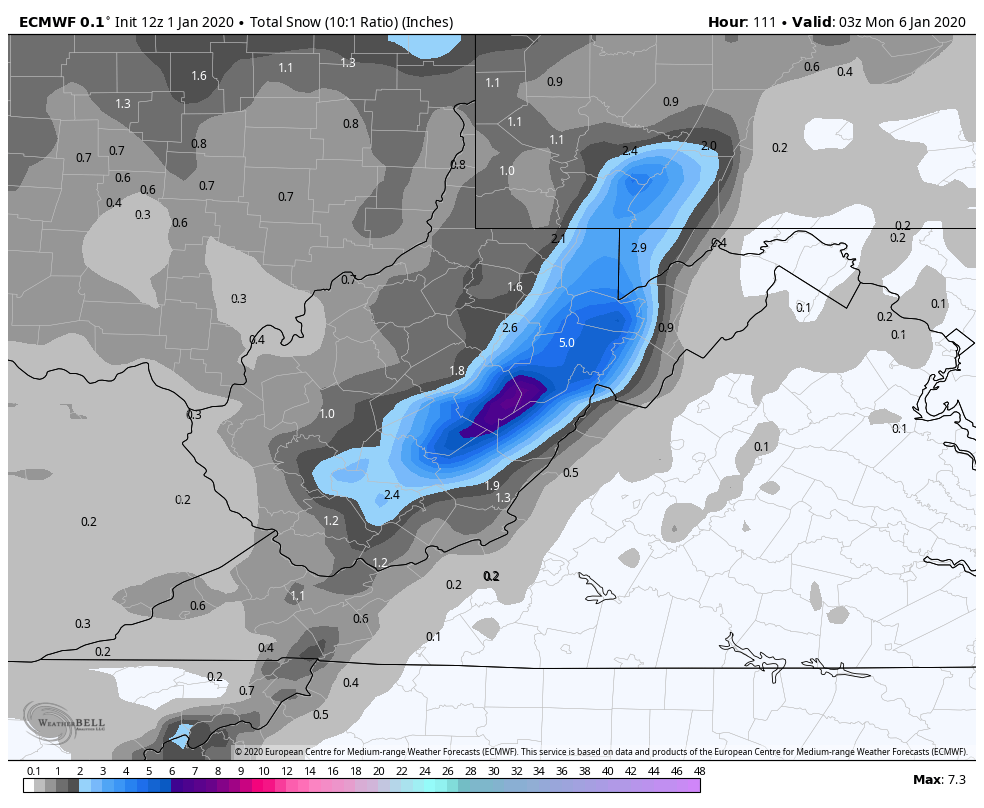
Now, looking ahead, the 12z ECMWF
The 2 potential events that need watched
Through those 2 events the 12z ECMWF puts out-
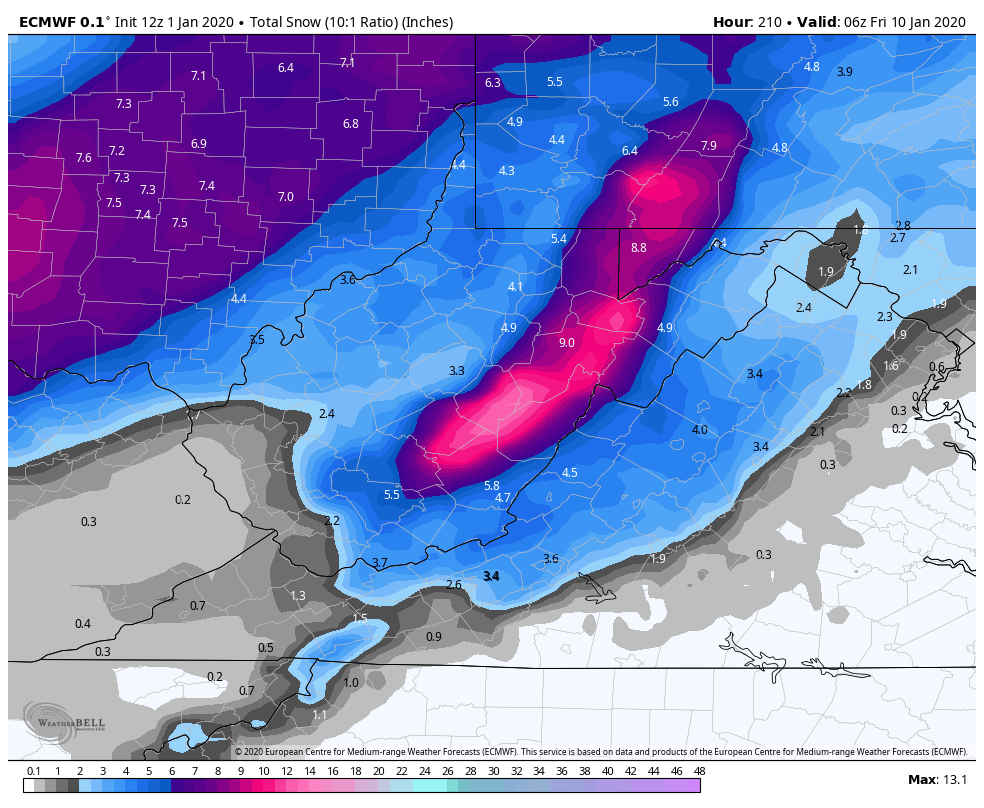
At the 10-1 ratio parameter
Through the first event
Total for both
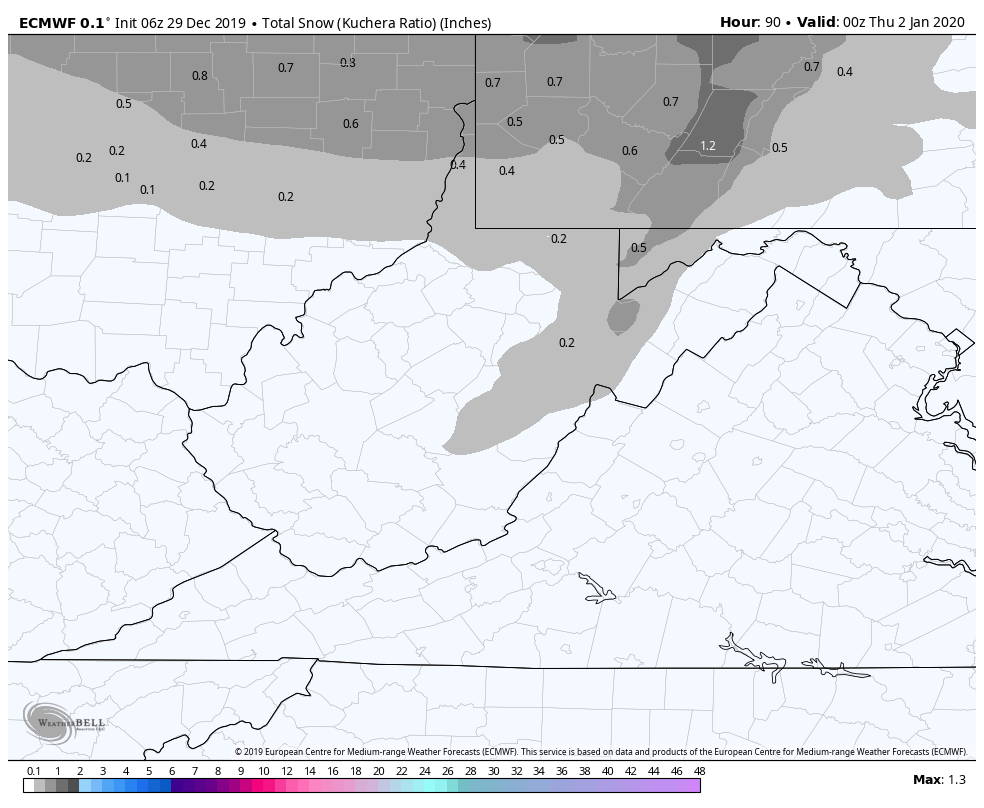
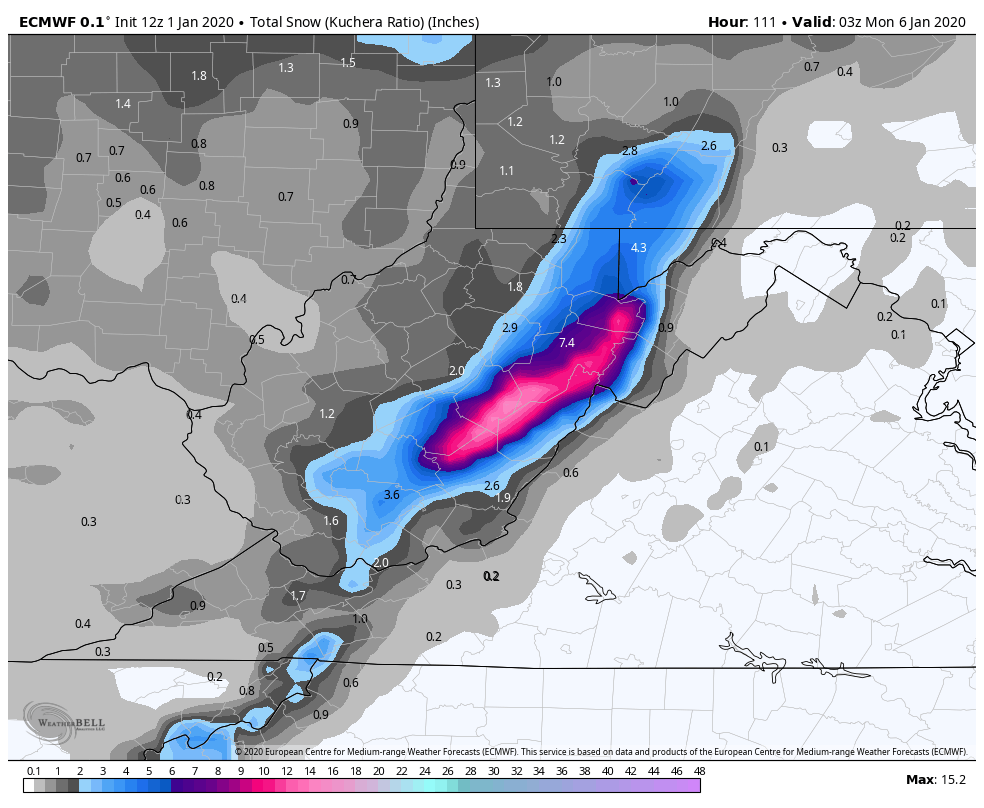
Using the Kuchera ratio off the model. Back earlier in the winter I emailed Tom Downs from weatherbell that the kuchera parameter was continously showing less than 10 to 1. If anyone around here records snow, observes others observations, they’ll know 10 to 1 is NOT a typical snow ratio in the area. He went in and looked at it and returned with –
“A filter was added to better restrict the max temperature from being included on pressure levels that are below ground level. Moving forward, any differences you see in Kuchera will be from the additional pressure level data that we include in the calculations.” Now I question if this had any impact on over doing the kuchera ratio amounts.
Kuchera ratio through first event
Through both events
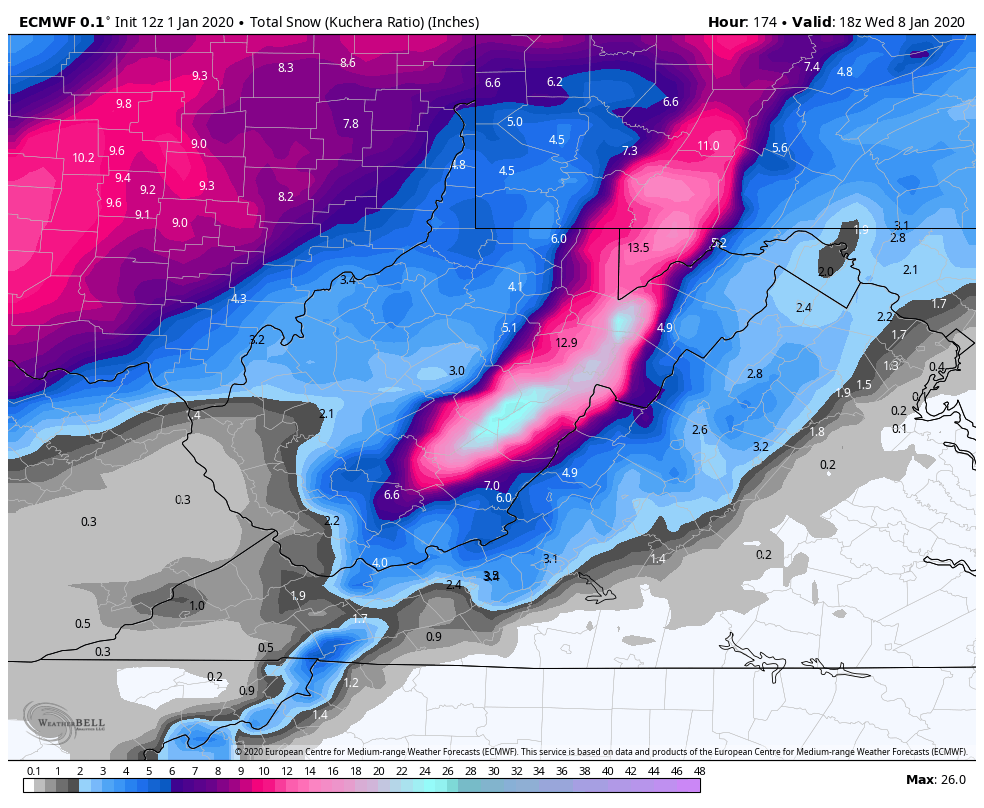
This is suggesting a 20 to 1 type of events and it looks like it should be a touch under that.
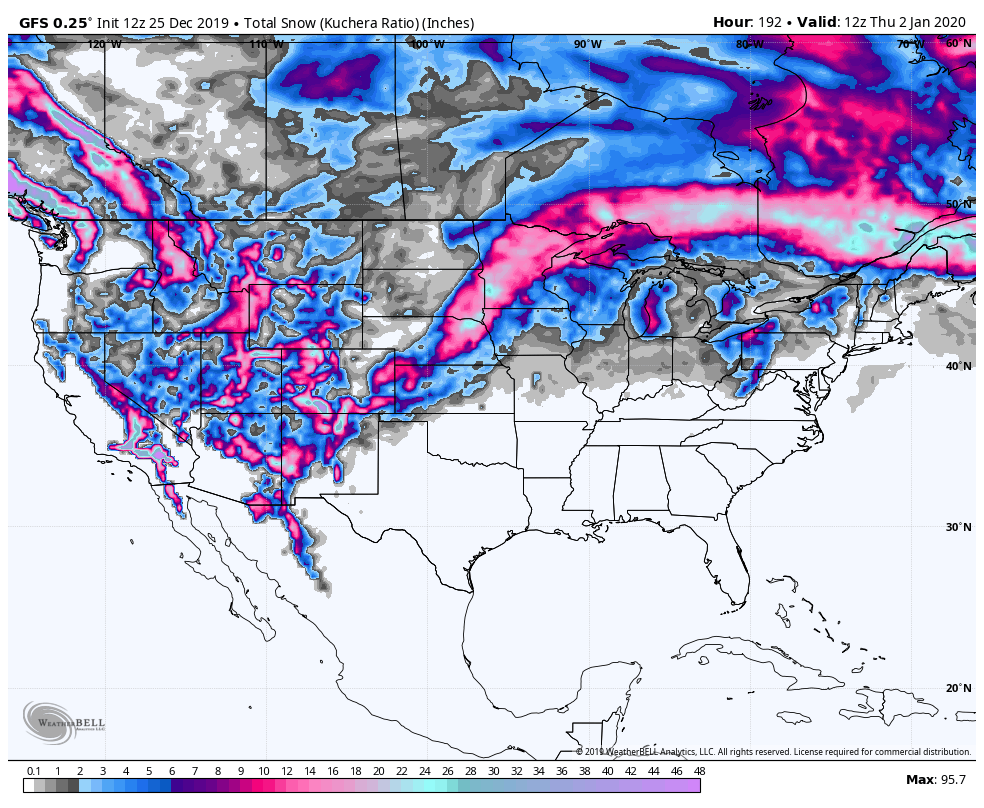
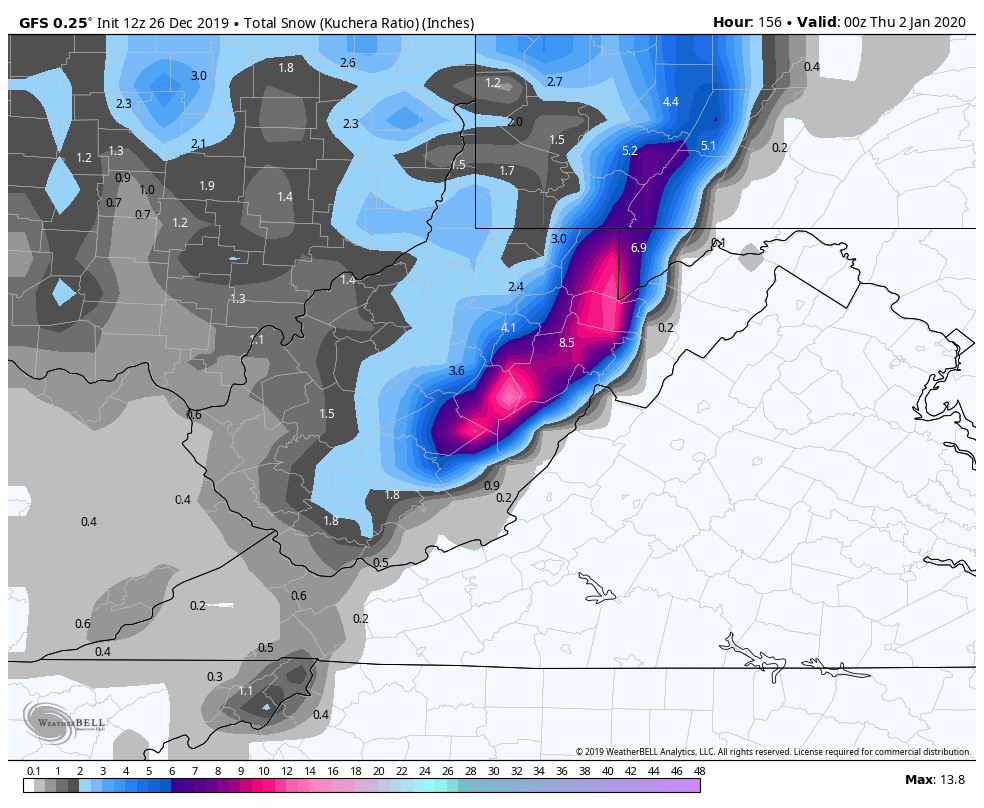
The GFS amounts
Kuchera ratio, event 1 and event 2 combined
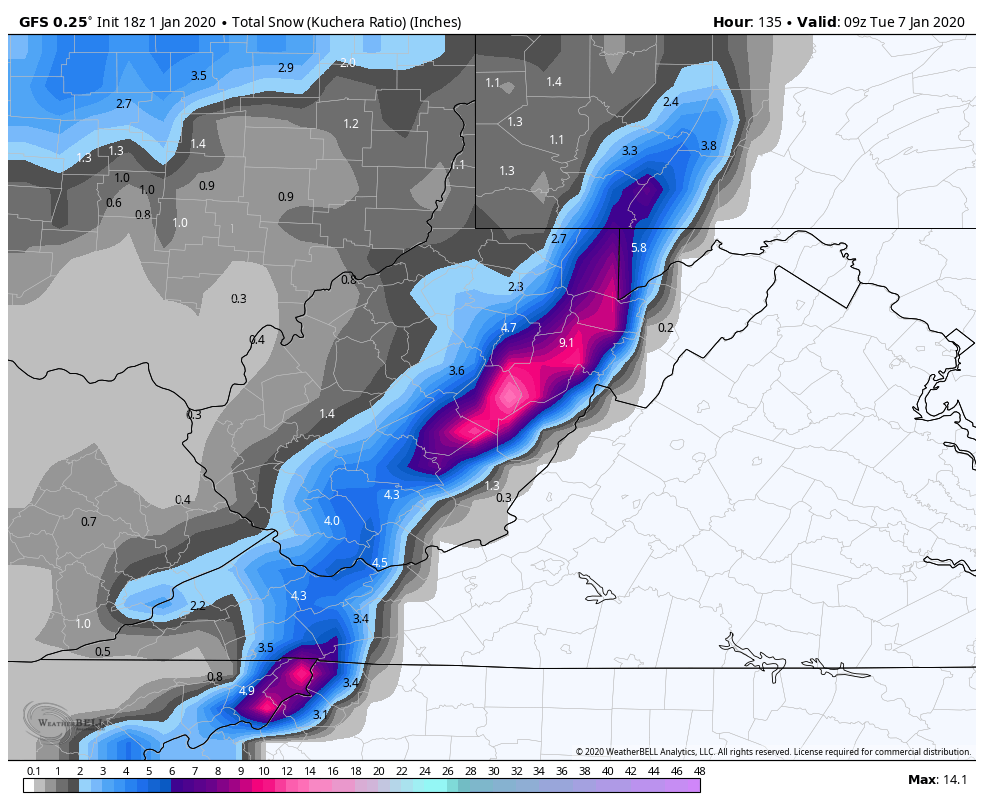

I STRESS, only showing these to
1- show potential, these are not yet expected amounts.
2- judge the performance afterwards
To say there are 2, 3-6/4-8″ possible events over the next week is not stretching the truth. But a long ways to go in this coming together. It is nice to see the ECMWF(Euro) seeing it. The Canadian does as well.
After this window closes, the trough looks to pull west, ridging east and it appears rather strongly that is the dominant feature.
This is seen very well on the 500mb height anomalies
Temperature anomalies off the :
12z ECMWF ensembles
12z GFS ensembles
We are getting into what is climatologically the coldest period of the year, so when you see anomalies at or even just above average, wintry precip can be had. This does go above that threshold for a spell.
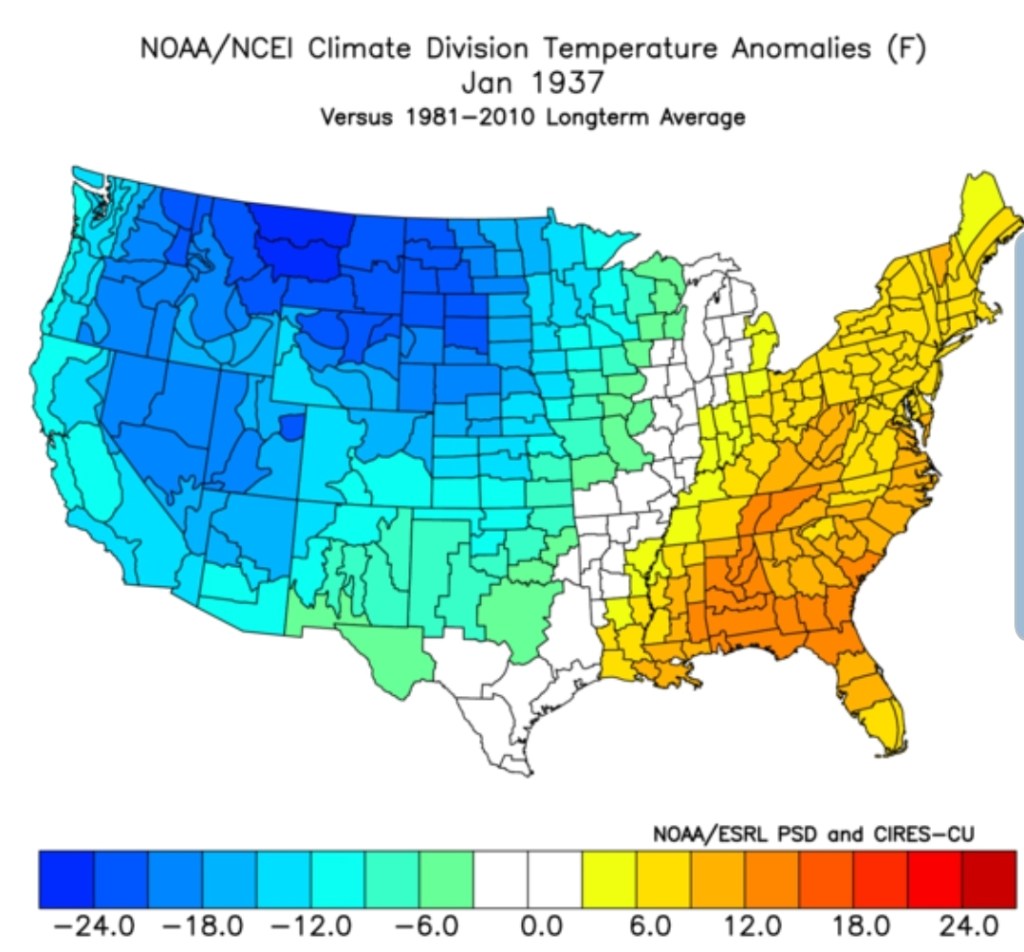
NOAAs 8-14 day outlook – theres that 37 look. Not that a trough west, ridge east is uncommon. The setup in the pattern with the present trough, ridge outlook is similar to that setup.

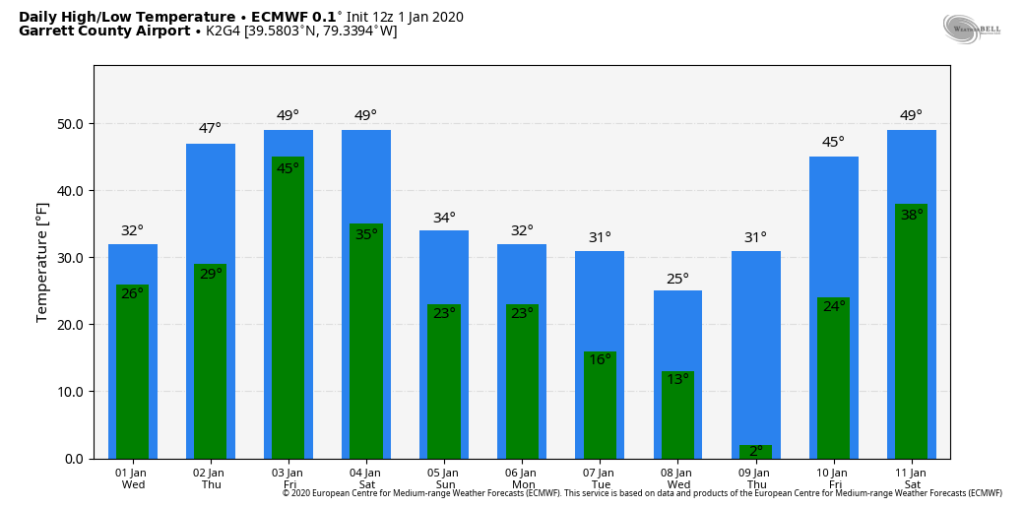
Temps for the Garrett Airport off the 12z ECMWF
The 18z GFS, again this is the poor upgraded GFS. Not to sound harsh, but it has been poor. It does show what may occur though when the ridge weakens and the cold that’s waiting over spreads the country west to east.
if I was putting money down, I’d bet on 7-10 days later than this occurence the cold spreads east.
Through the 15th the GEFS, and ECMWF have the MJO strongly into the warm phases. The ECMWF looks like it may hold or go back into the null phase vs circling around to 6, 7, 8, 1 as the GEFS looks like it wants to do.
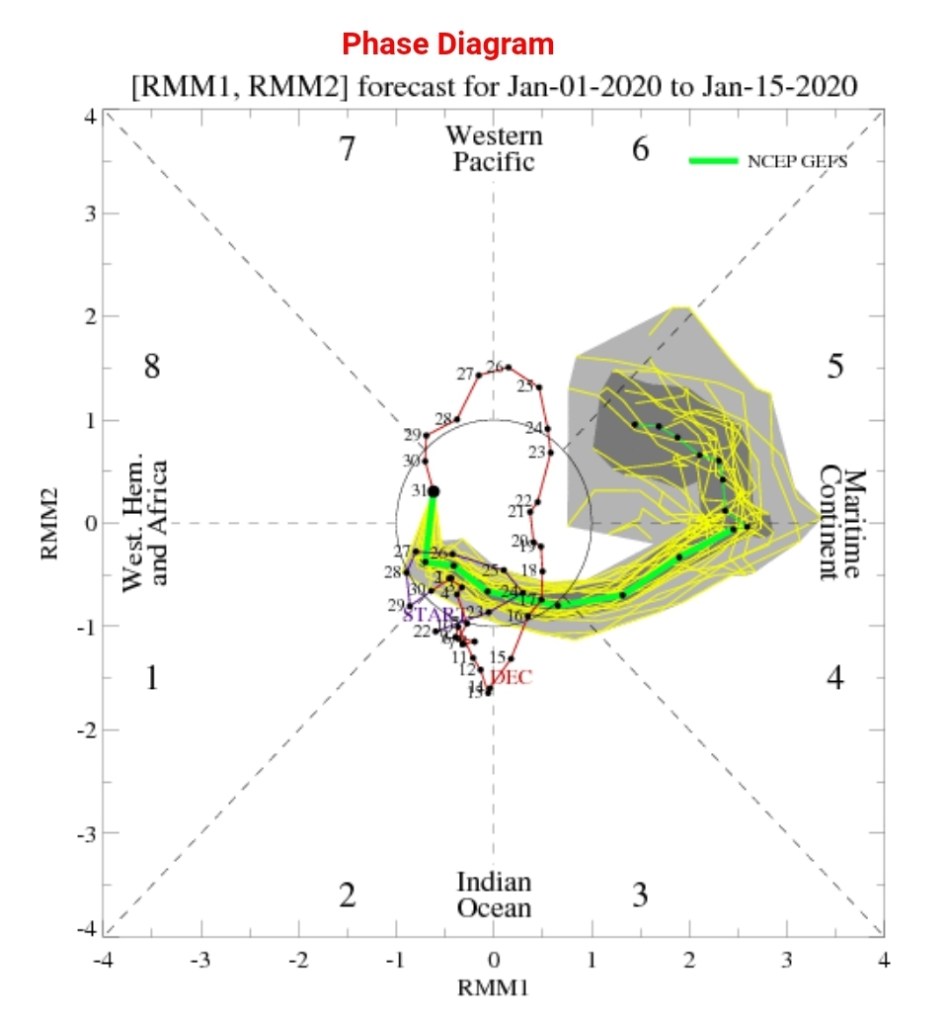
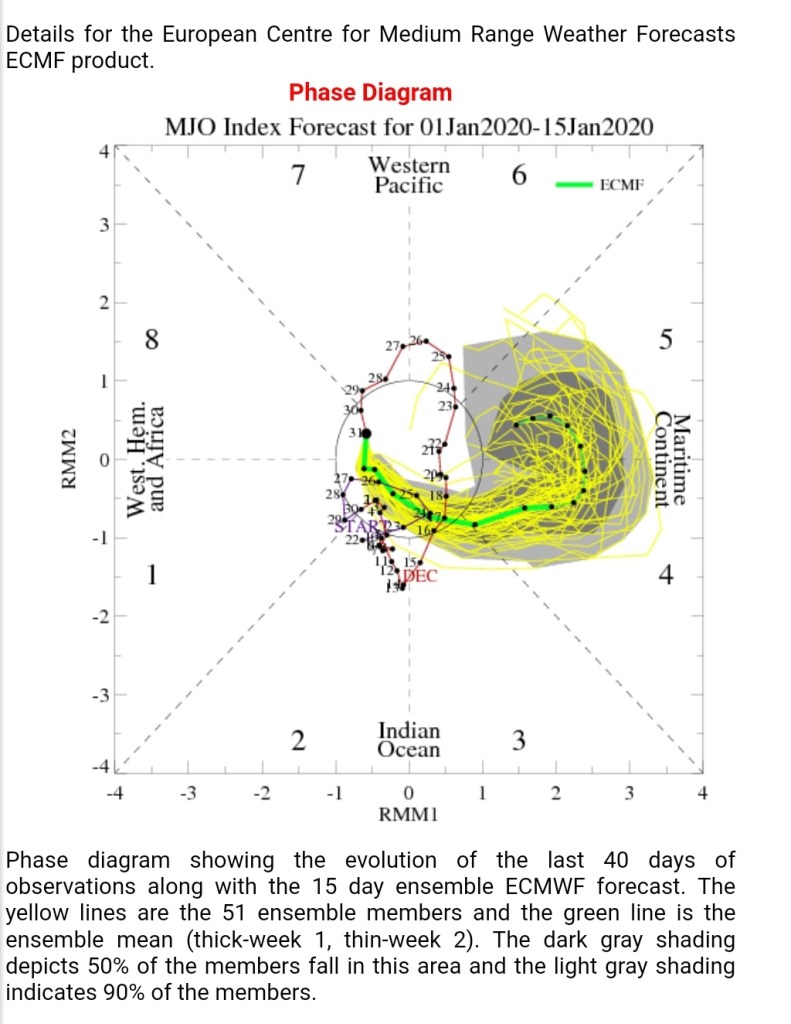
Phase correlation
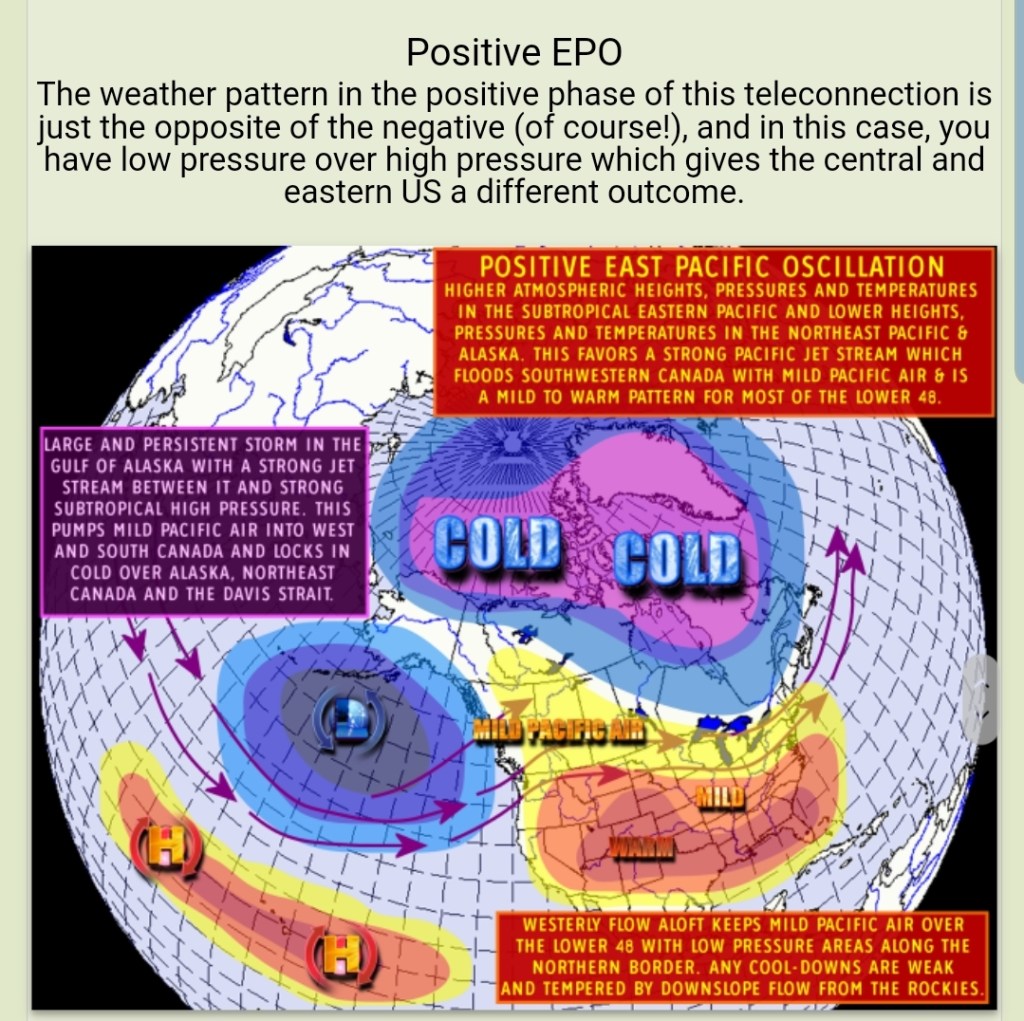
Teleconnections remain unfavorable
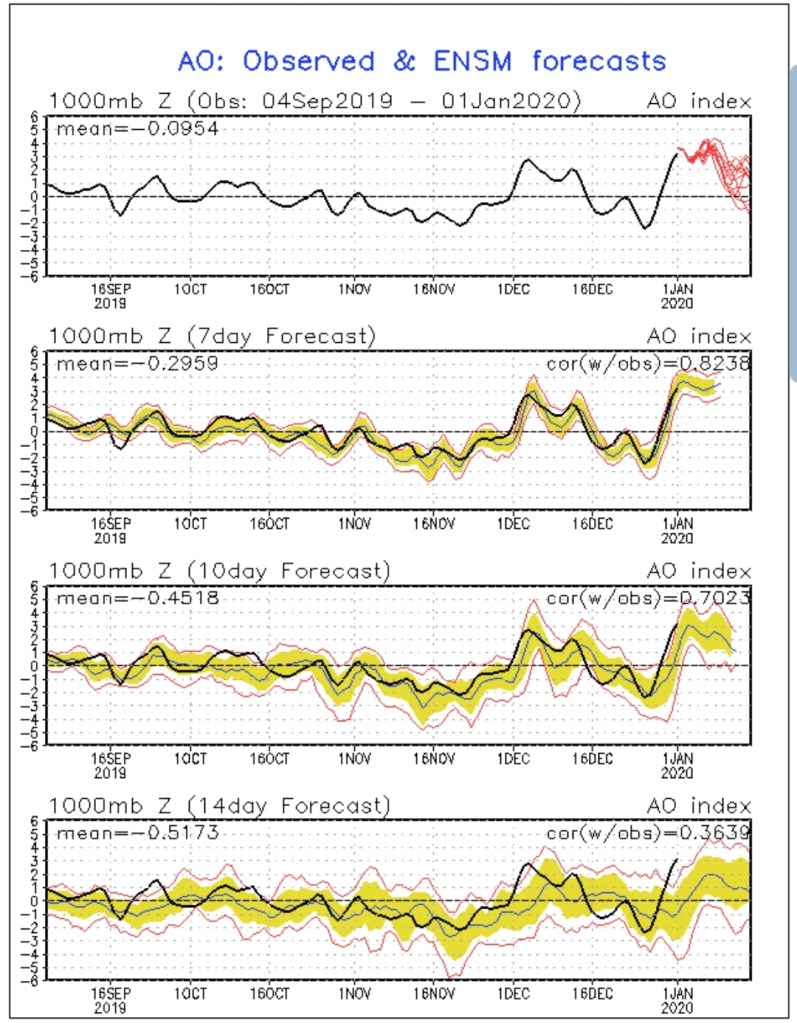
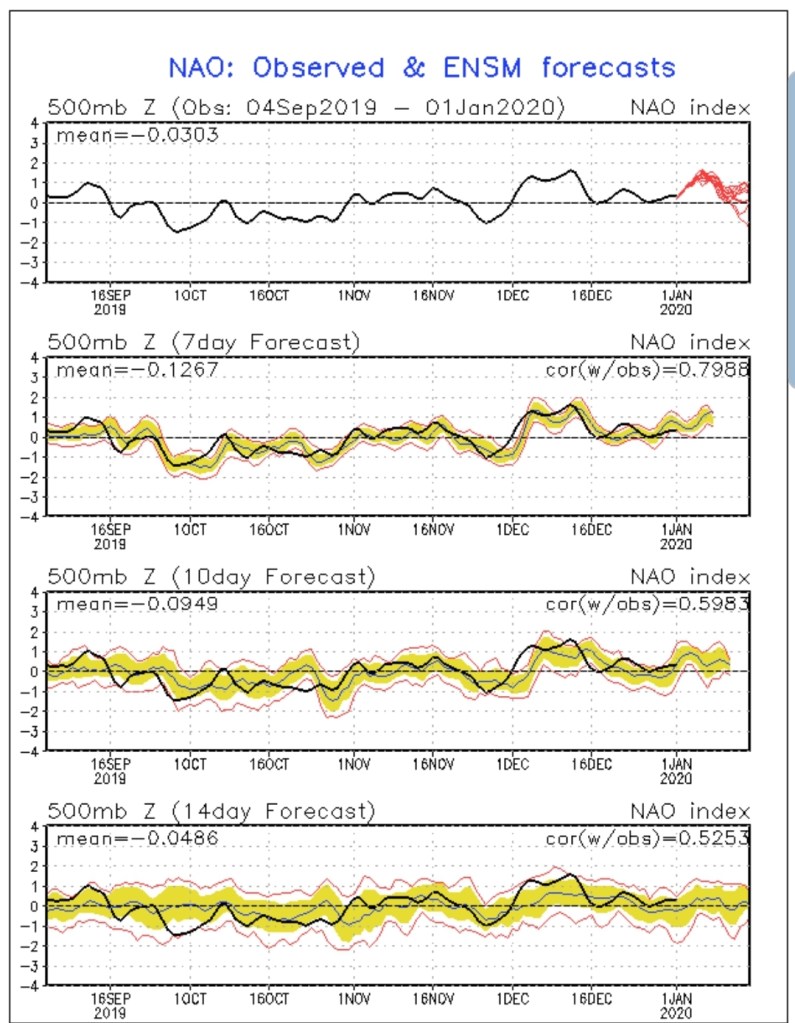
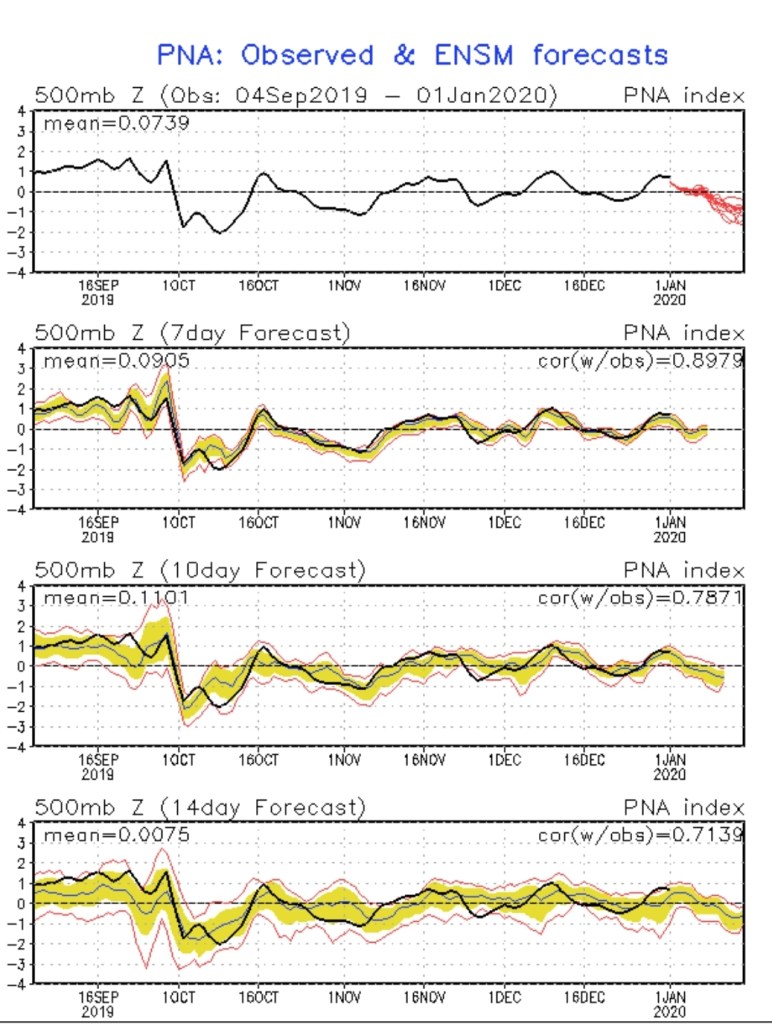
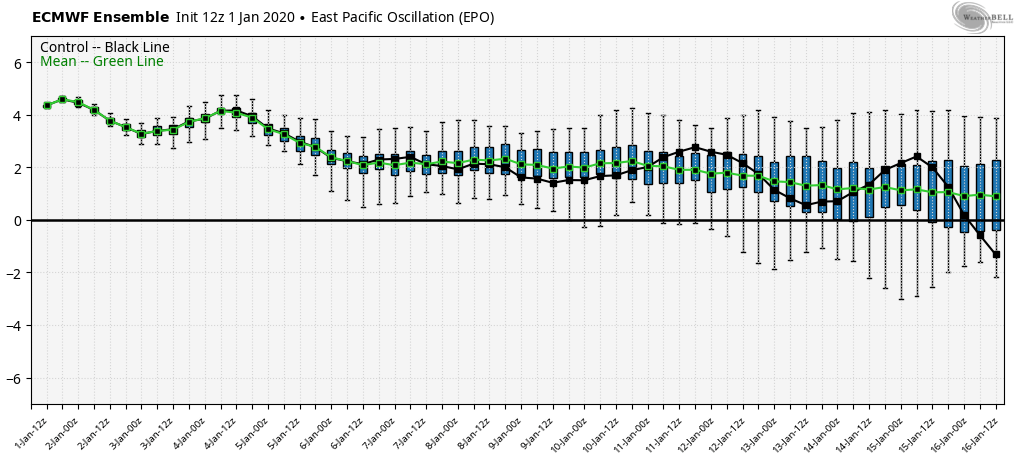
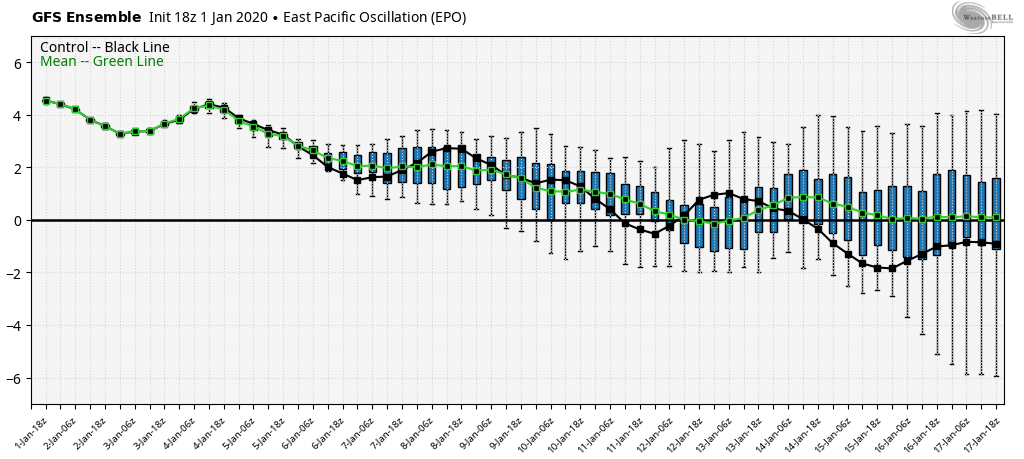
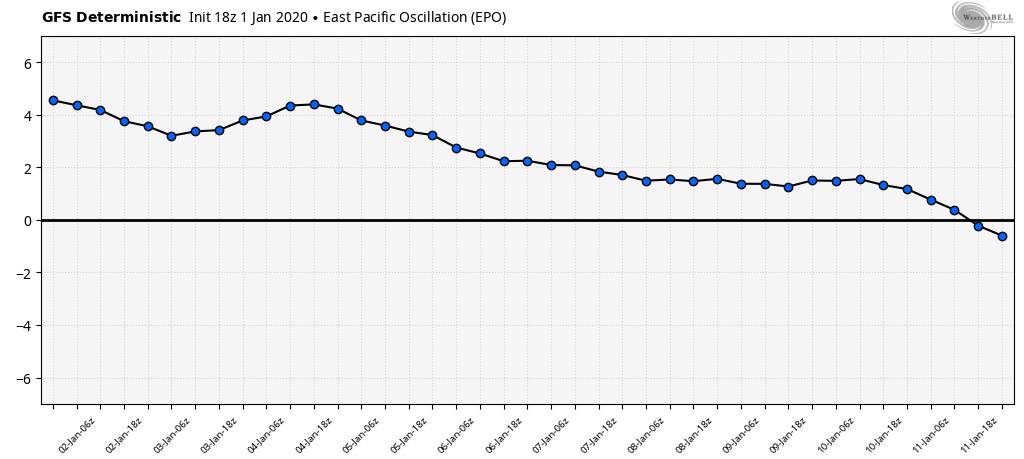
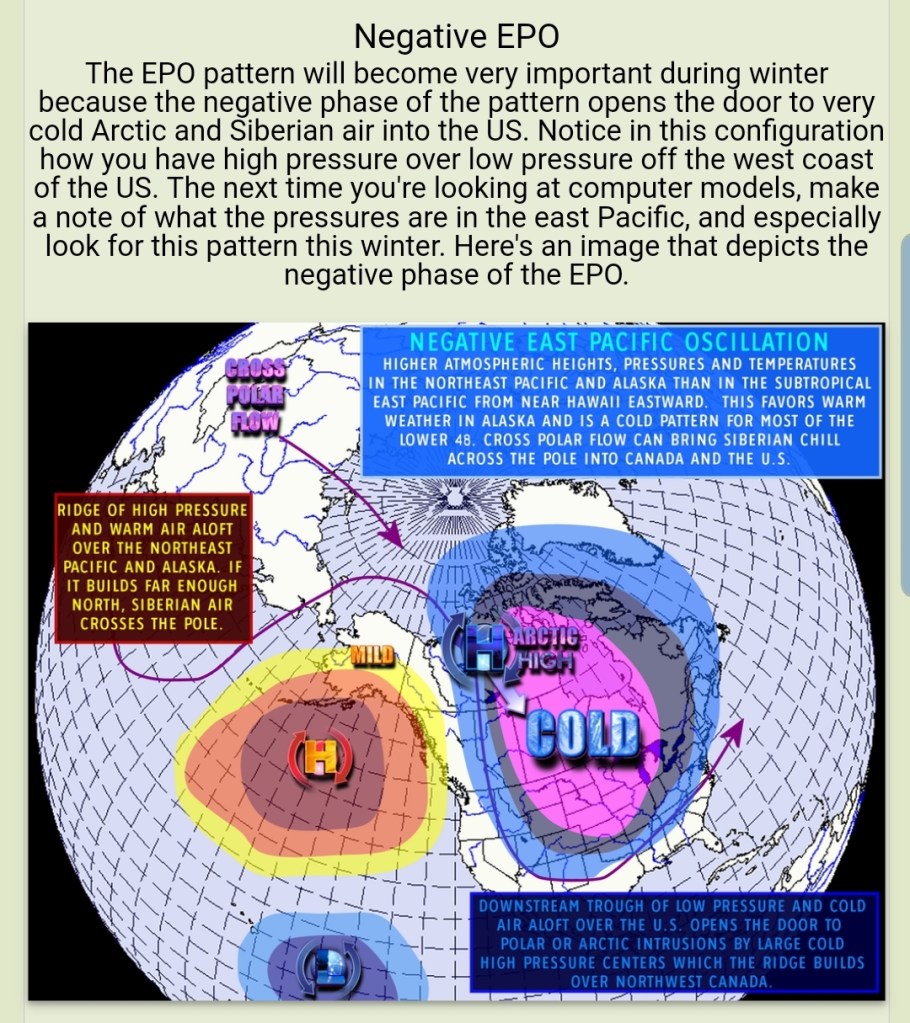
The EPO off the models. This far out on a teleconnection is a stretch, but if the EPO goes negative, the cold will have a much better chance of pushing. Despite the +NAO, +AO, -PNA. This combo occured frequently in the very cold back to back winter periods in 13/14, 14/15
EPO off the models …important part of getting the needed push …and getting the Ridge into Alaska and the trough east of Hawaii.