February 25, 2020
Feb 25(Tues)
Shortly around/after midnight, some flakes and ice pellets occured before turning to showers. Some showers through the day. Nothing substantial.
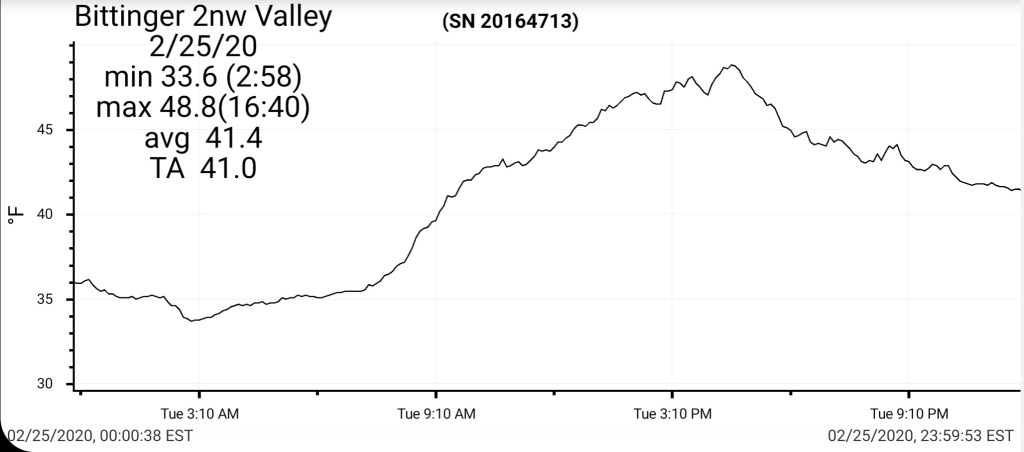
Bittinger 2nw Valley
MIN[33.6]—MAX[48.8]—AVERAGE MEAN[41.4]—TRUE AVERAGE[41.0]
Snowfall season to date 48.0″

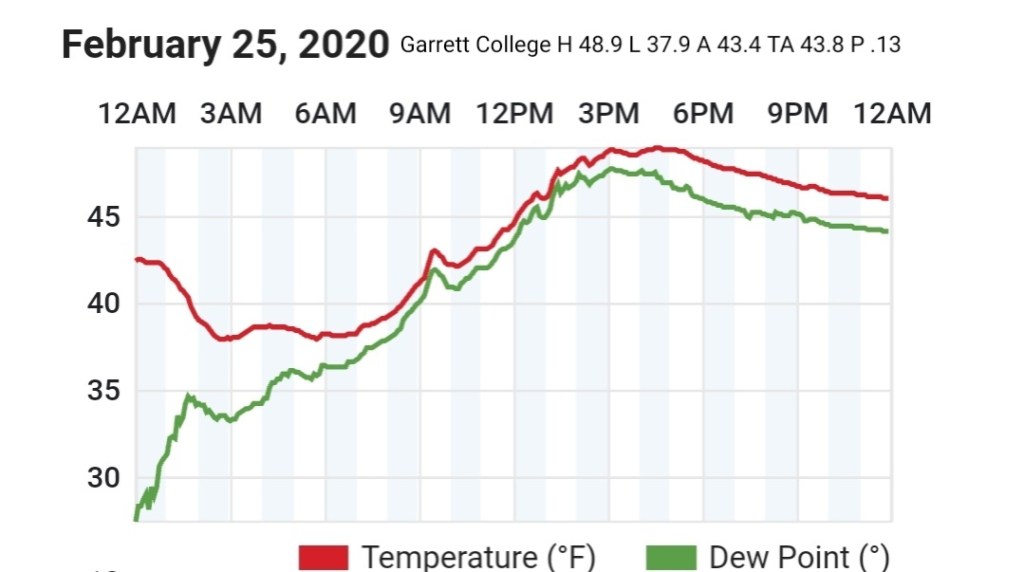
Garrett College
MIN[37.9]—MAX[48.9]—AVERAGE MEAN[43.4]—TRUE AVERAGE[43.8]—PRECIP[.13]
Canaan Heights/Davis 3SE
MIN[36.0]—MAX[49.0]—AVERAGE MEAN[42.5]—PRECIP[.23]7am
Snnowfall season to date 65.8″
Comments by Dave Lesher at:
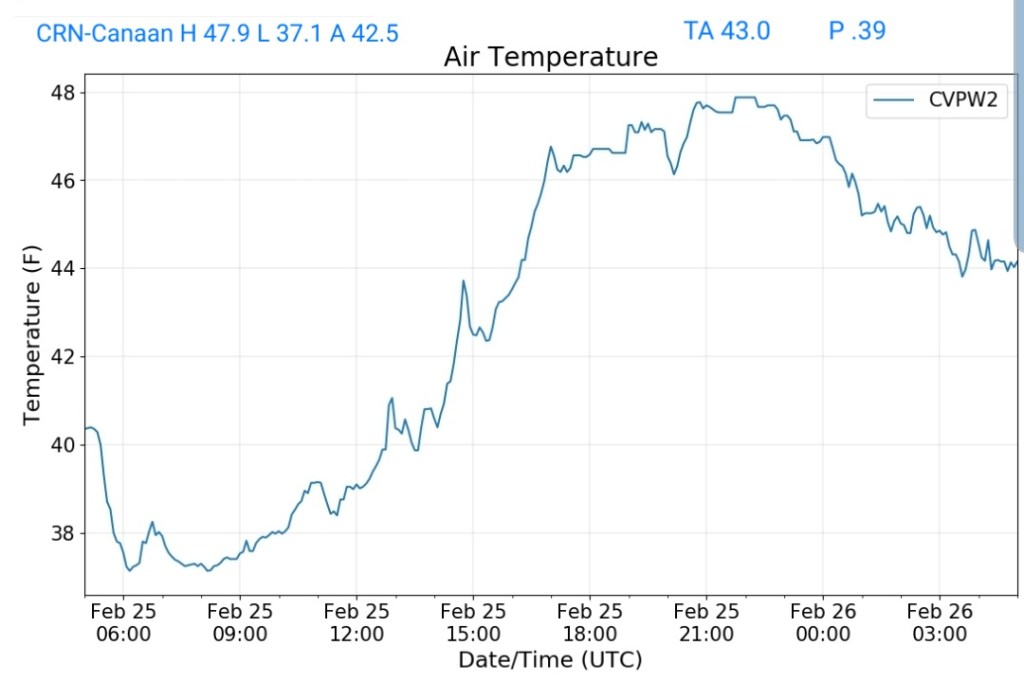
Climate Reference Network Canaan
MIN[37.1]—MAX[47.9]—AVERAGE MEAN[42.5]—TRUE AVERAGE[43.0]—PRECIP[.39]
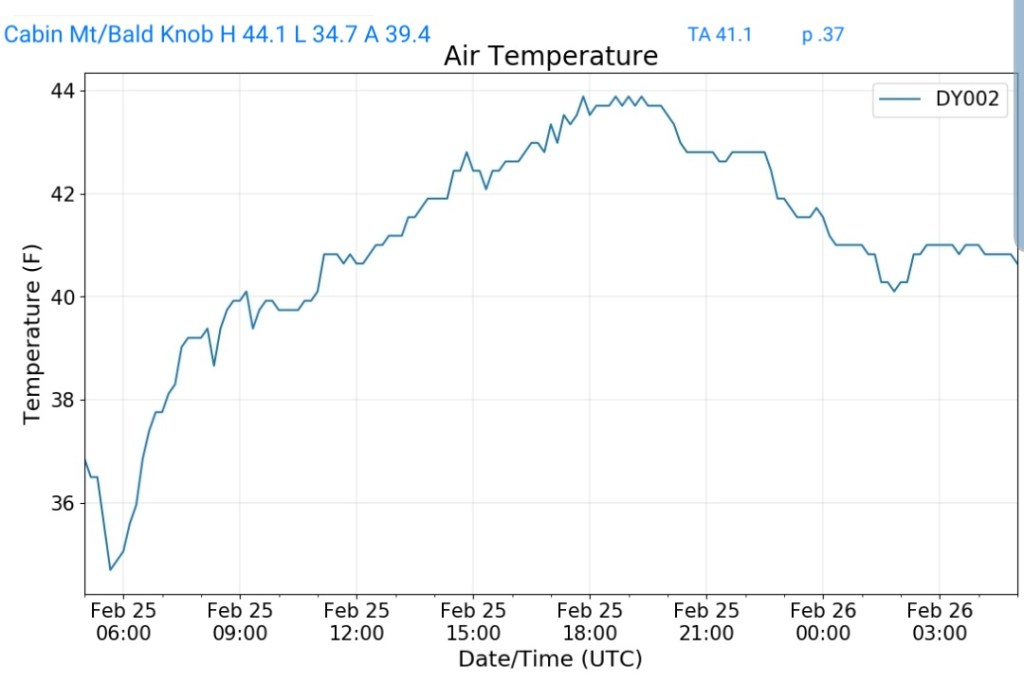
Cabin Mt at Bald Knob
MIN[34.7]—MAX[44.1]—AVERAGE MEAN[39.4]—TRUE AVERAGE[41.1]—PRECIP[.37]
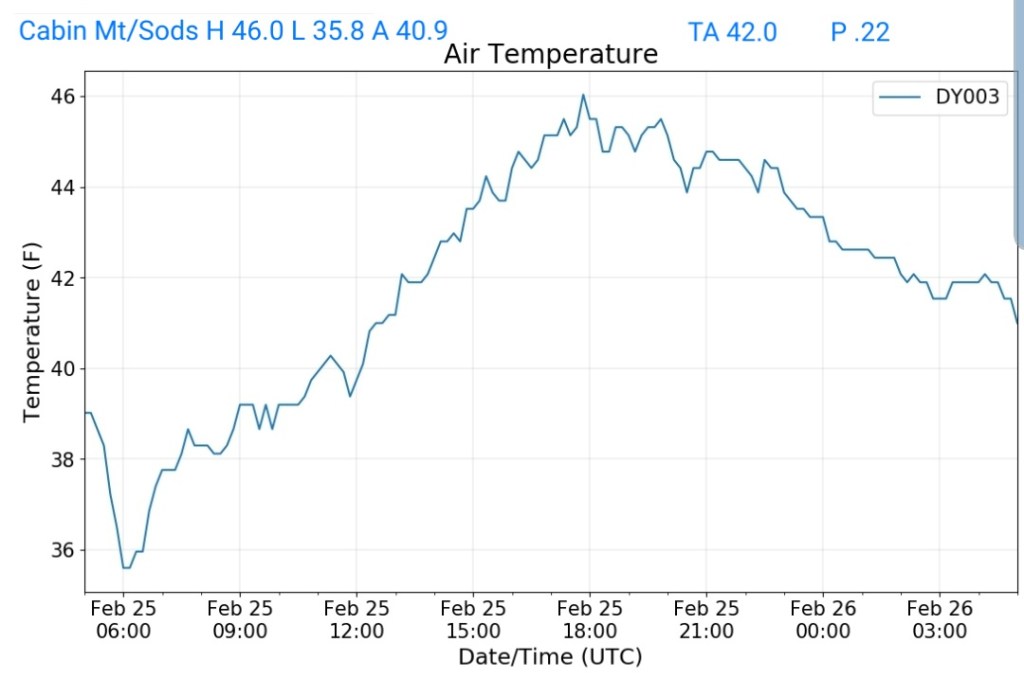
Cabin Mt-Western Sods
MIN[35.8]—MAX[46.0]—AVERAGE MEAN[40.9]—TRUE AVERAGE[42.0]—PRECIP[.22]
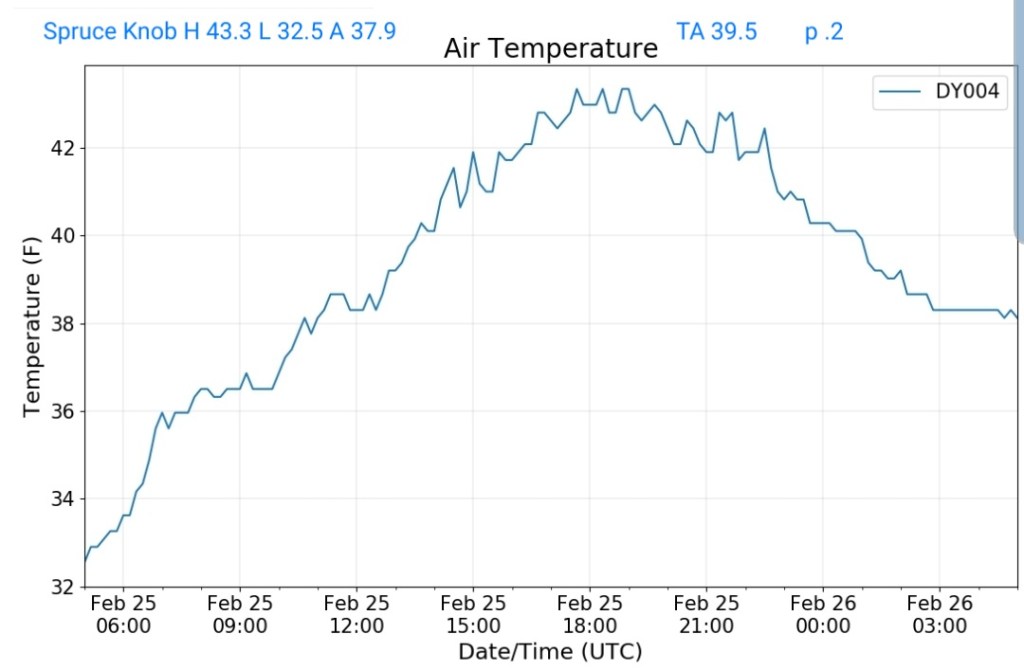
Spruce Knob
MIN[32.5]—MAX[43.3]—AVERAGE MEAN[37.9]—TRUE AVERAGE[39.5]—PRECIP[.2]
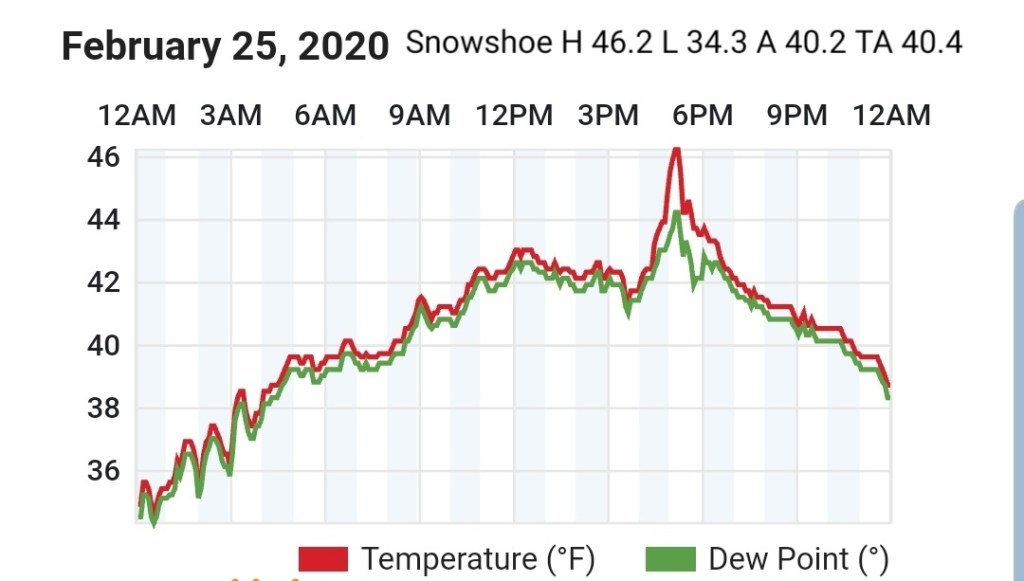
Snowshoe
MIN[34.3]—MAX[46.2]—AVERAGE MEAN[40.2]—TRUE AVERAGE[40.4]
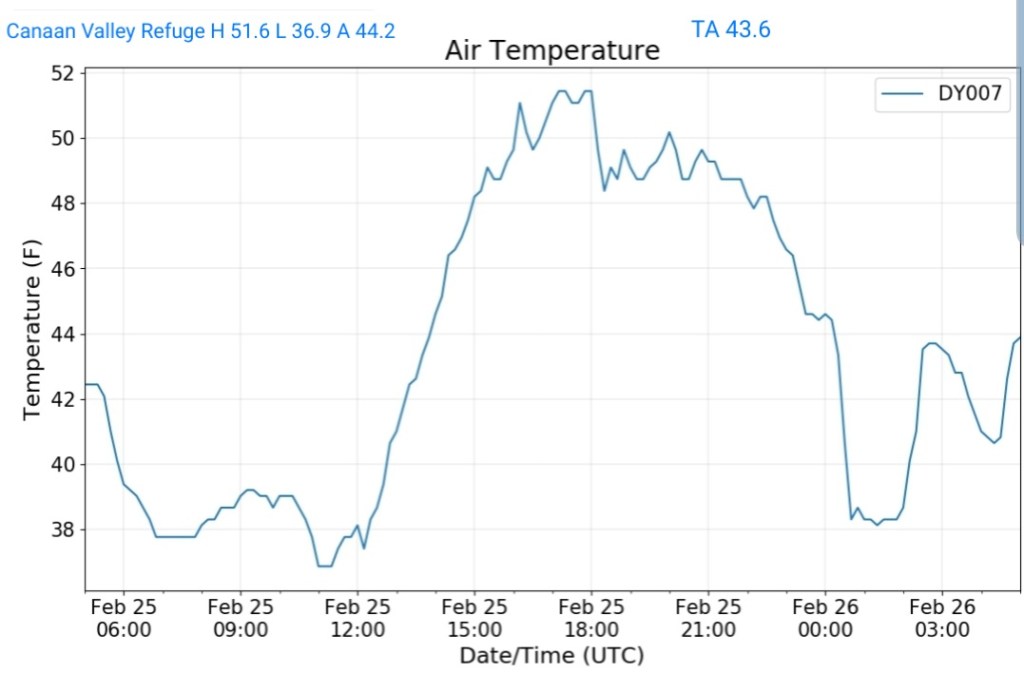
Canaan Valley Refuge
MIN[36.9]—MAX[51.6]—AVERAGE MEAN[44.2]—TRUE AVERAGE[43.6]
7Springs
MIN[35.6]—MAX[44.7]—AVERAGE MEAN[40.1]—TRUE AVERAGE[40.1]

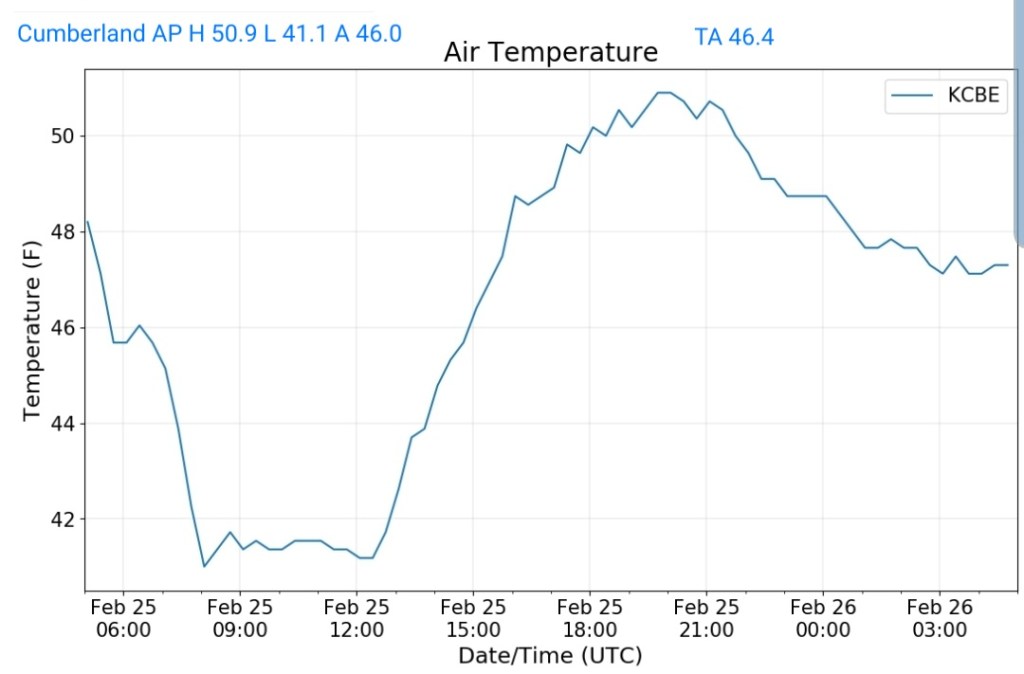
Cumberland Airport
MIN[41.1]—MAX[50.9]—AVERAGE MEAN[46.0]—TRUE AVERAGE[46.4]
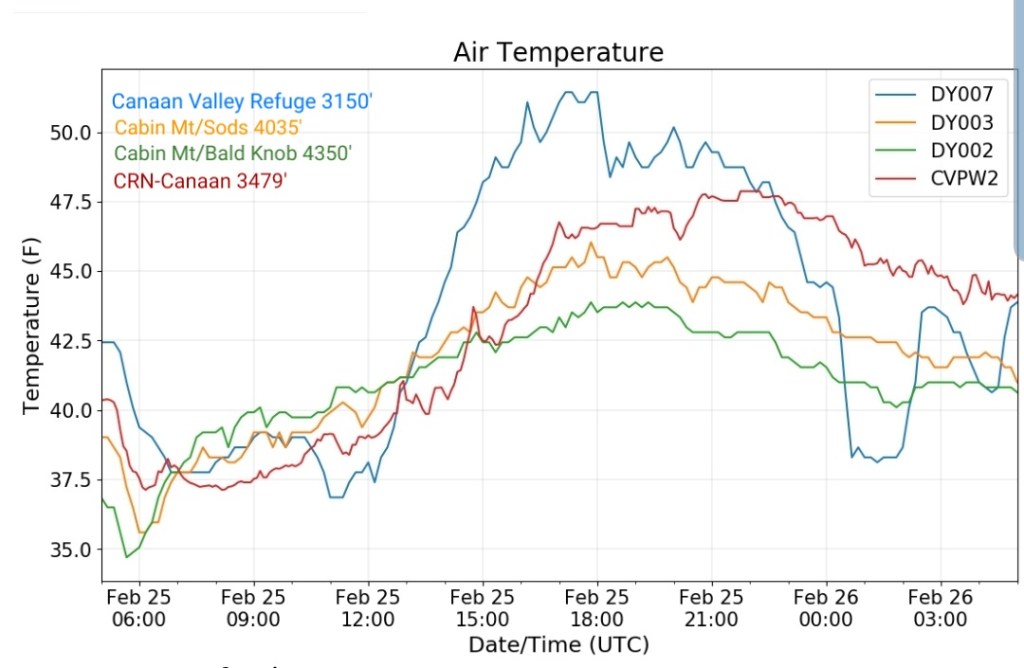
The Valley vs Cabin Mt
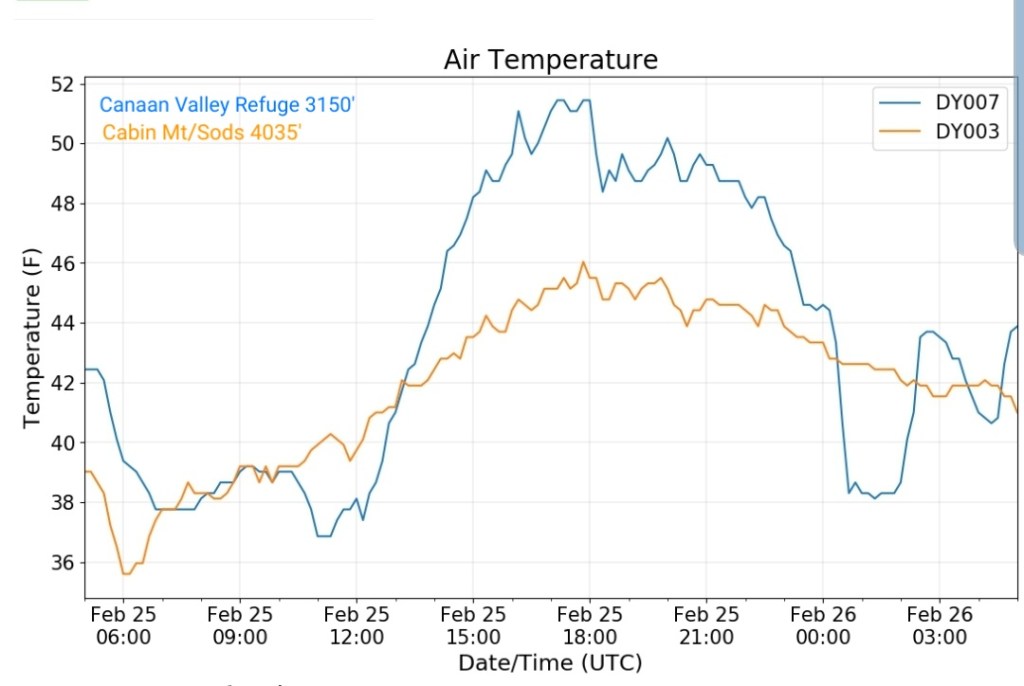
Canaan area temps
Comparison view