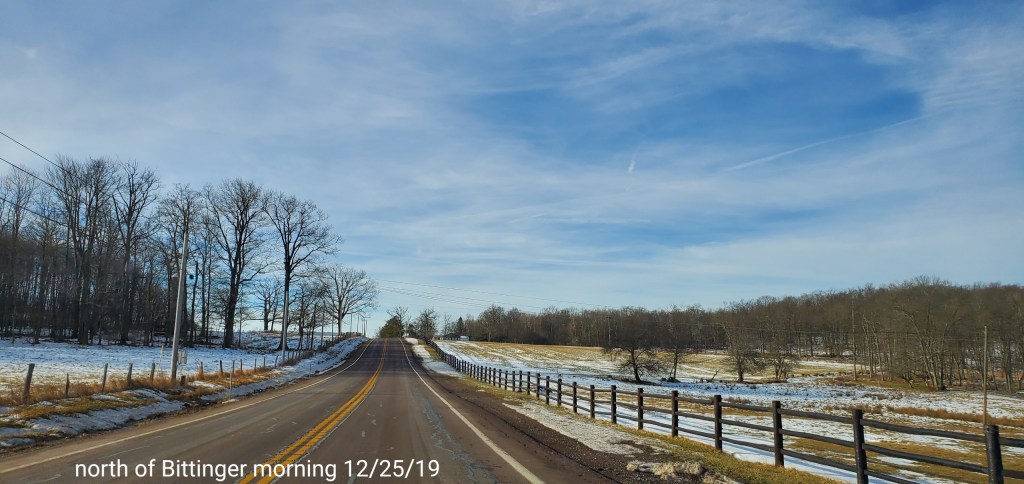
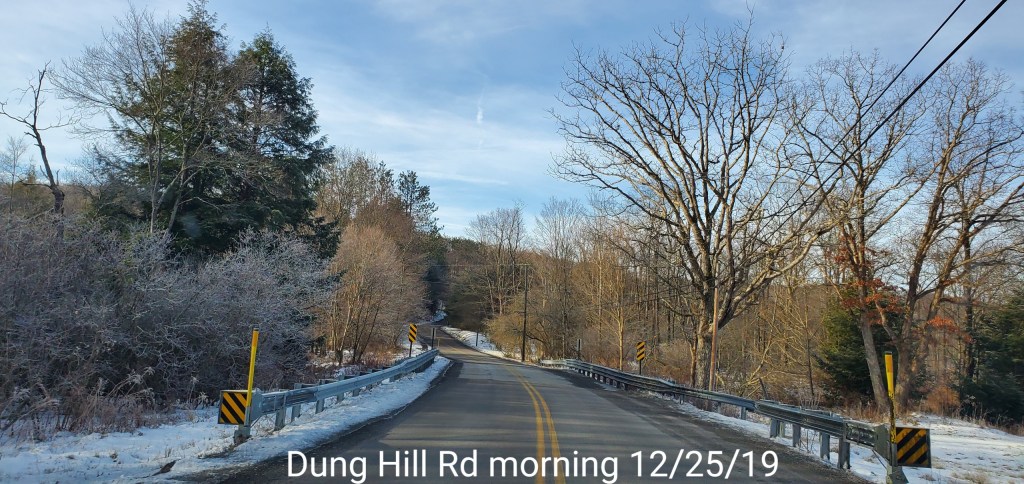
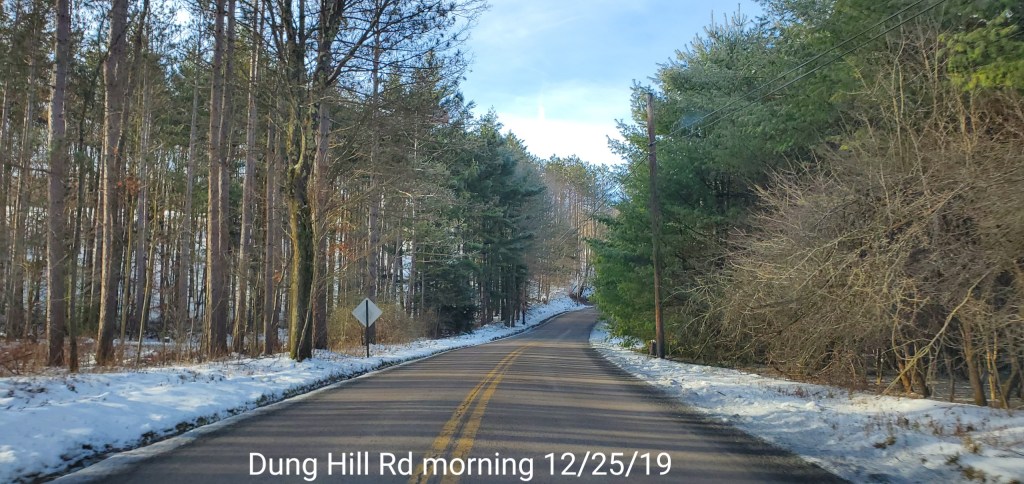
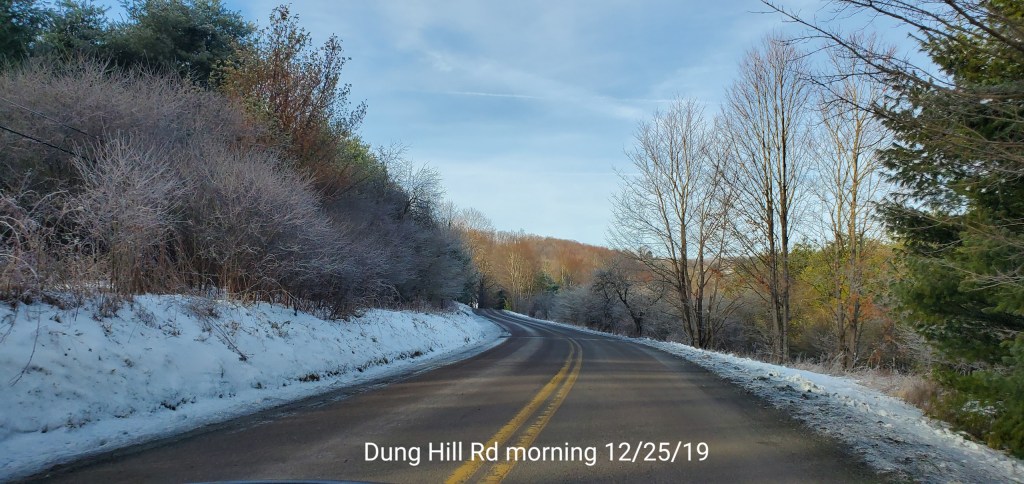
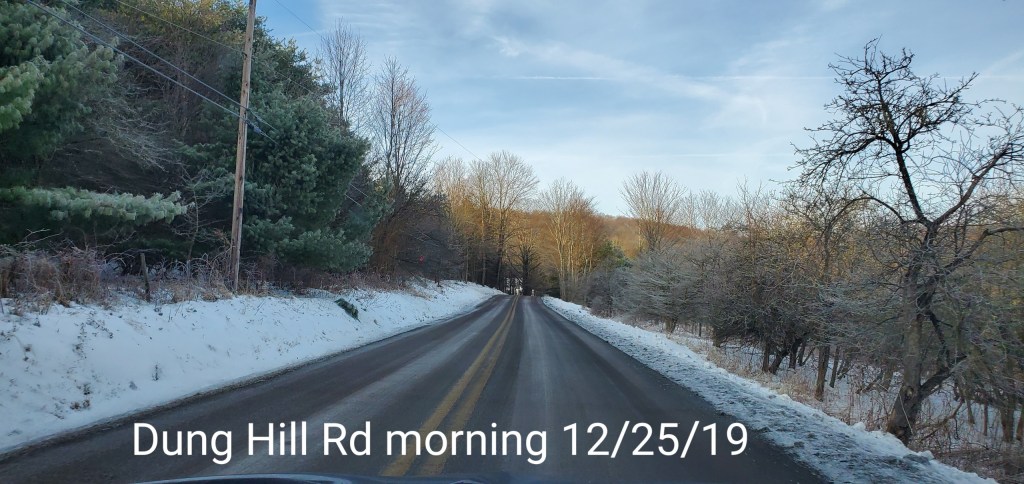
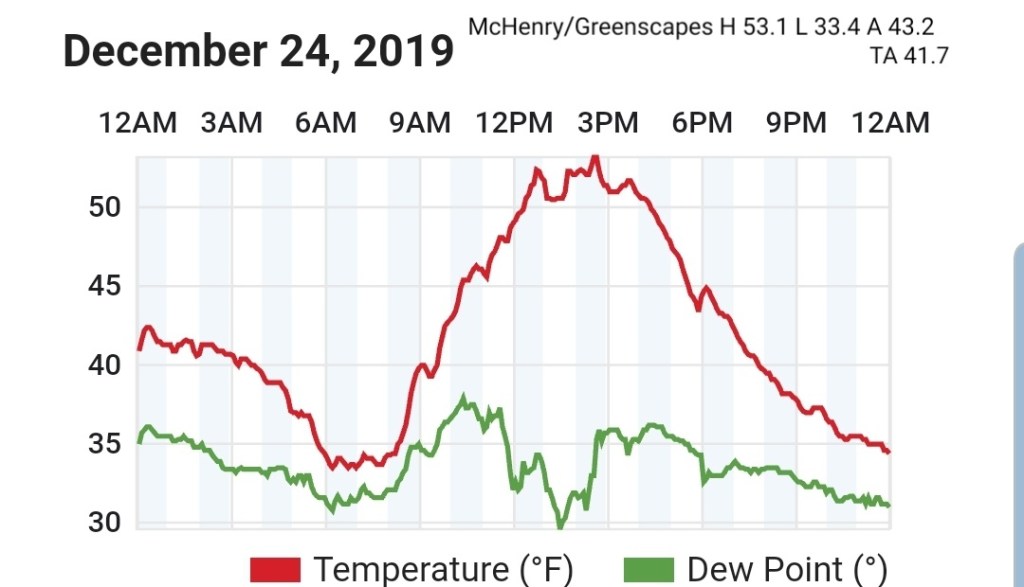
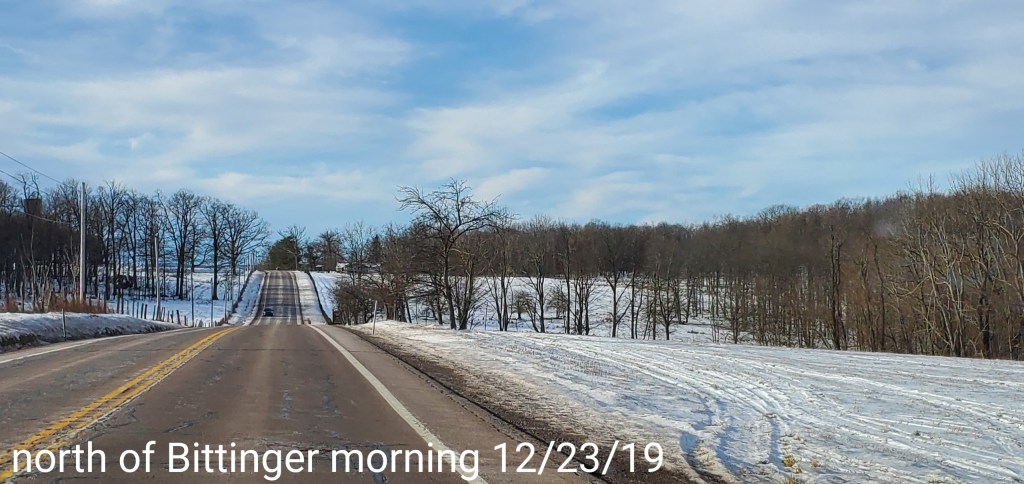
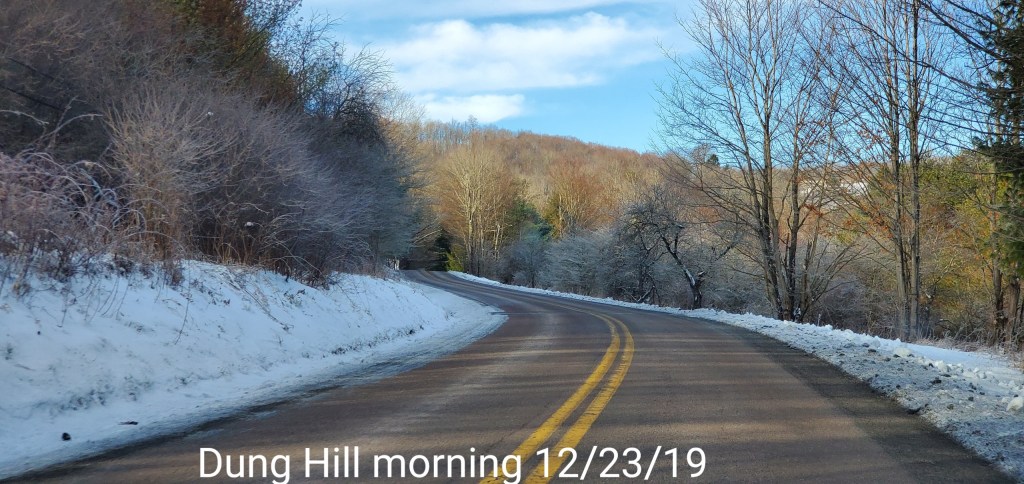
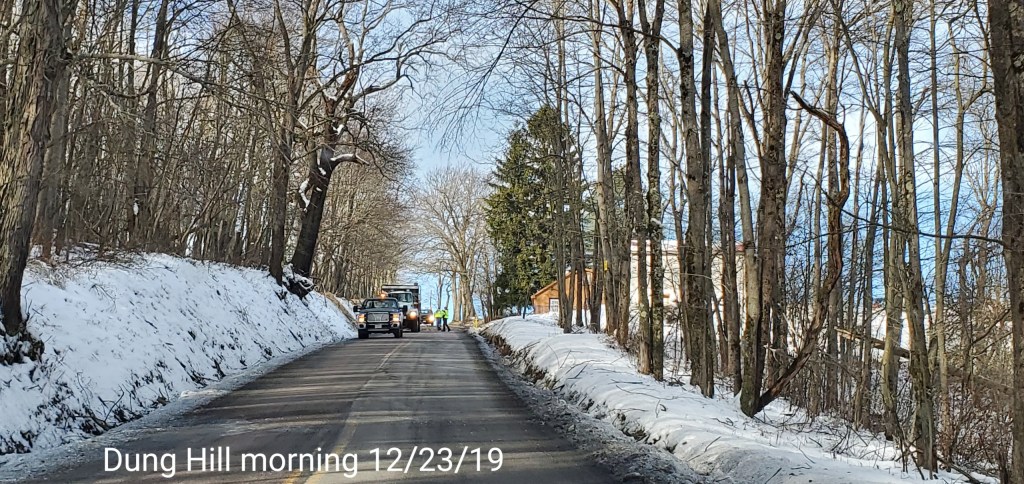
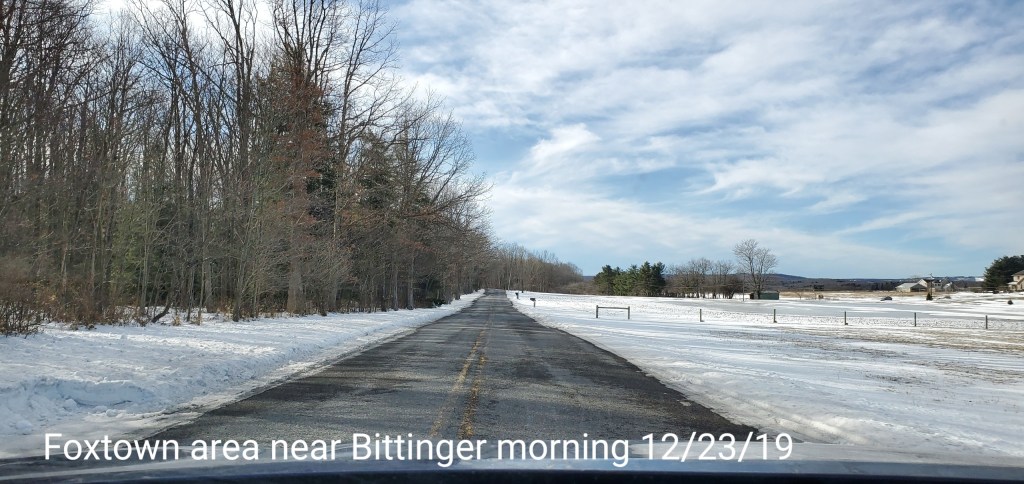
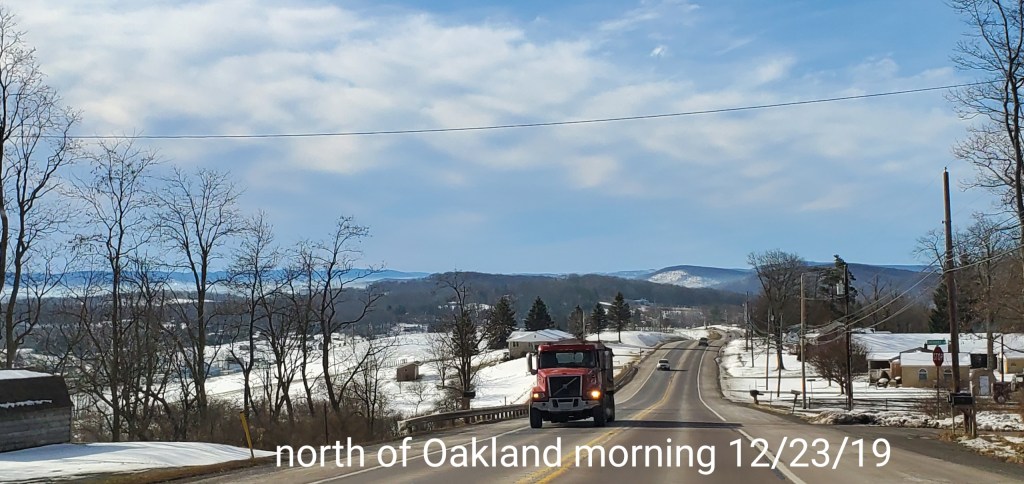
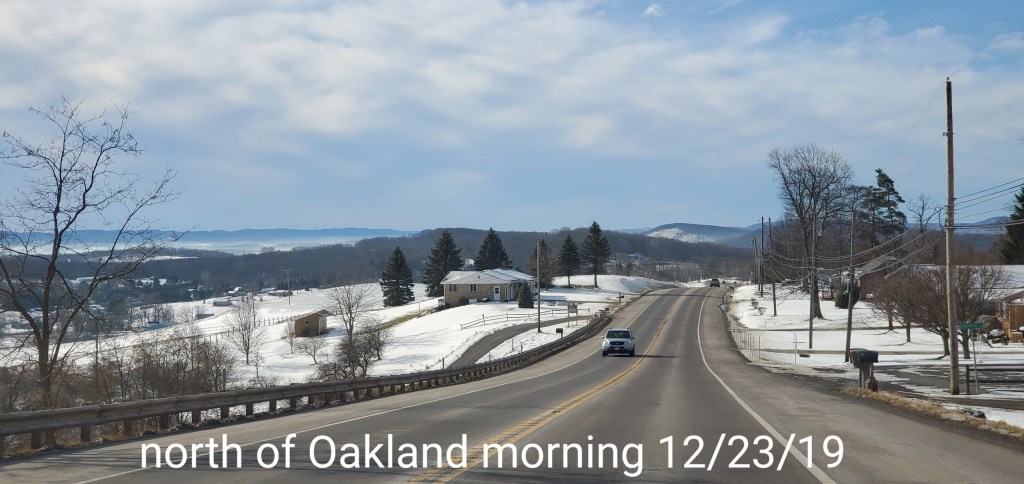
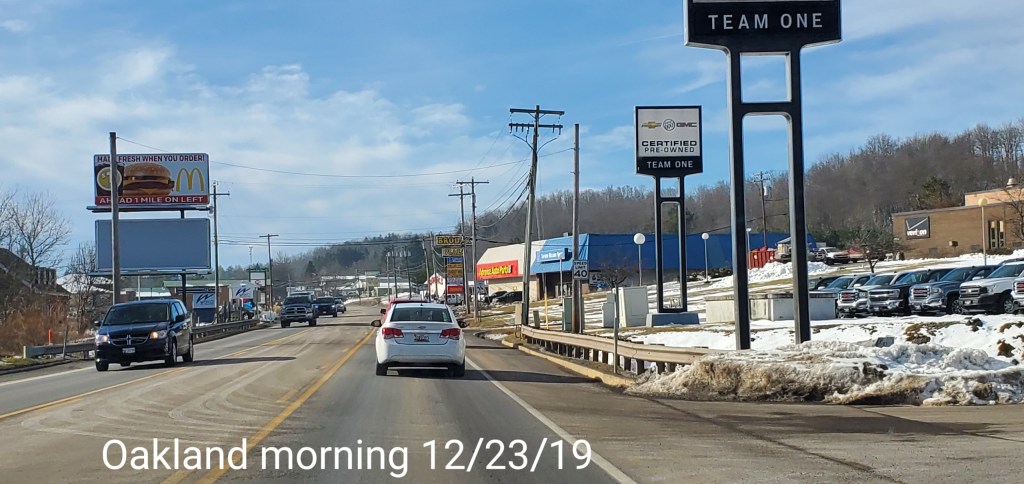
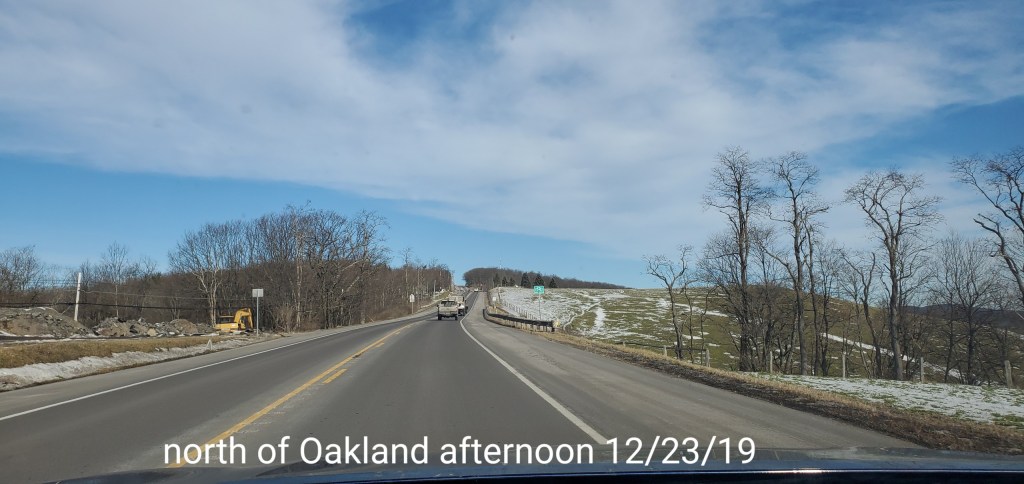
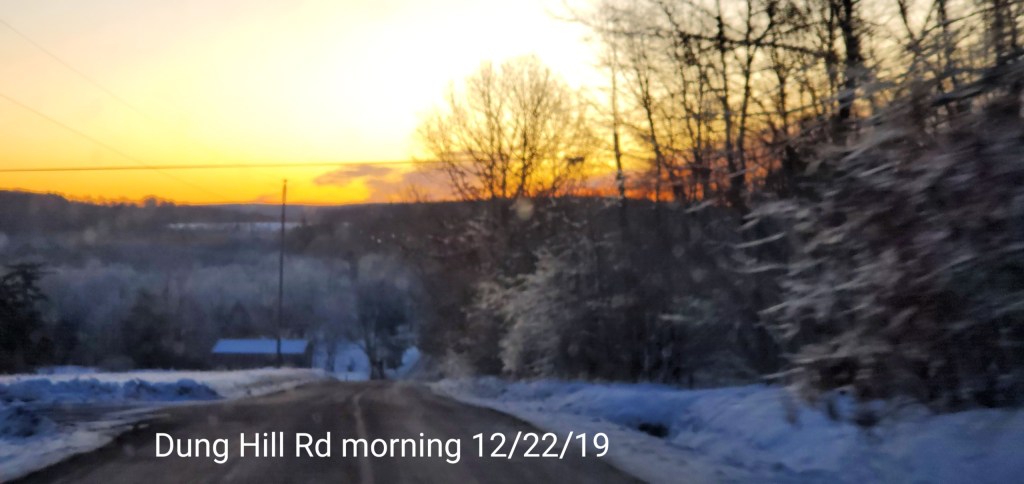
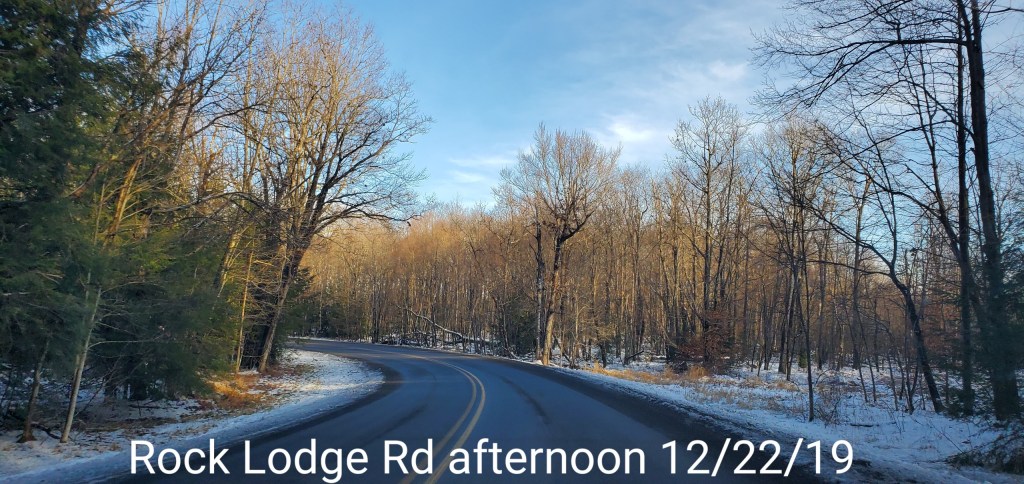
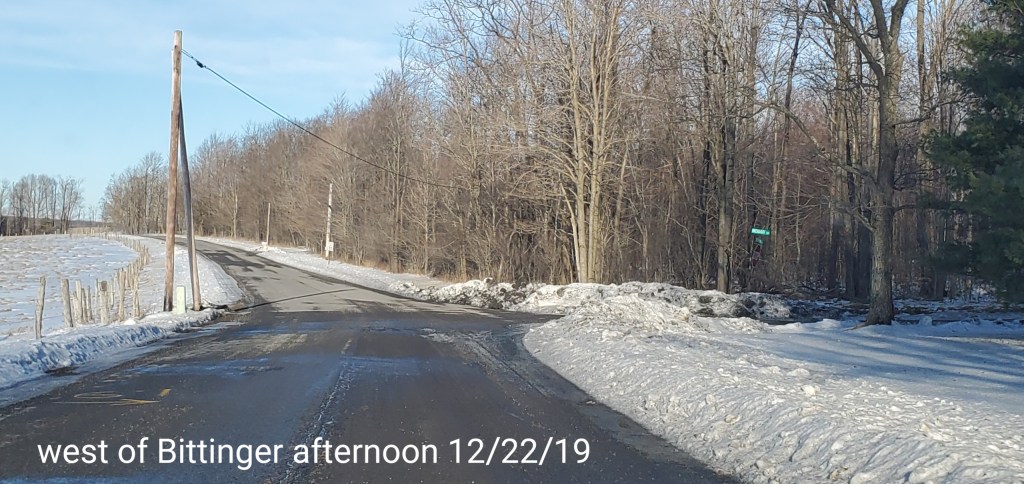
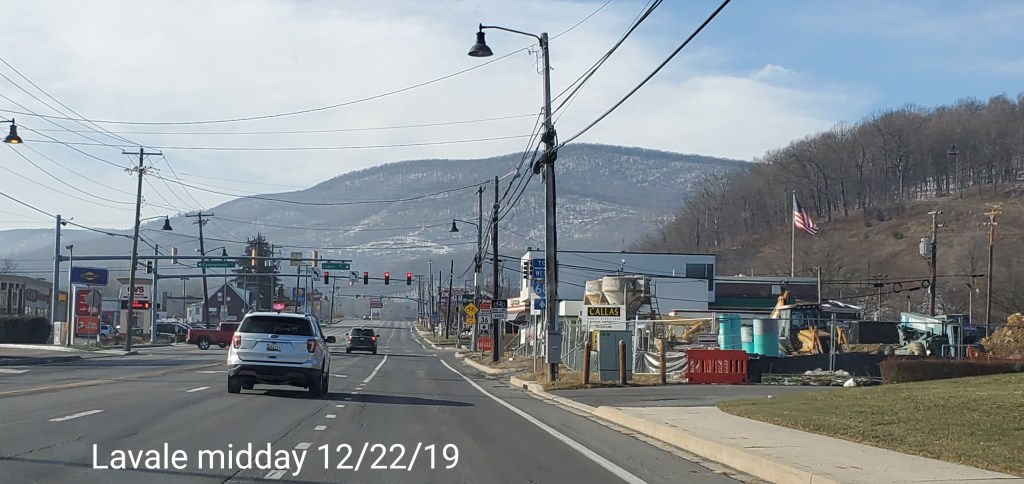
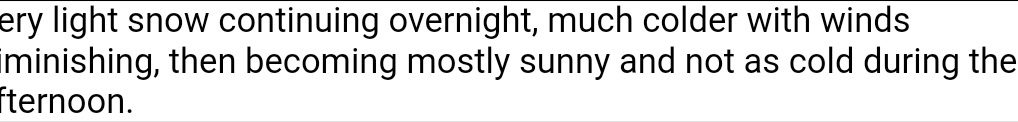
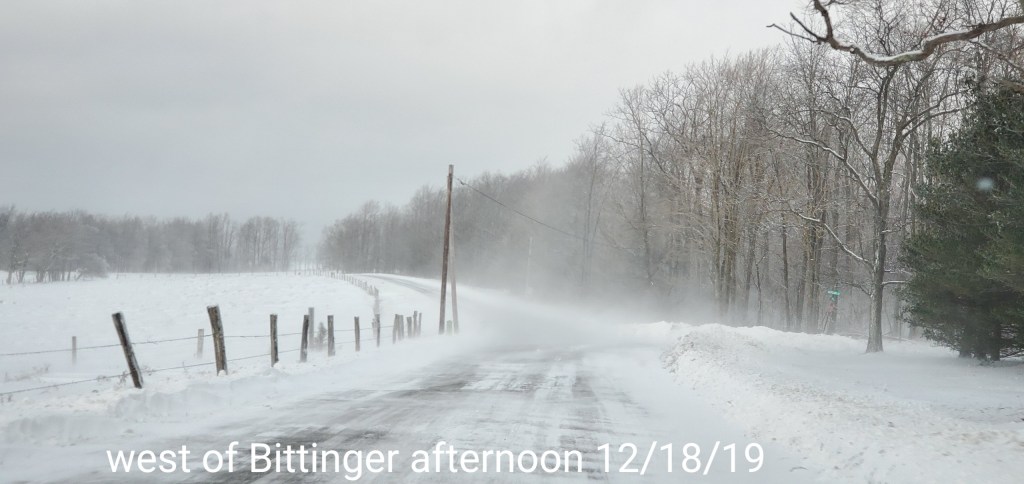
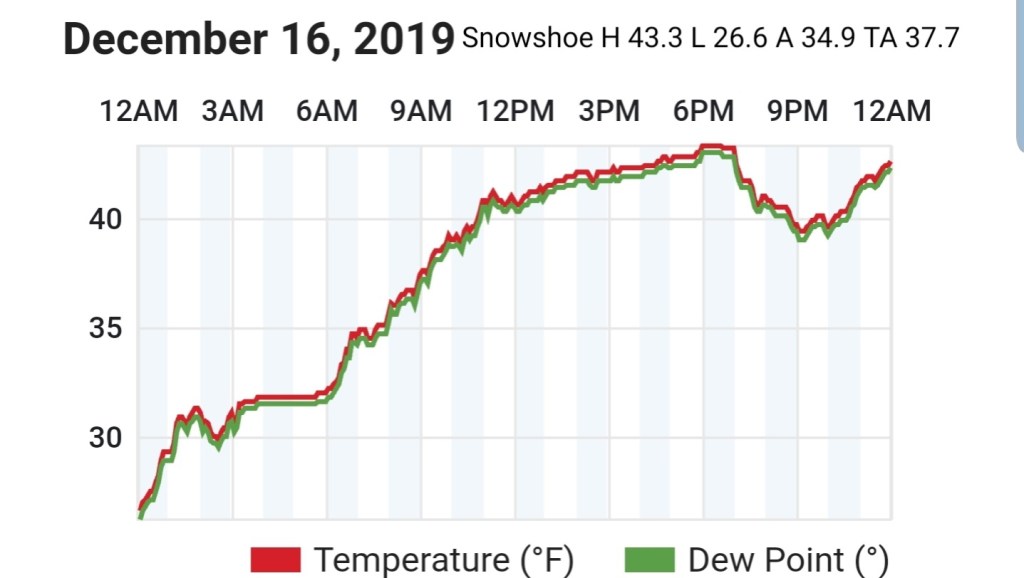
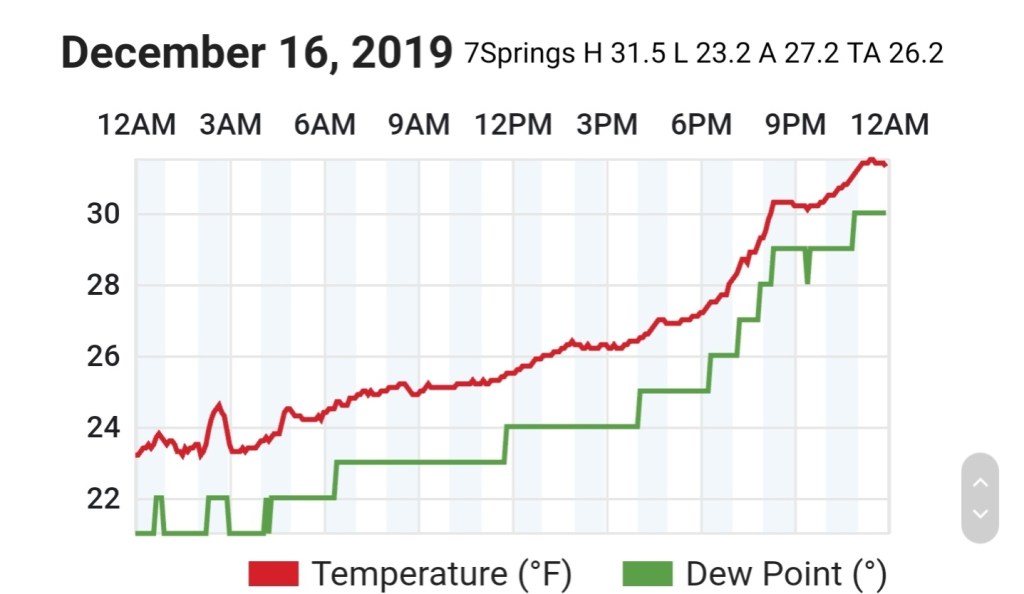
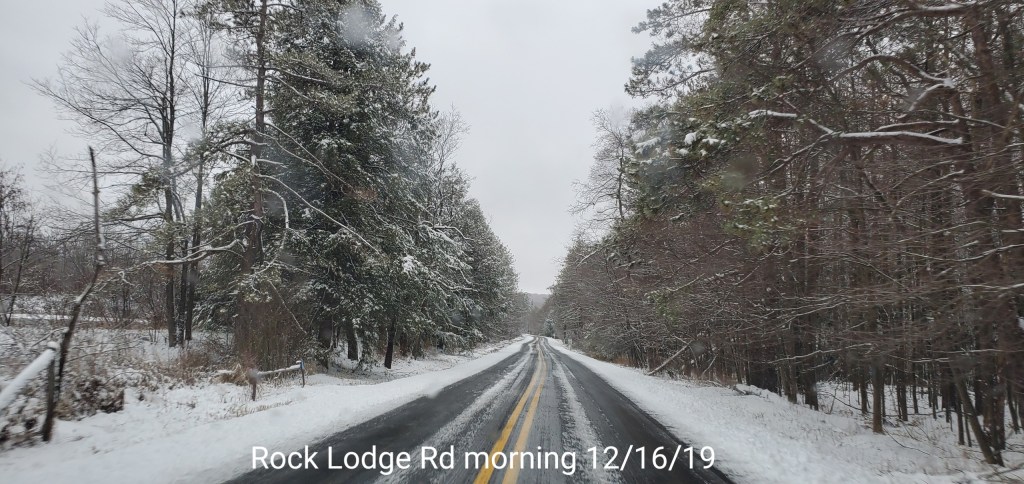
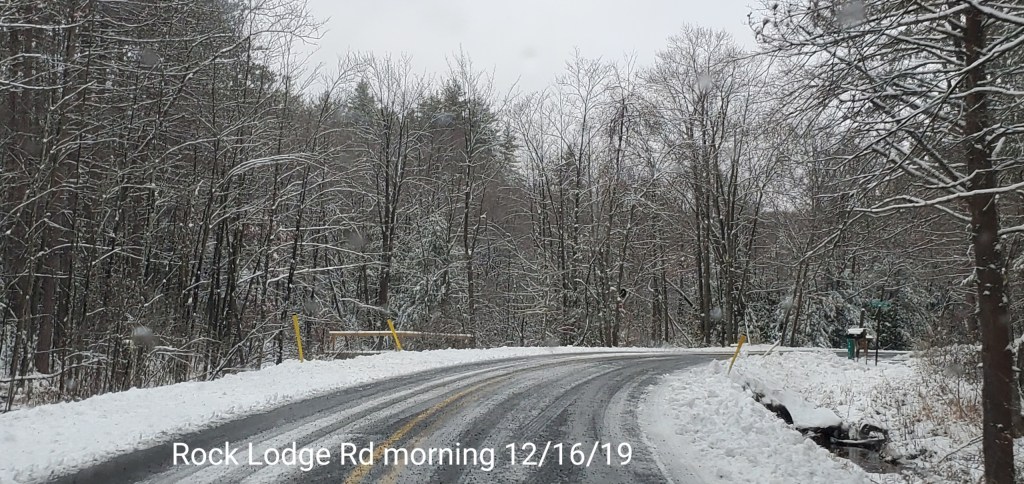
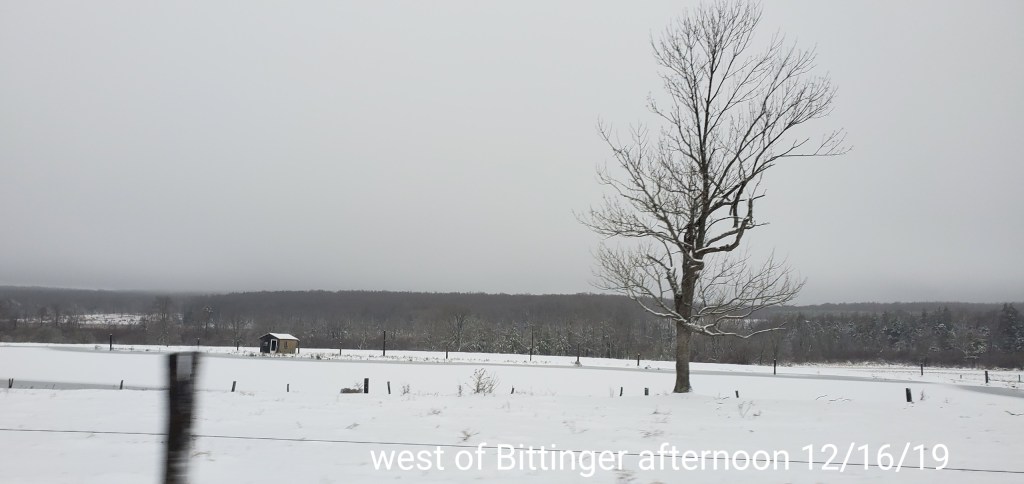
Another repeat, colder valleys, milder high ground, calm conditions. A nice Christmas travel day.
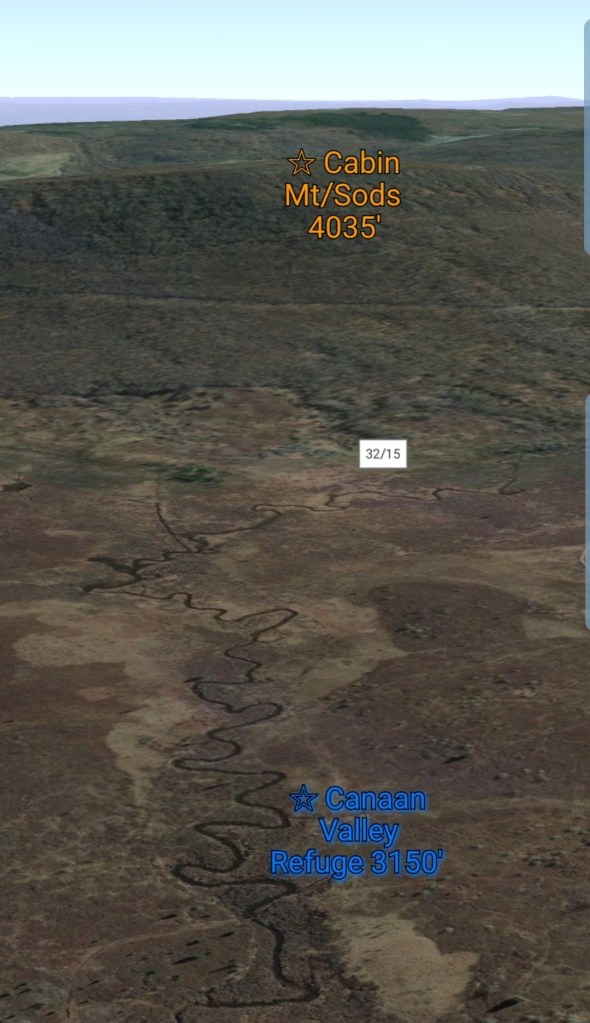
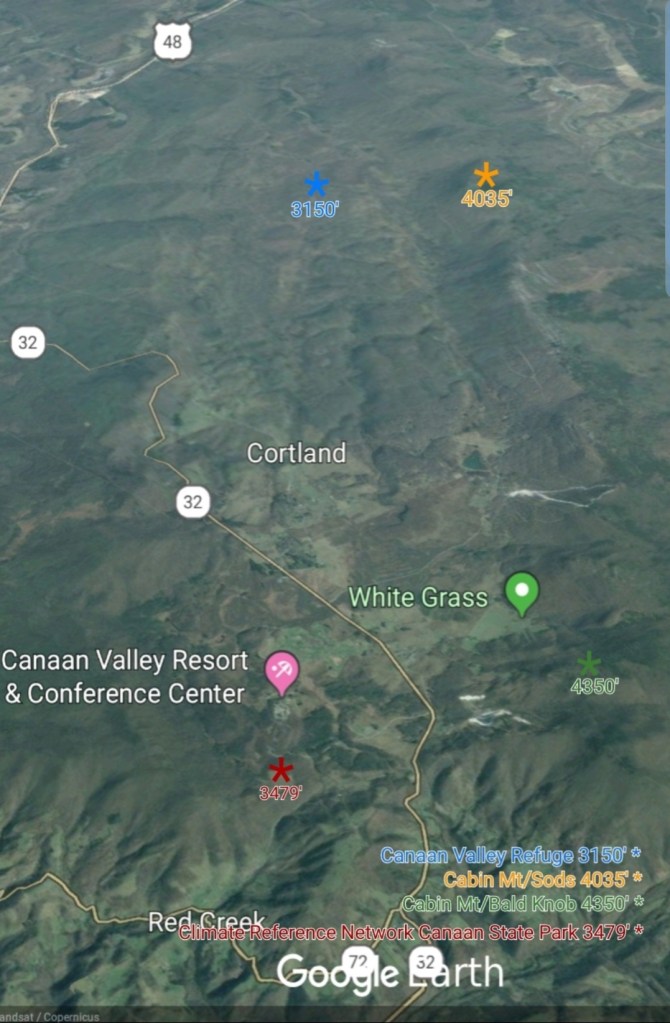
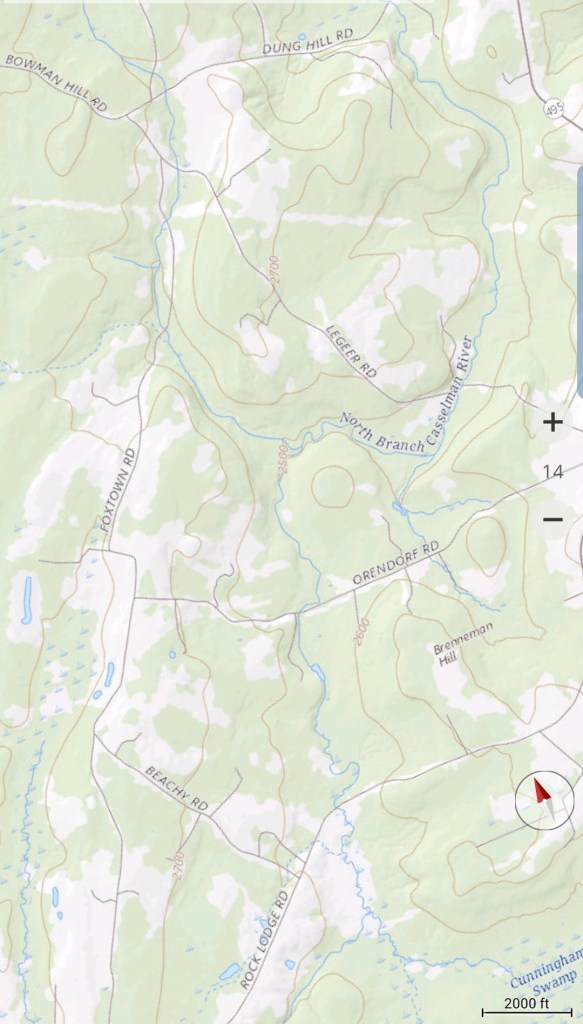
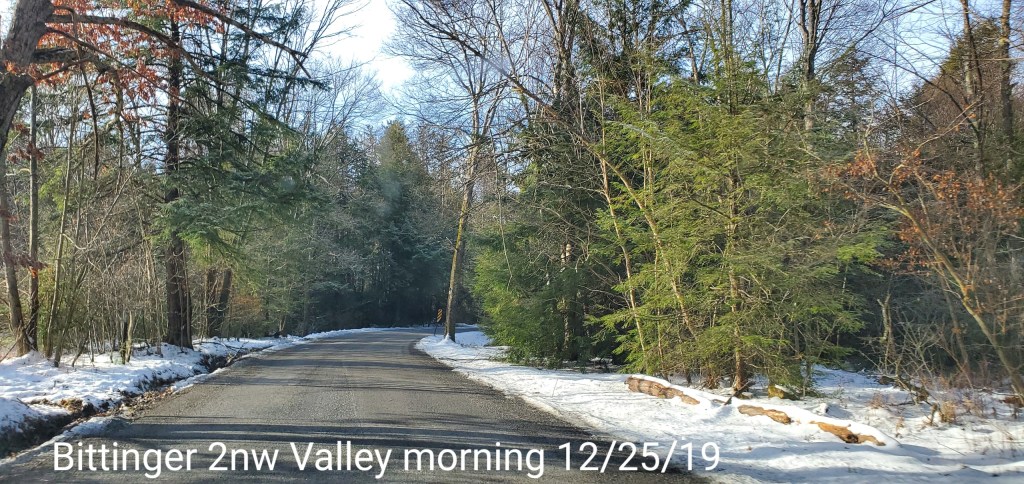
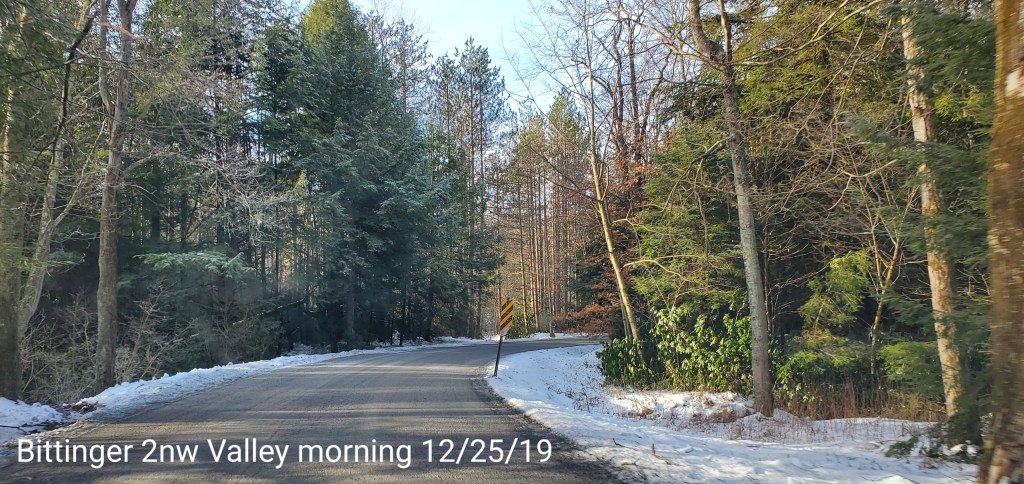
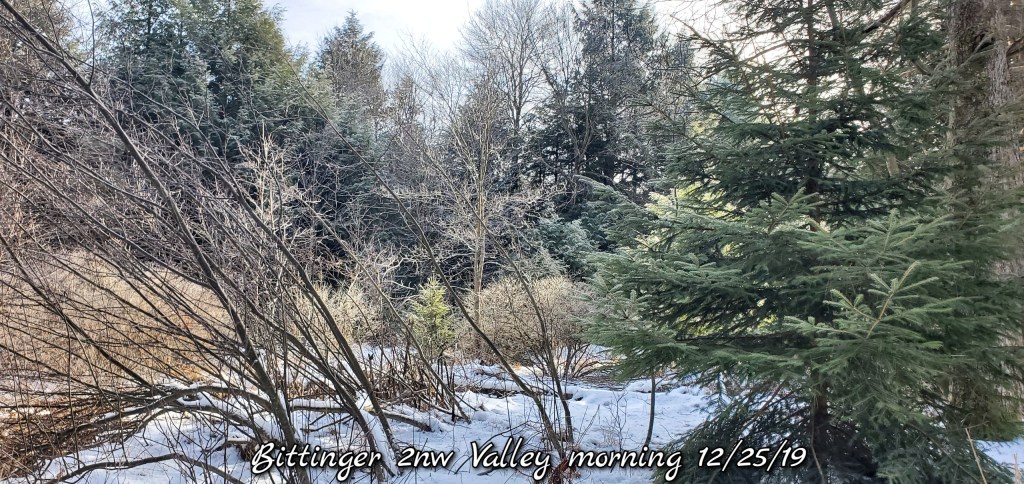
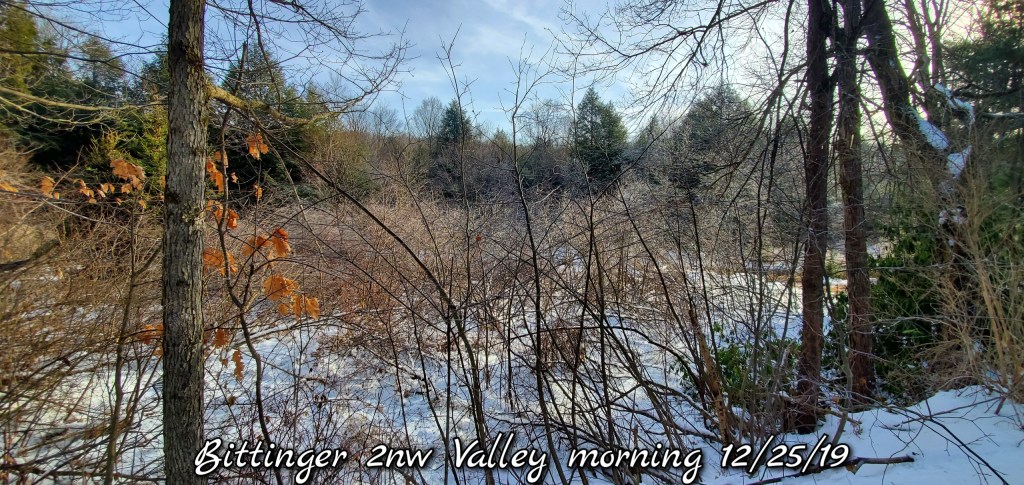
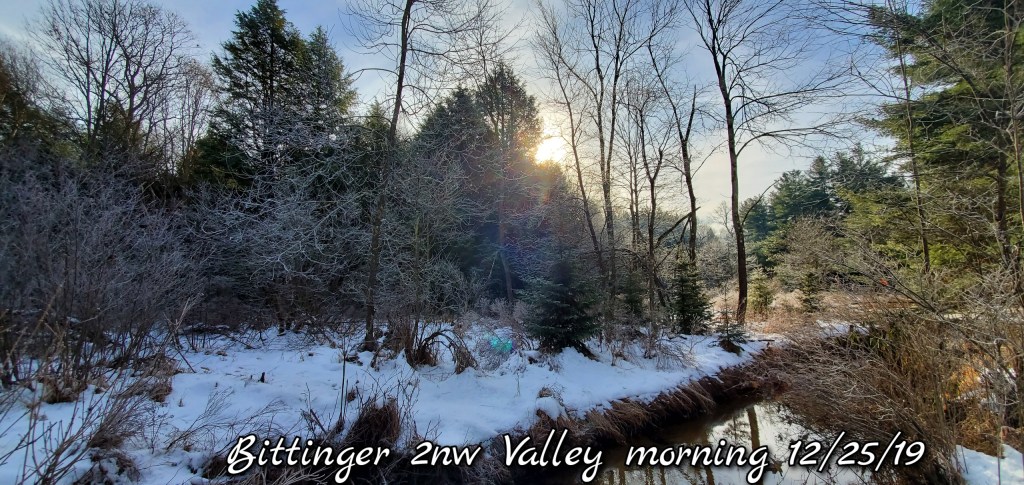
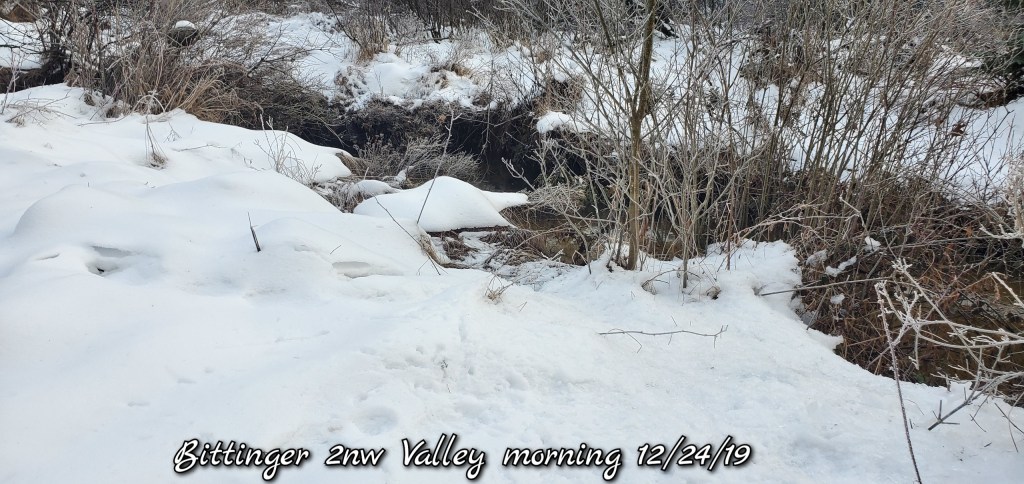
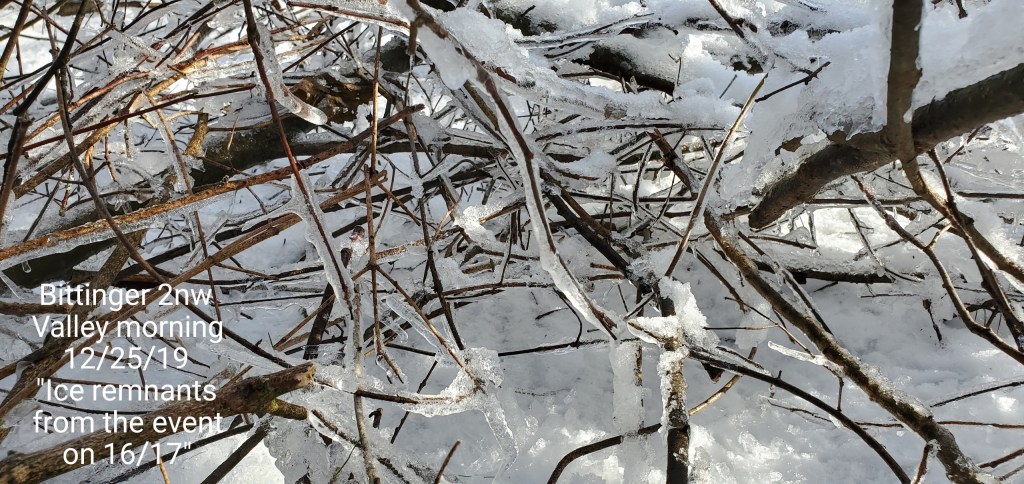
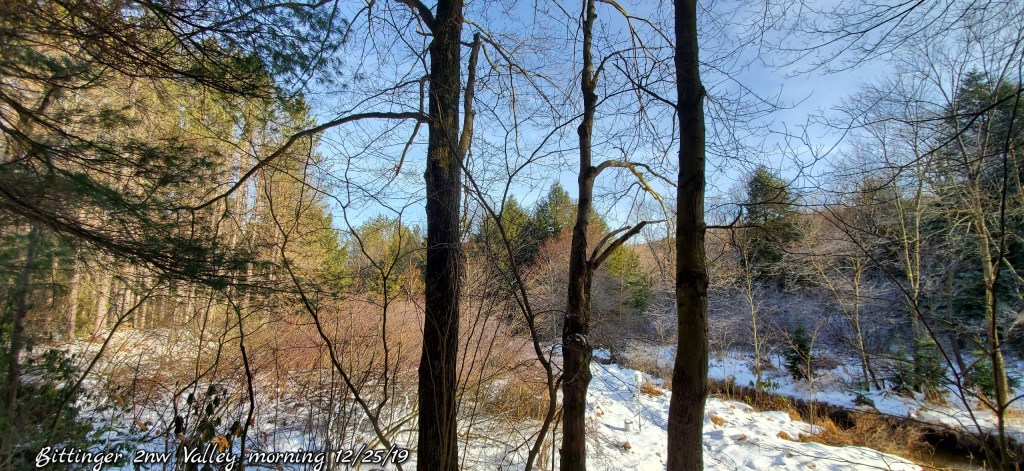
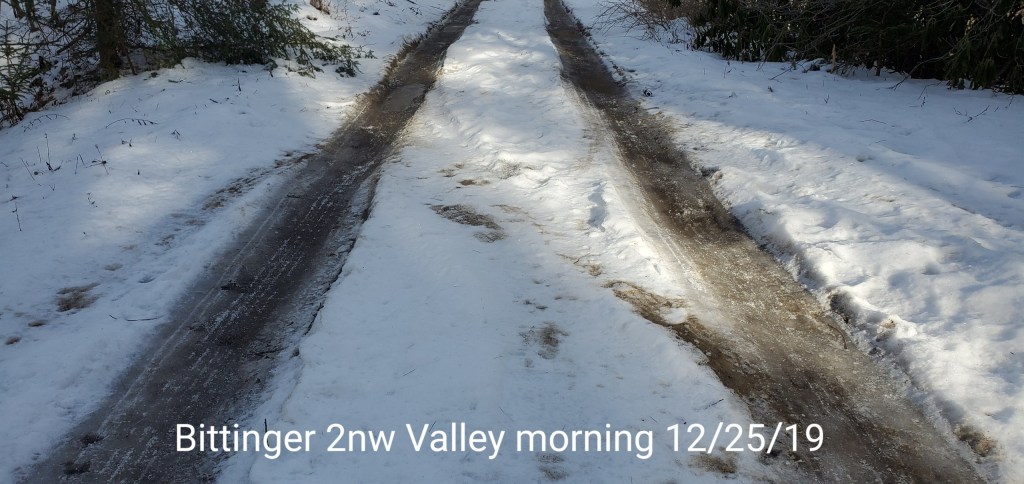
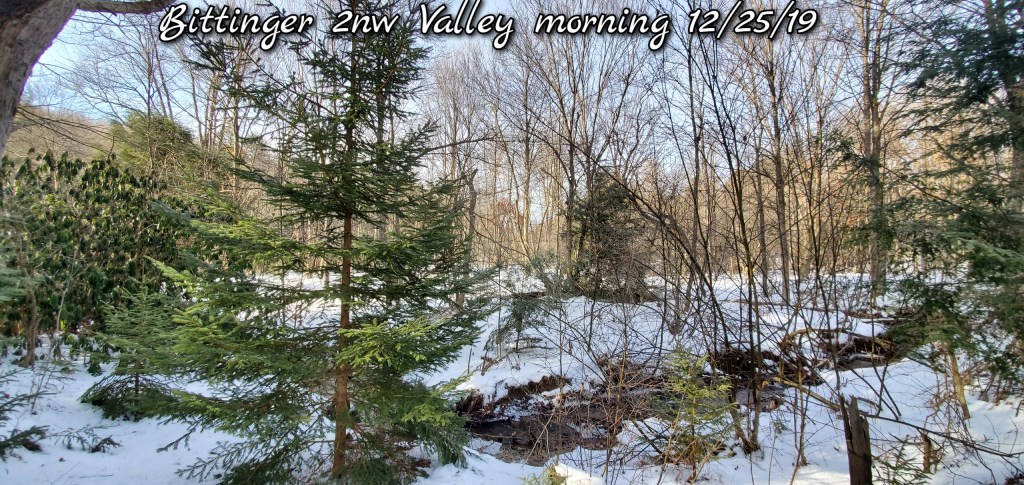
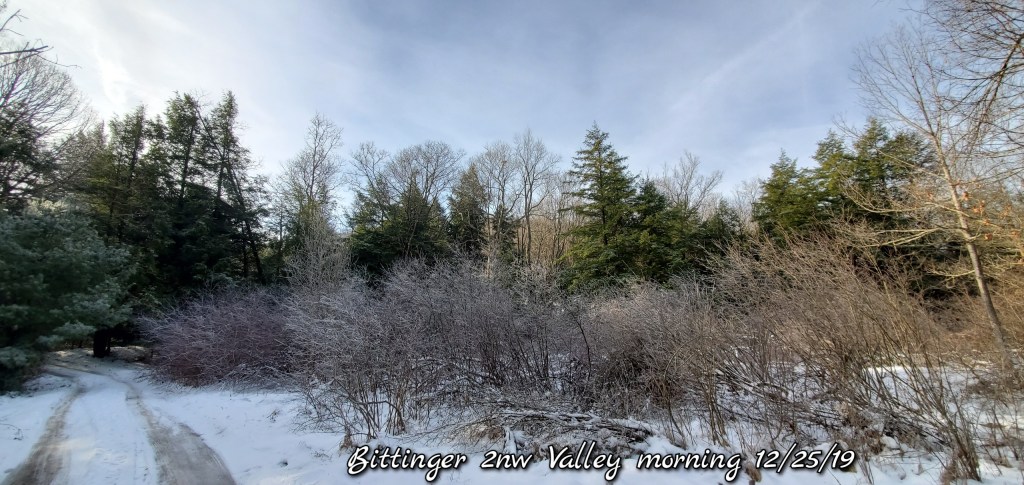
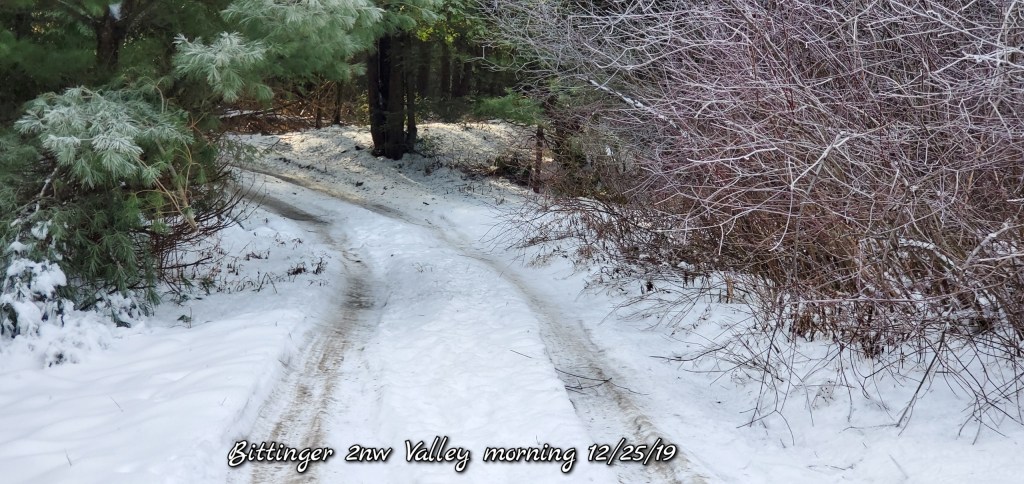
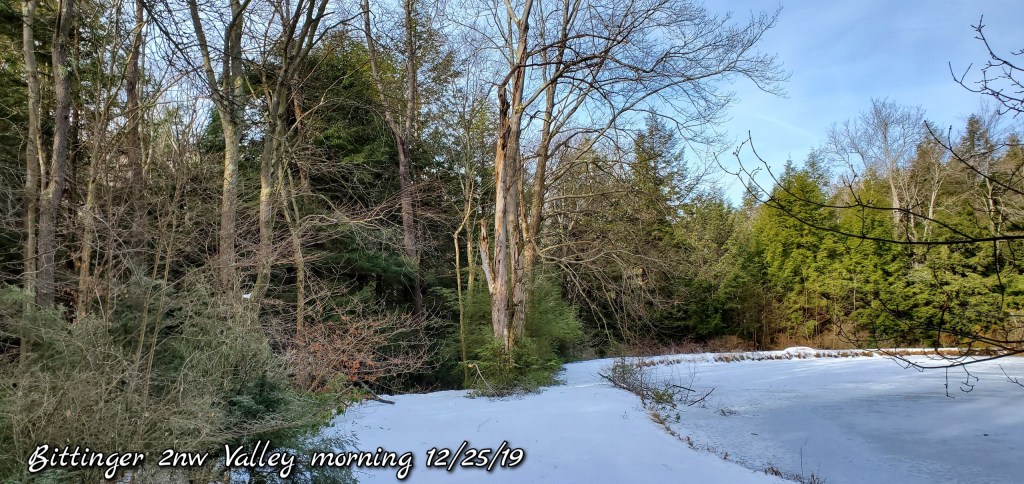
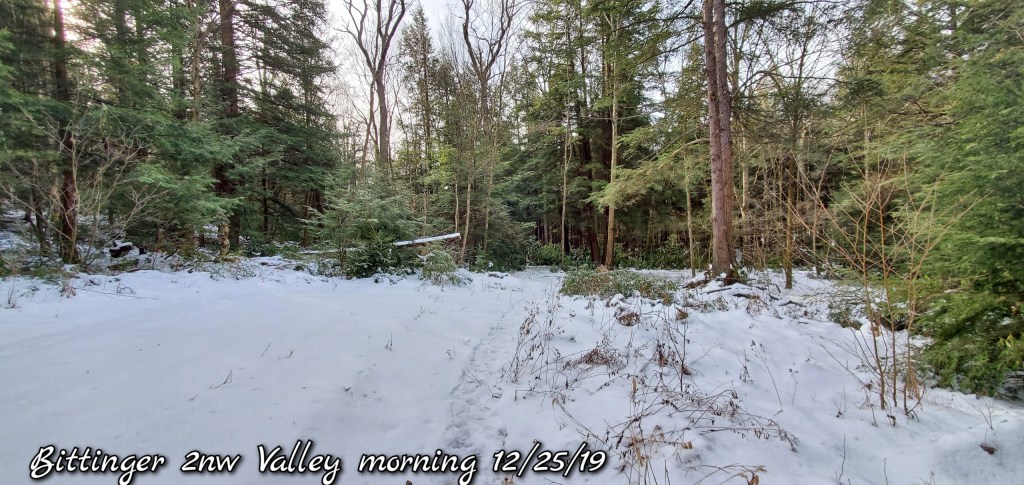
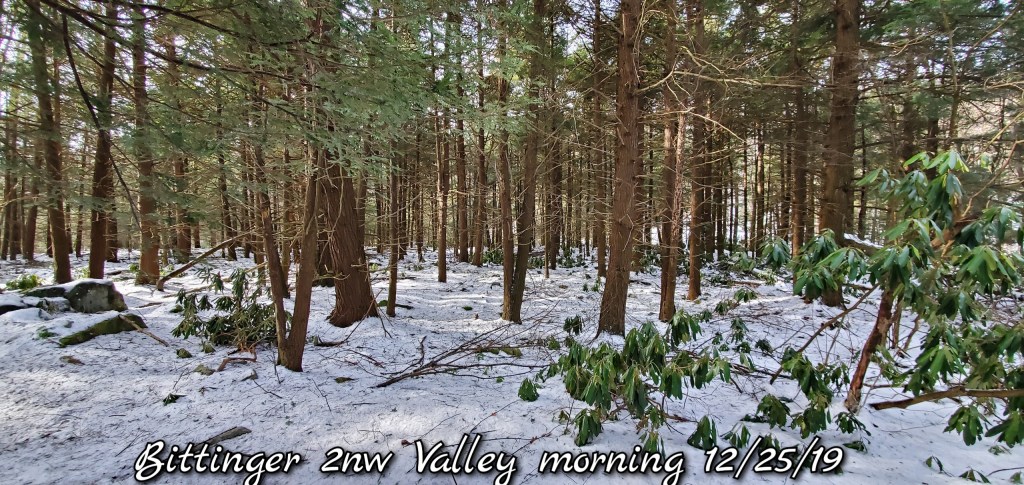
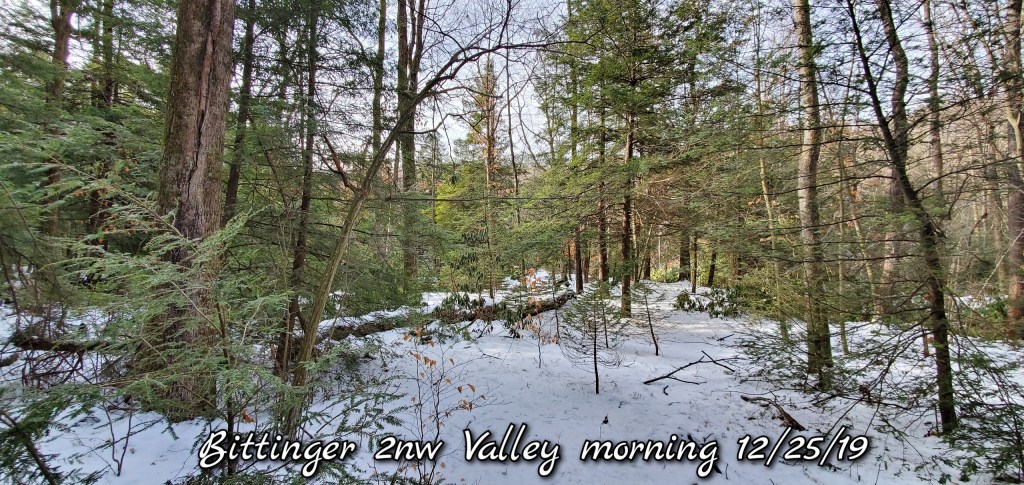
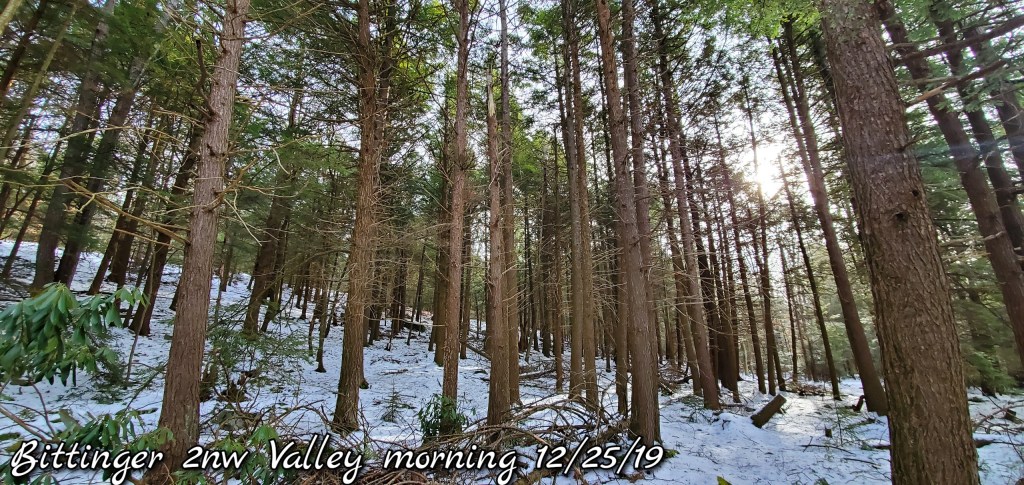
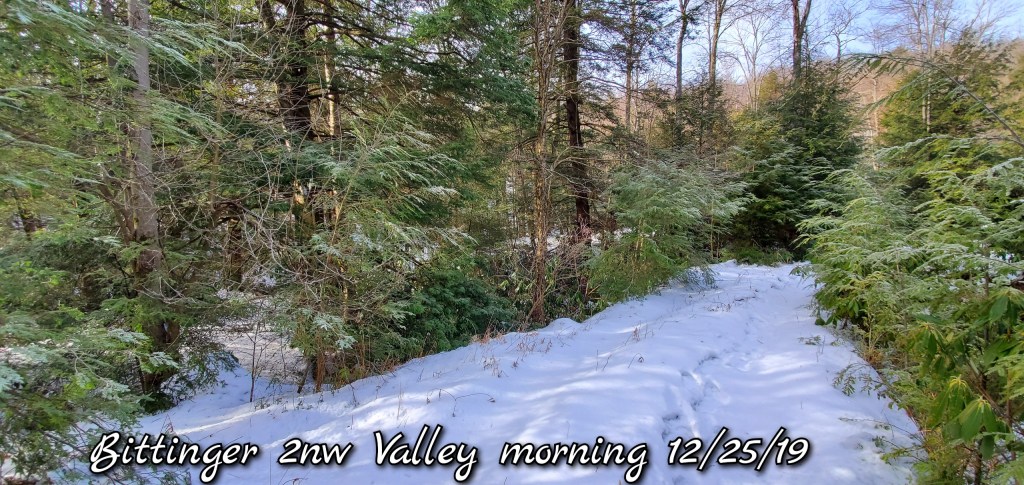
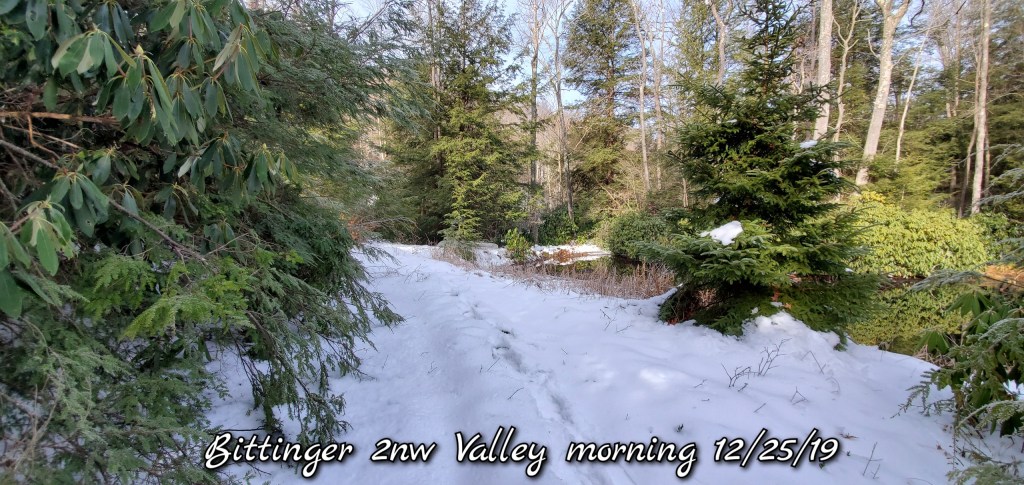
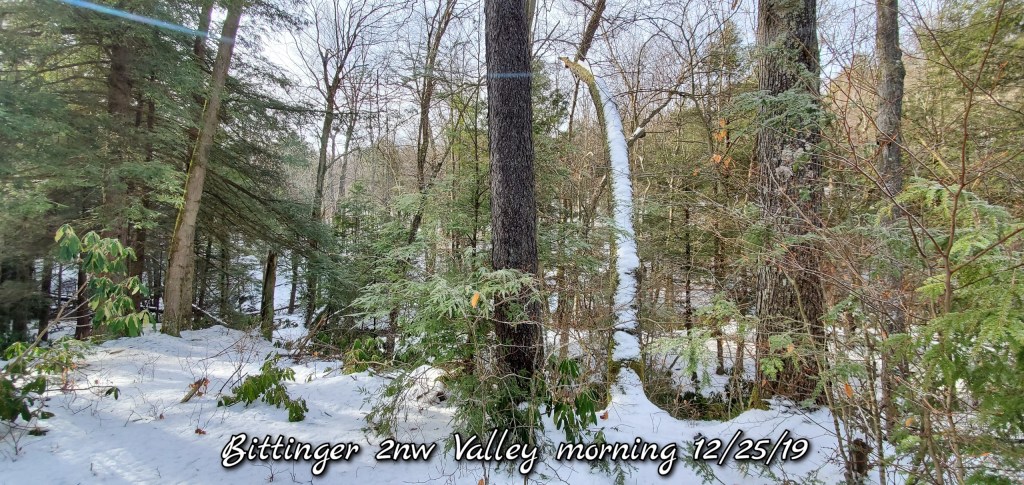
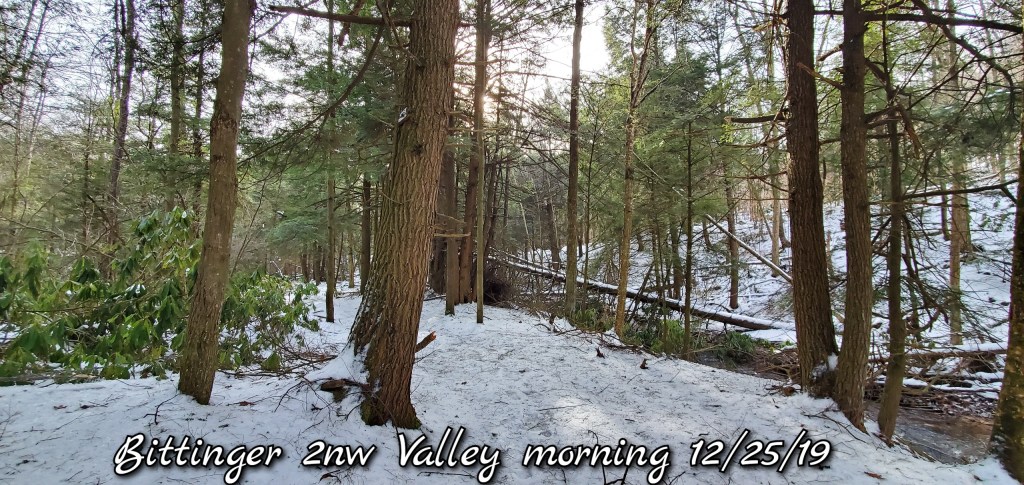
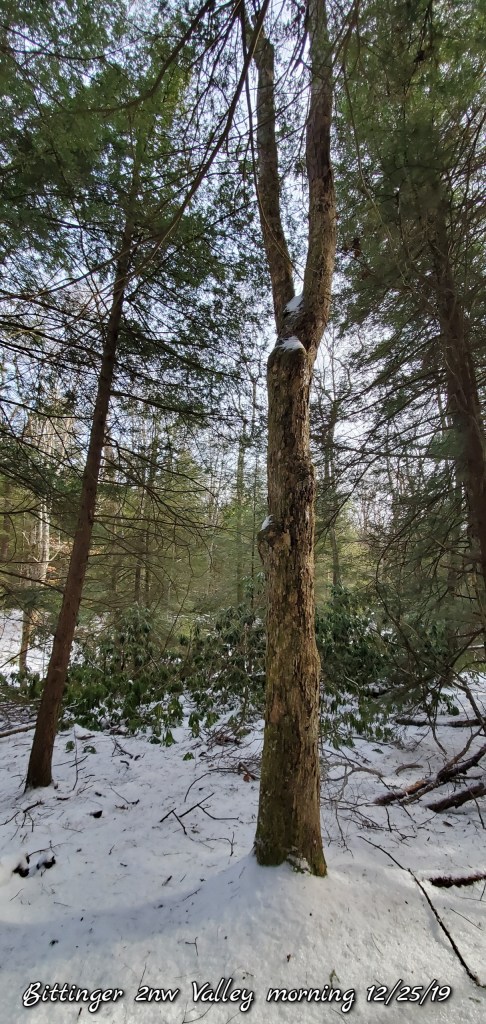
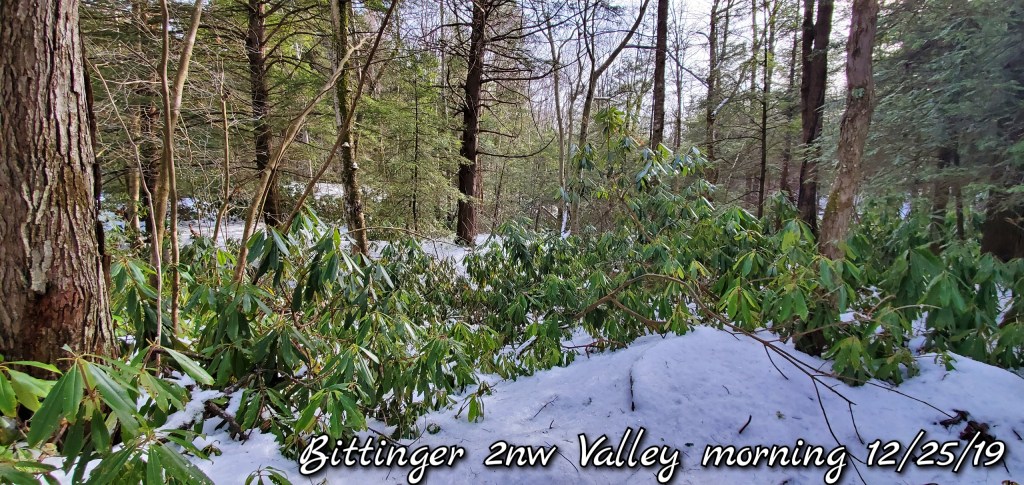
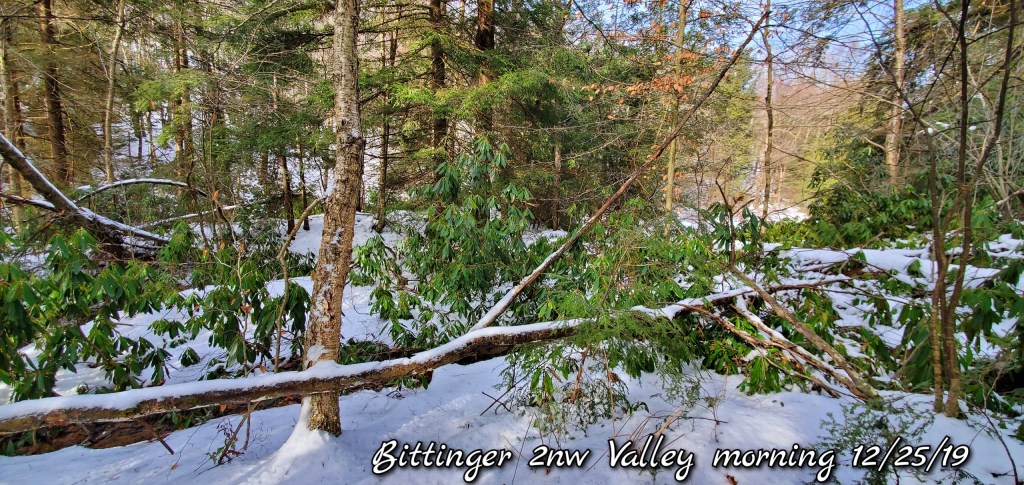
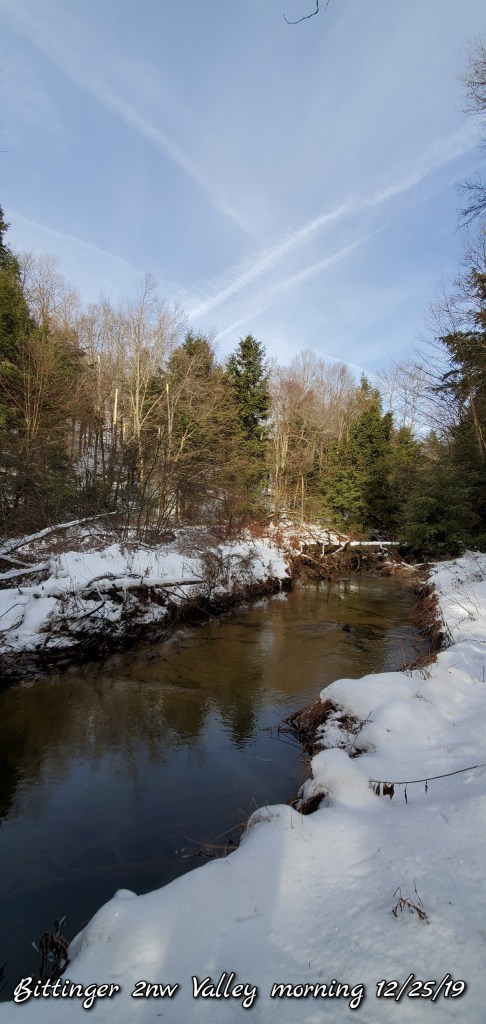
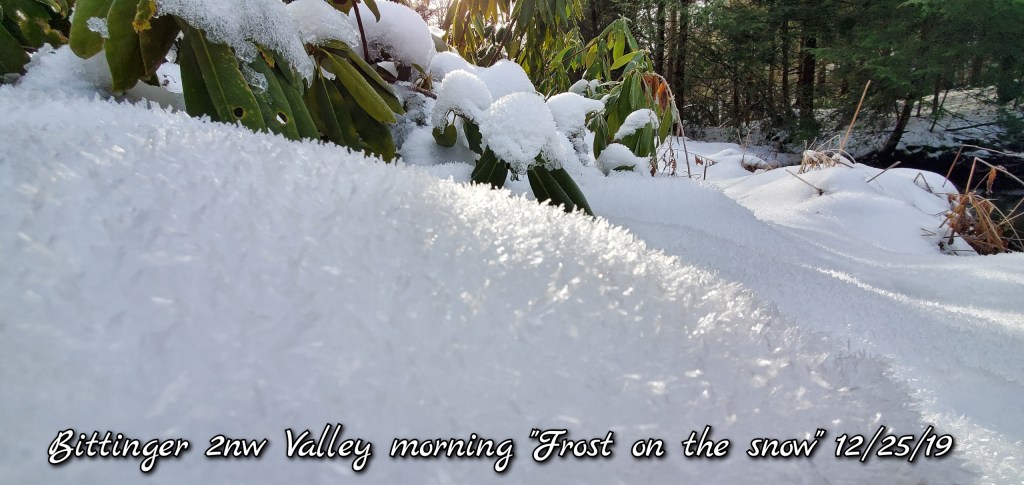
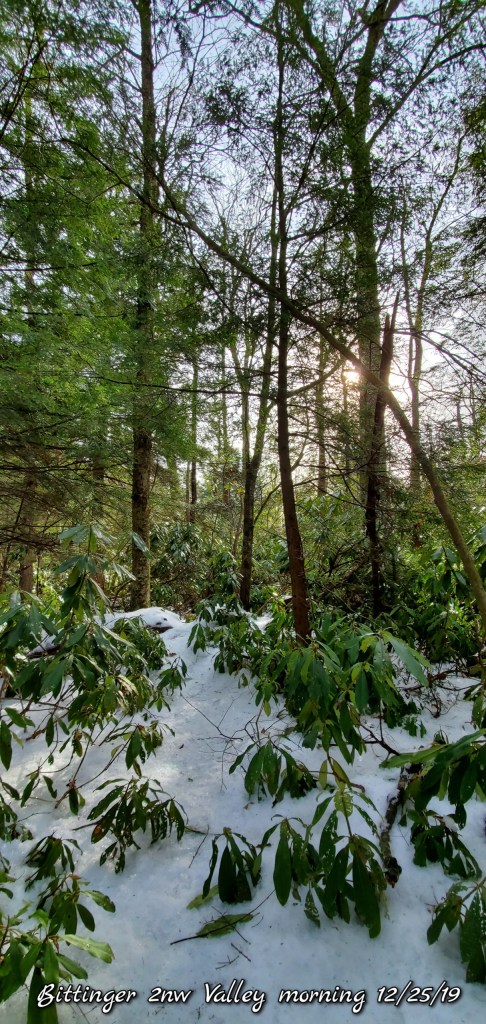
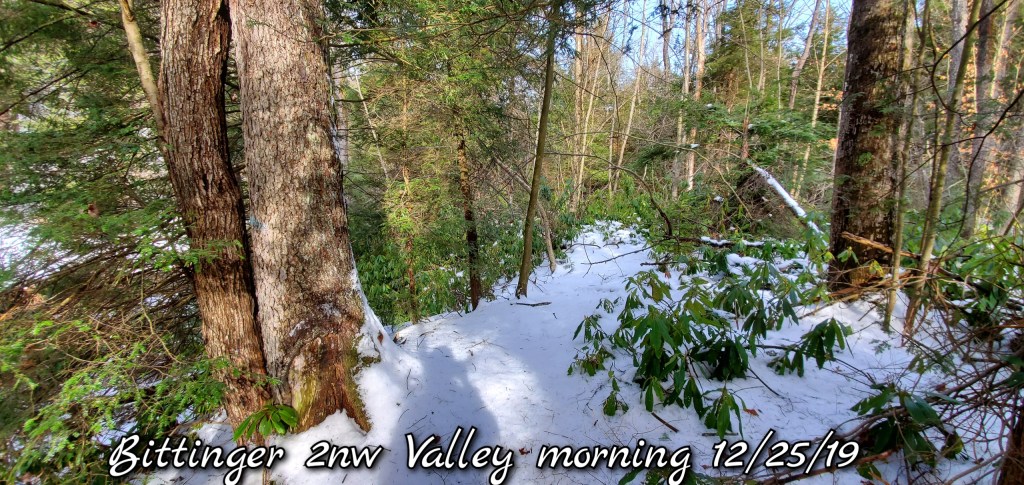
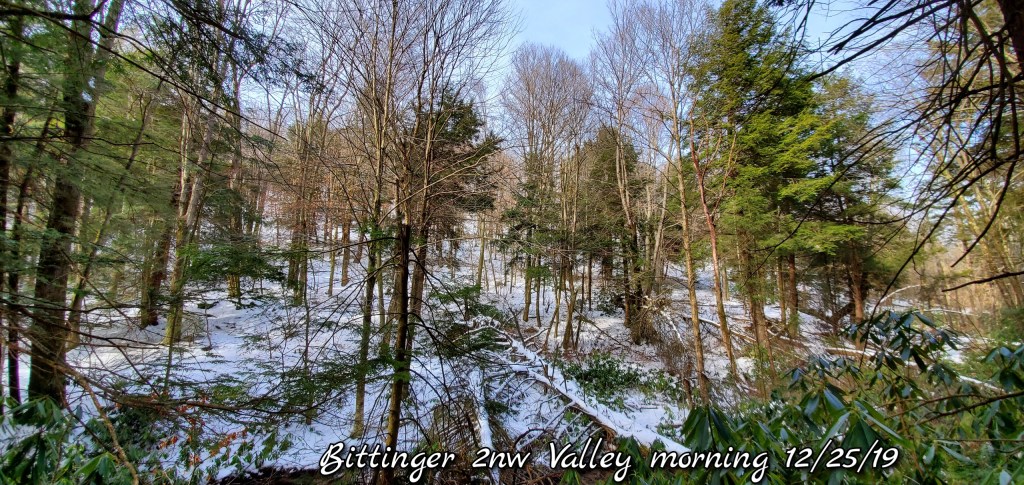
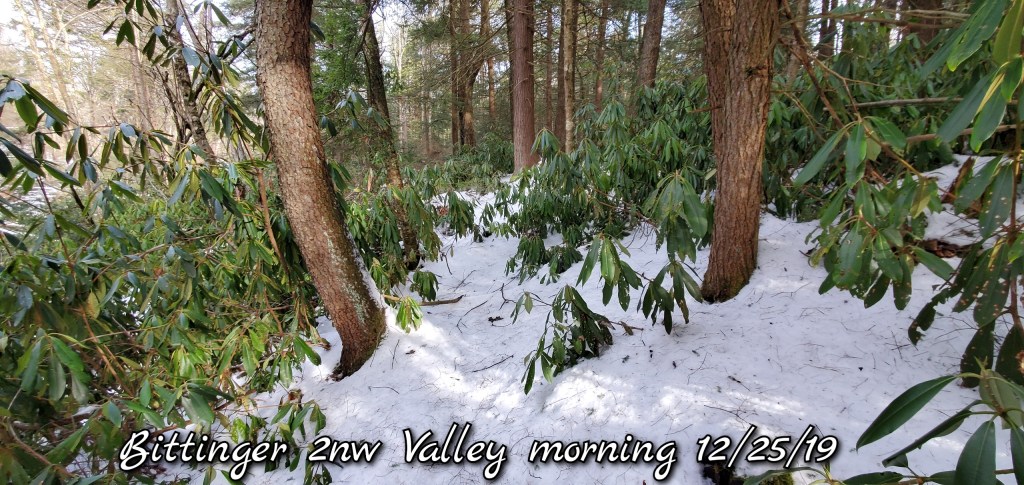
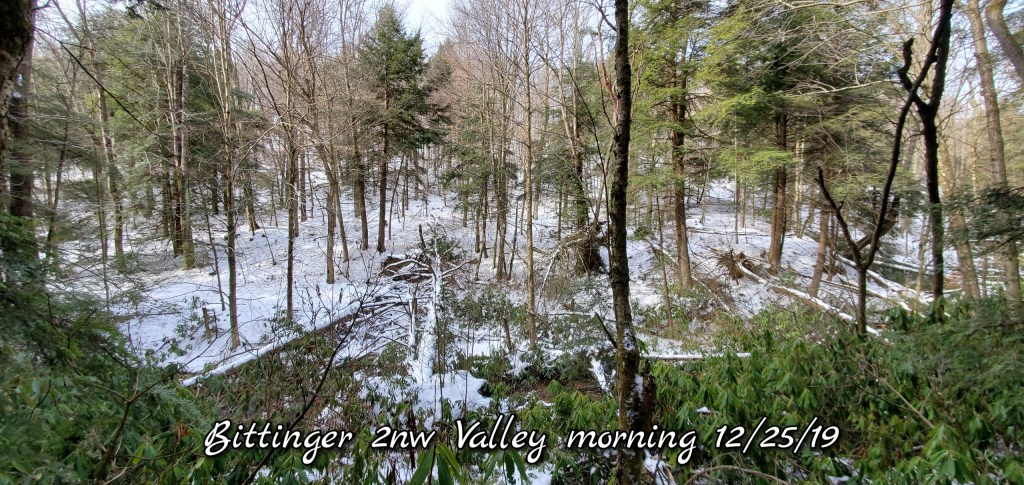
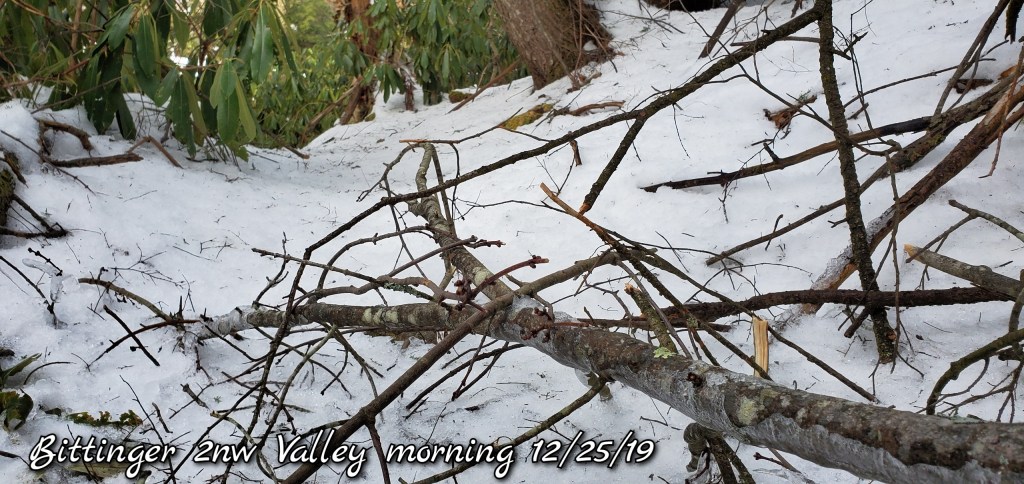
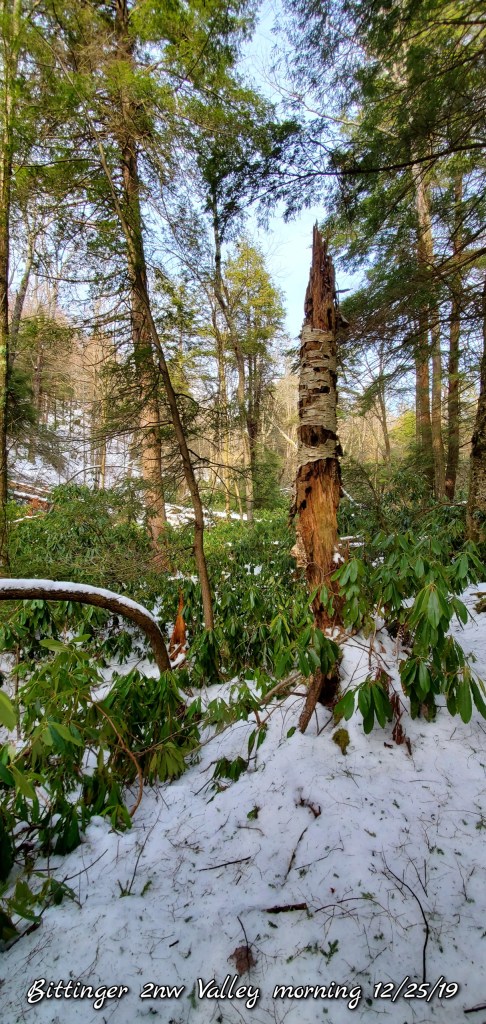
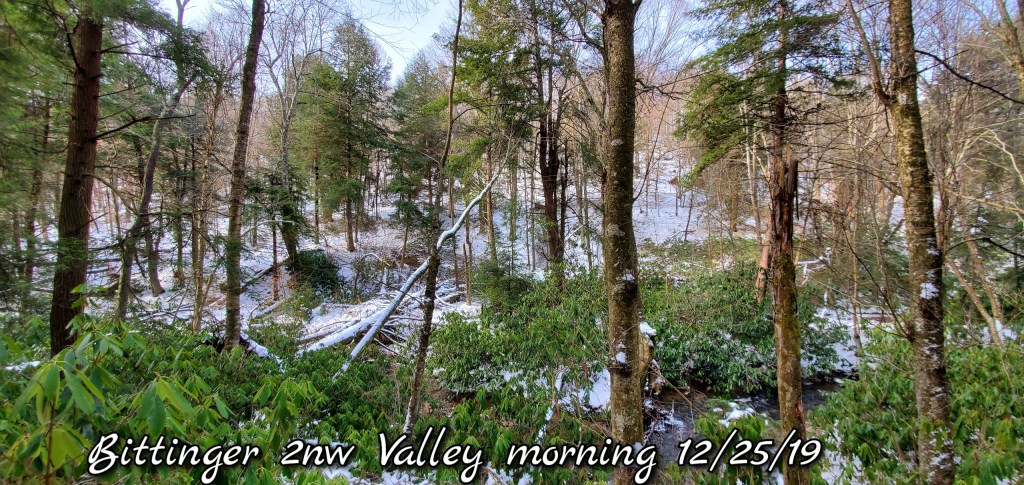
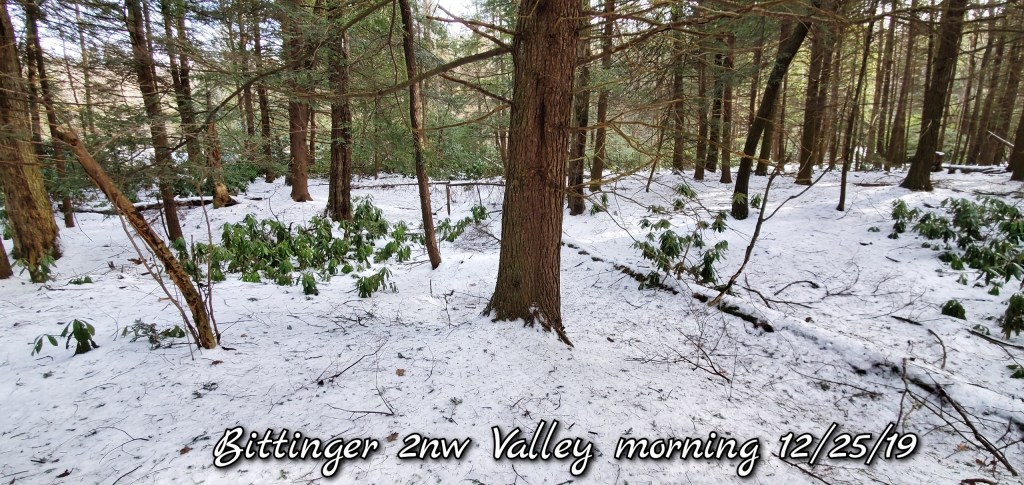
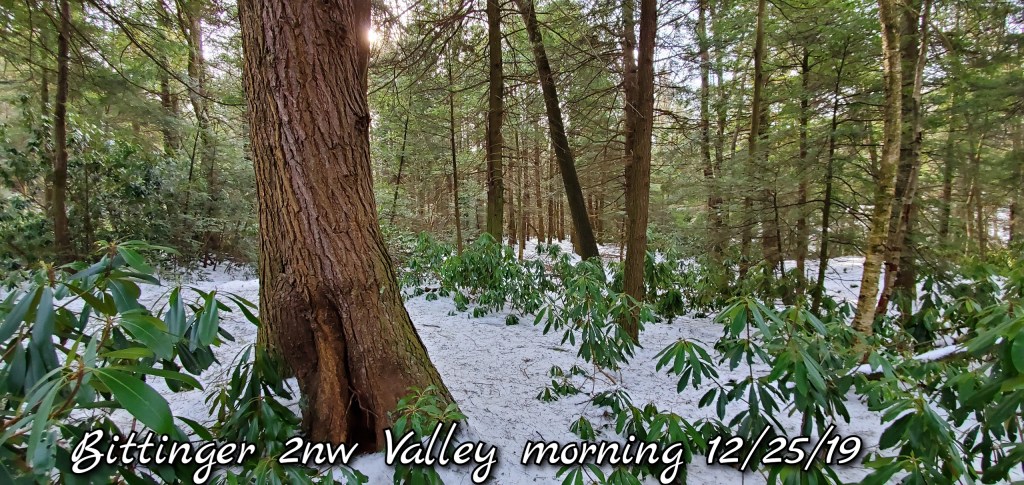
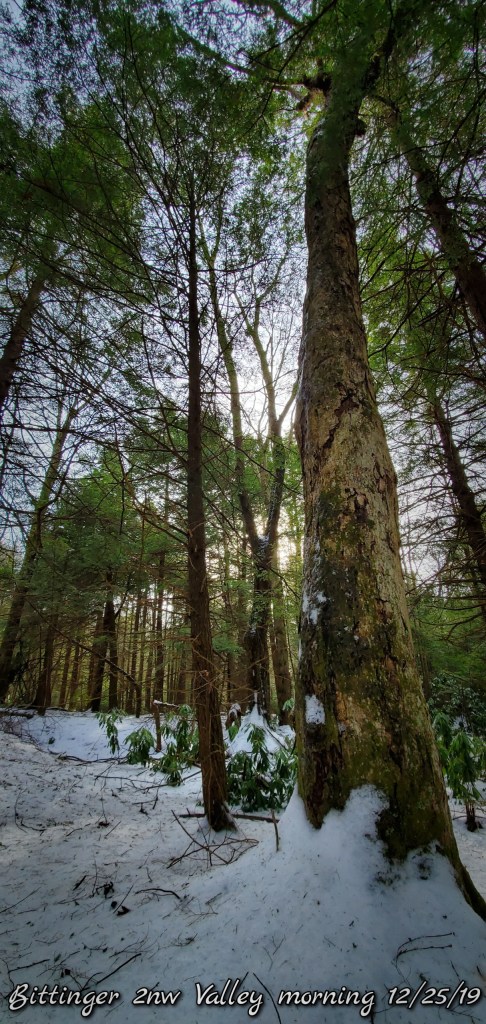
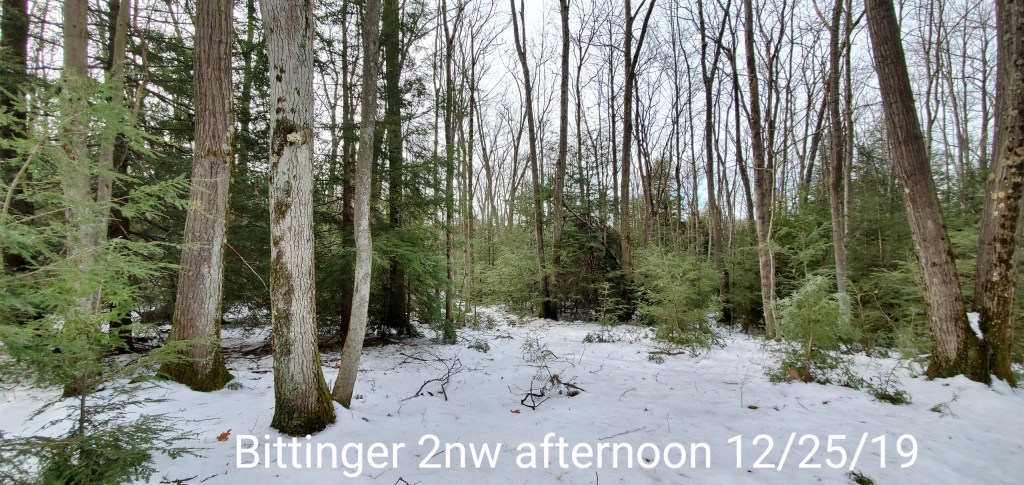
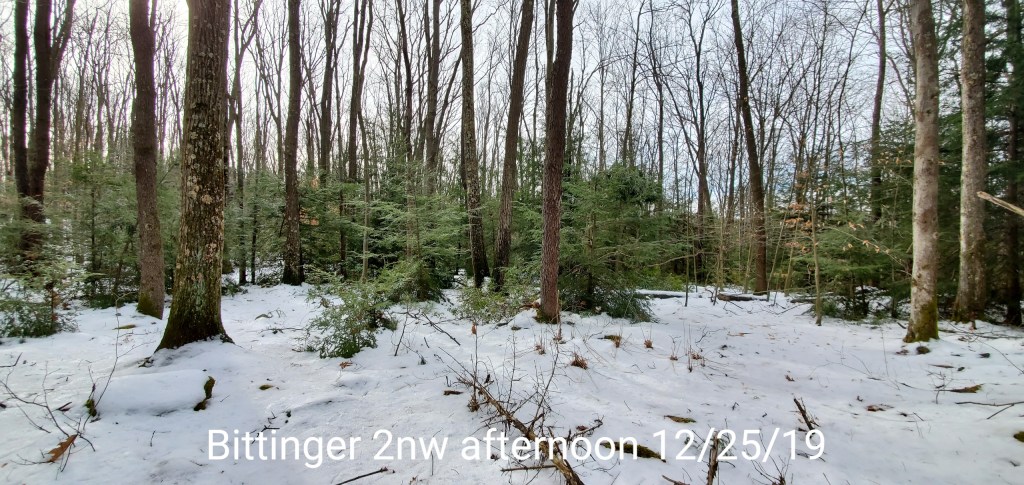
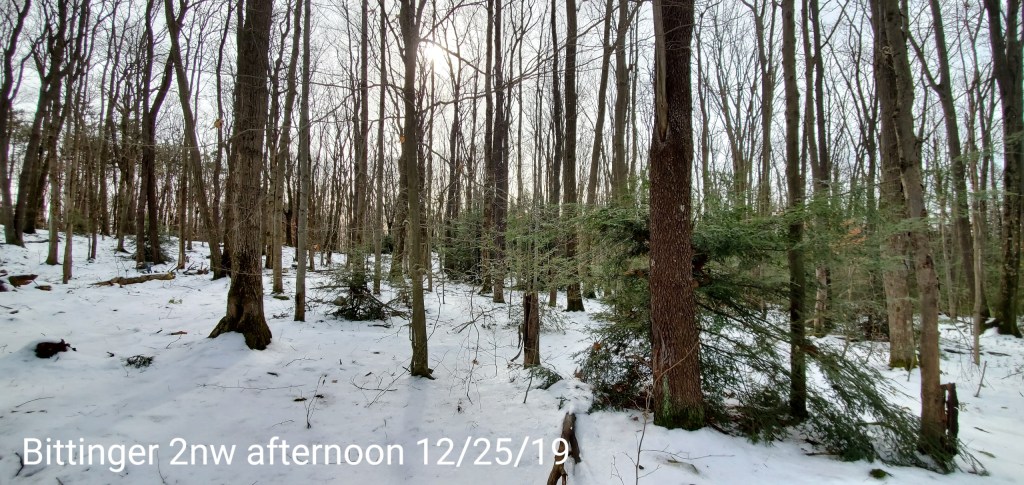
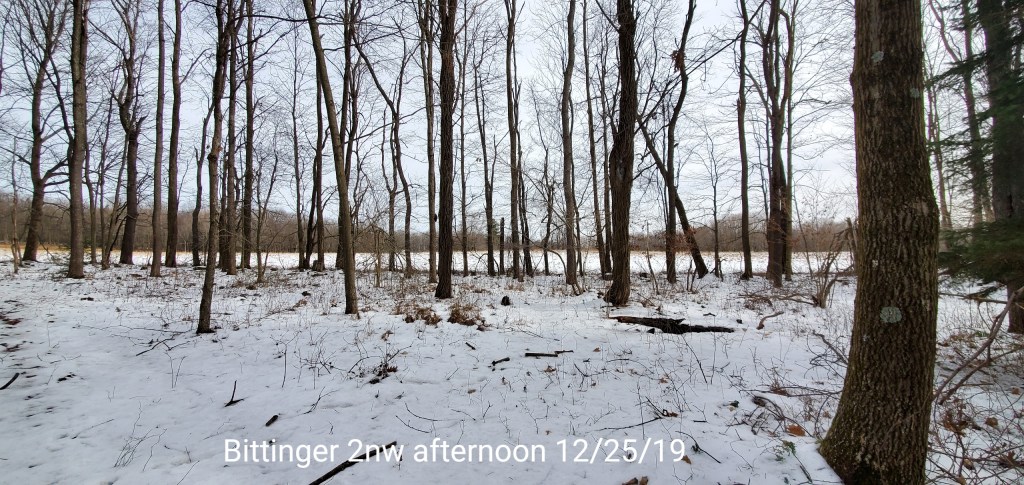
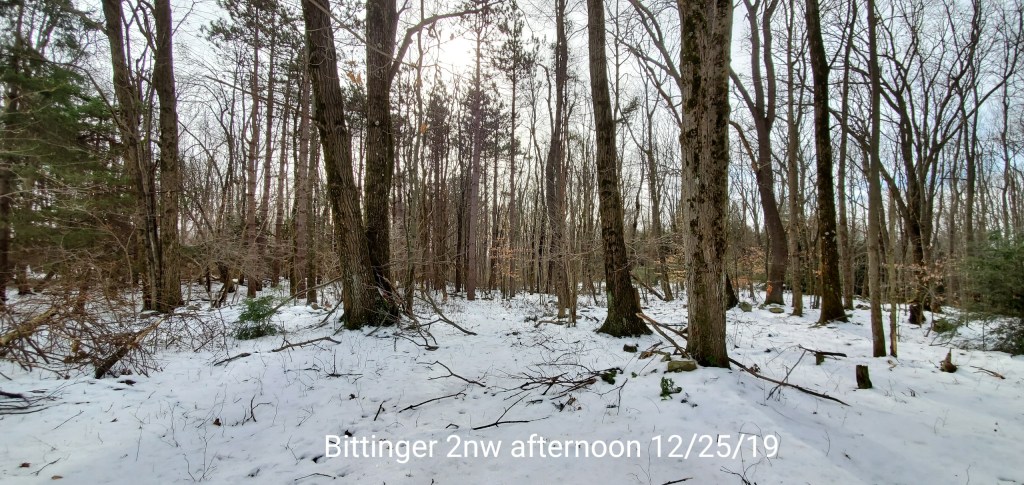
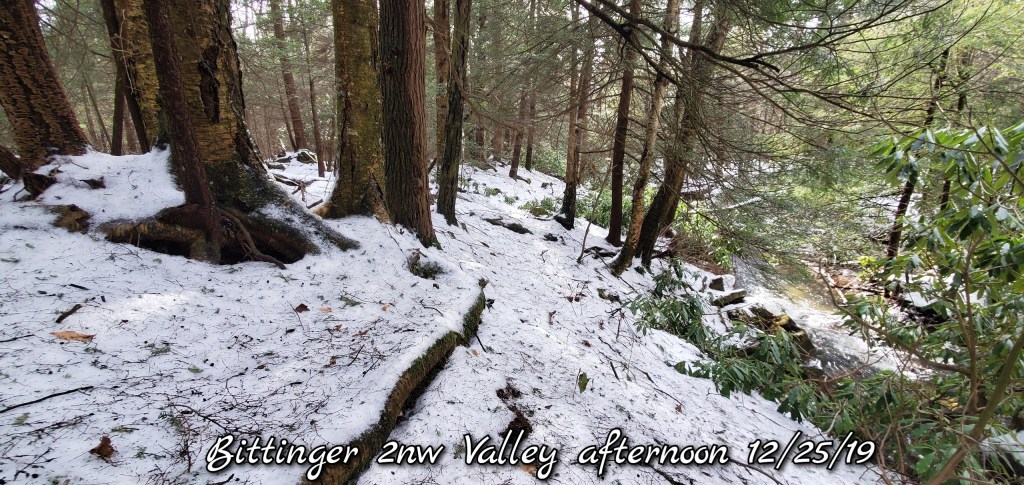
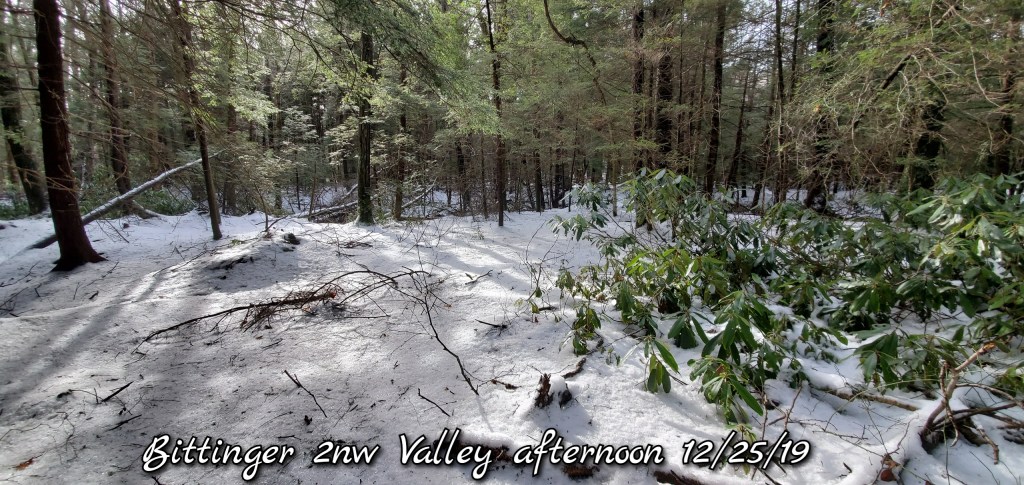
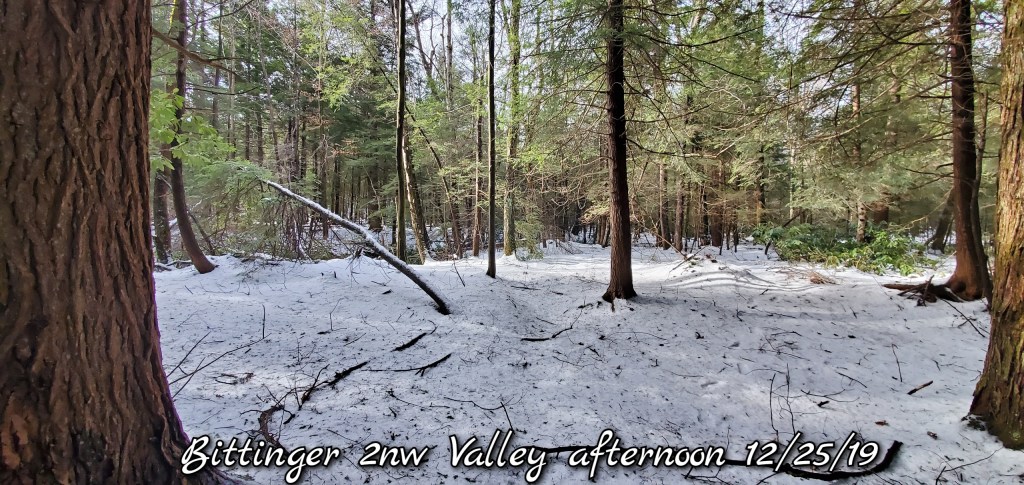
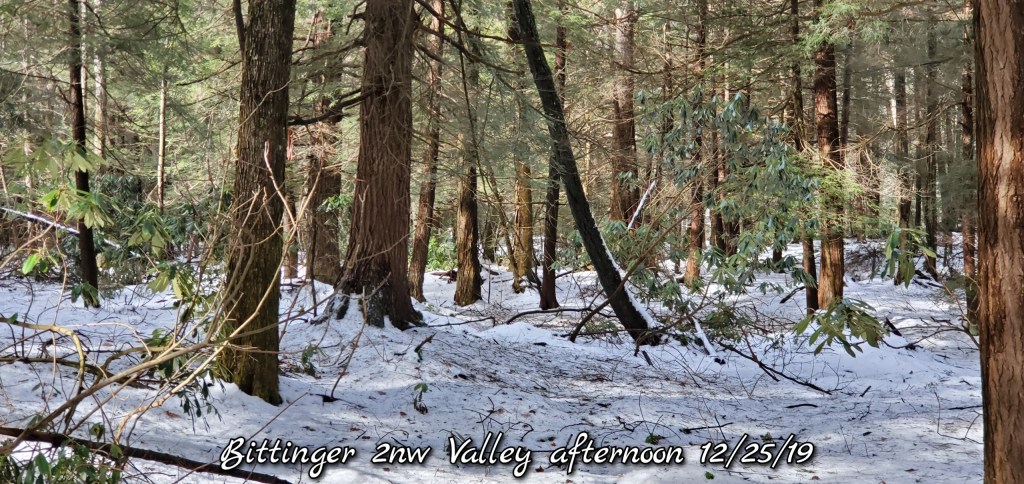
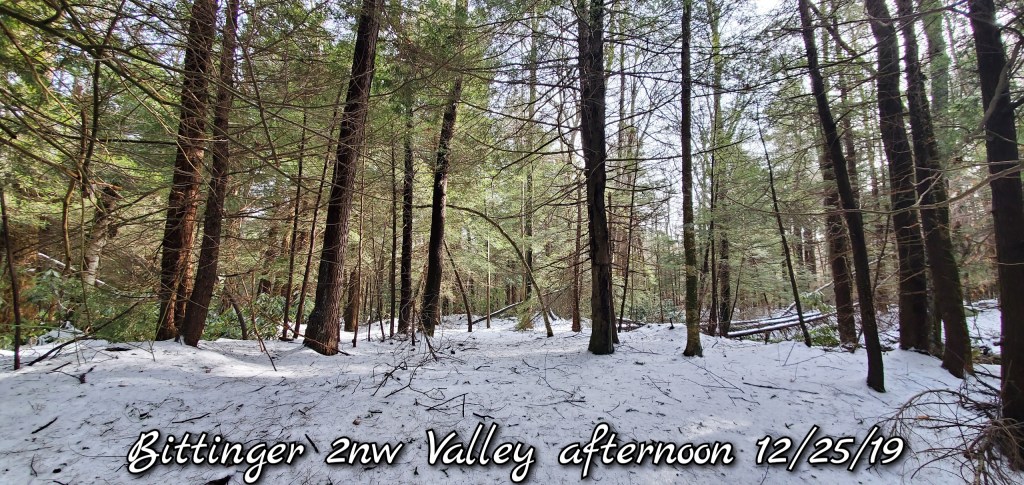
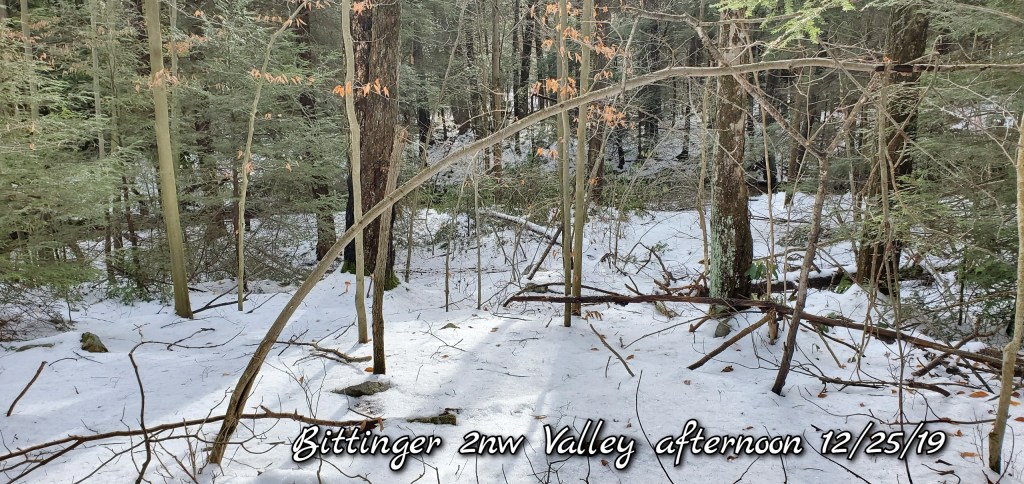
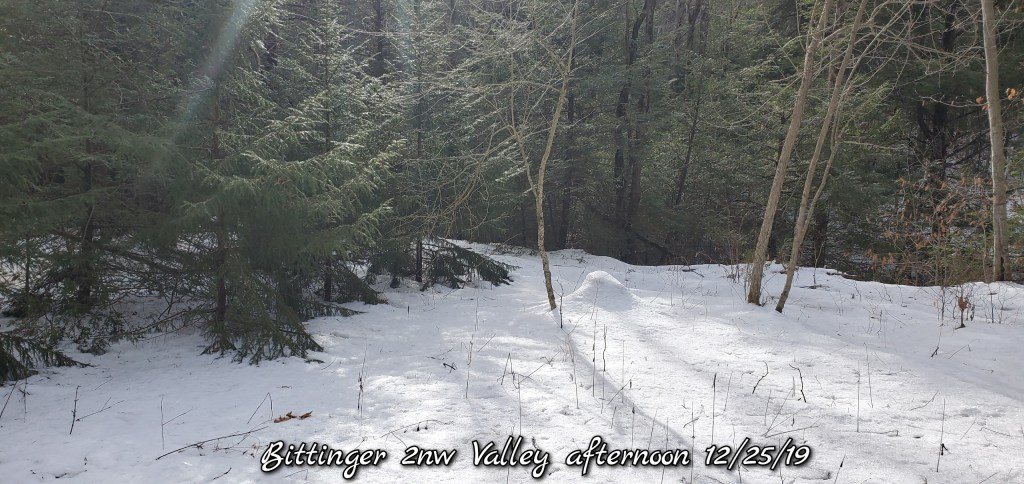
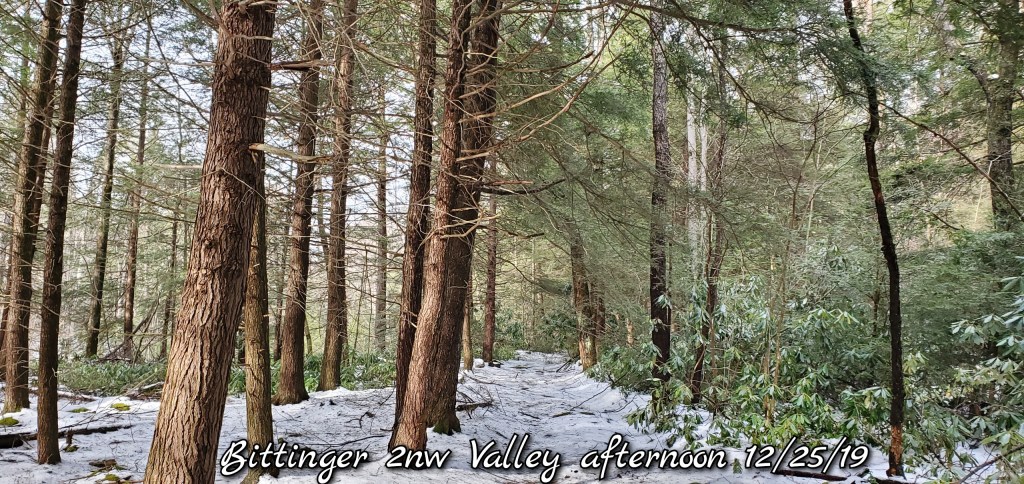
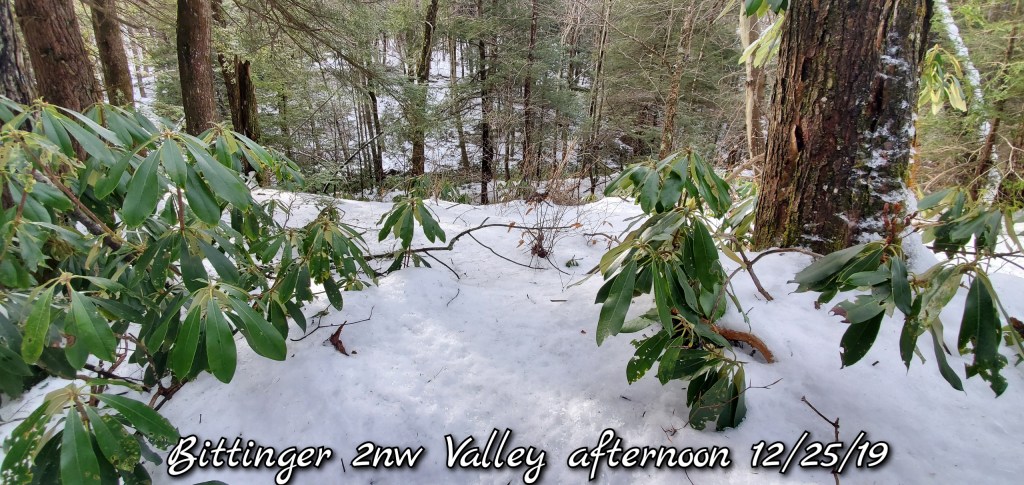
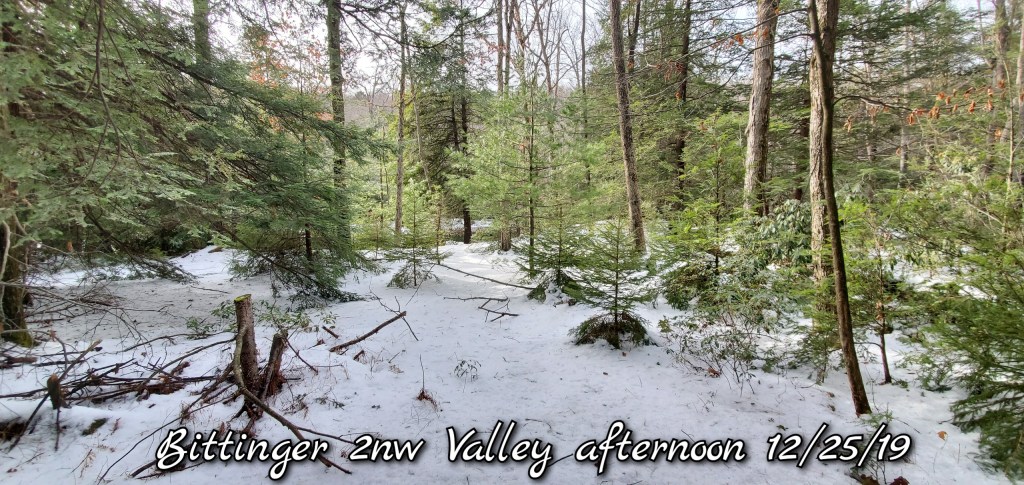
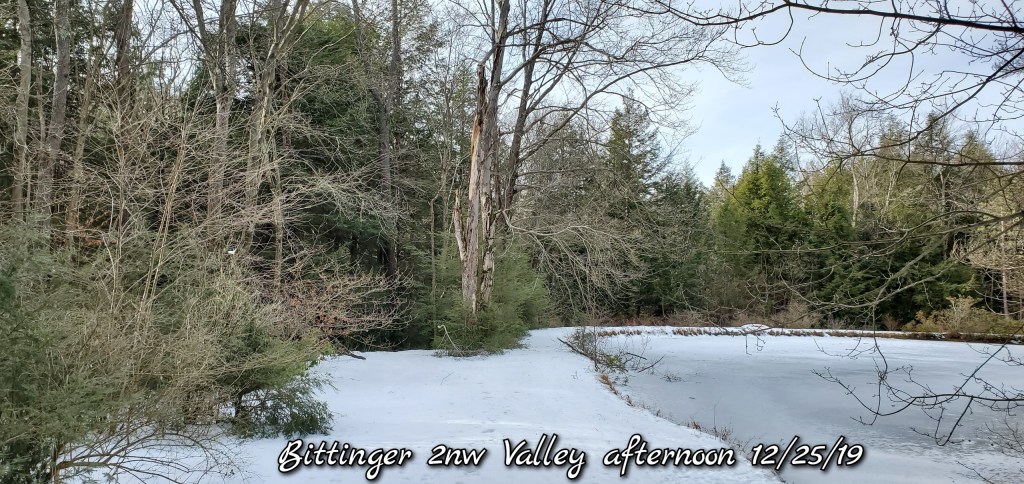
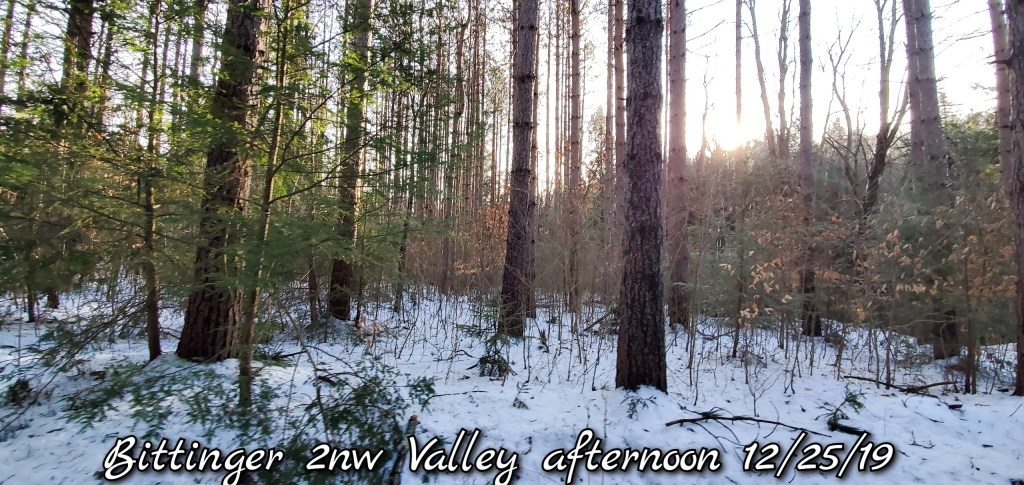
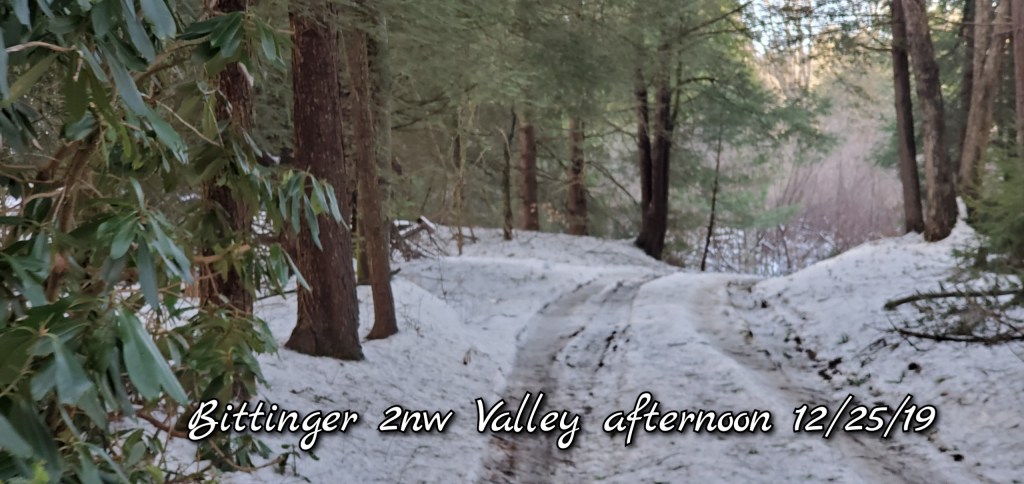
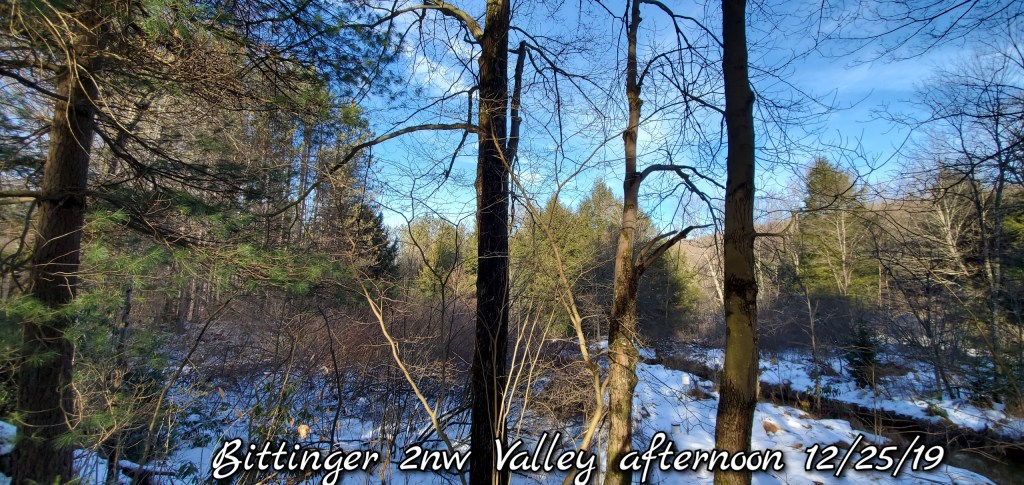
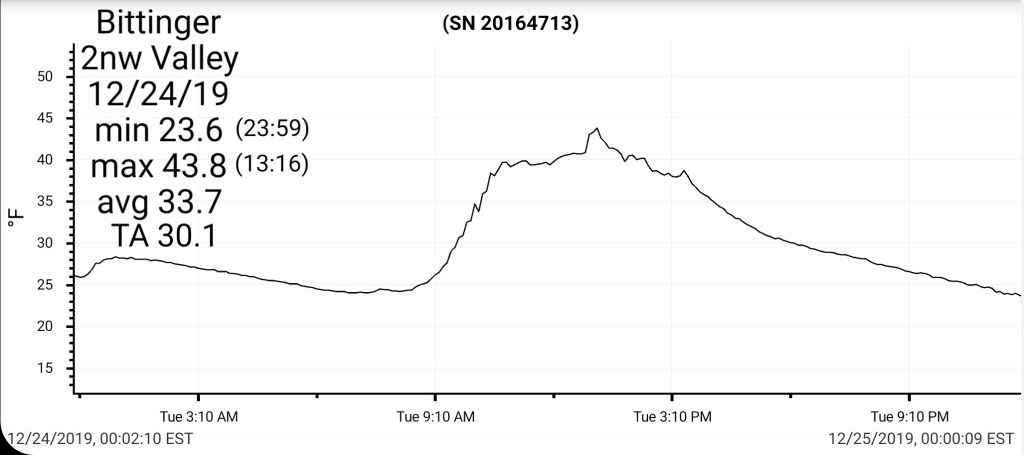
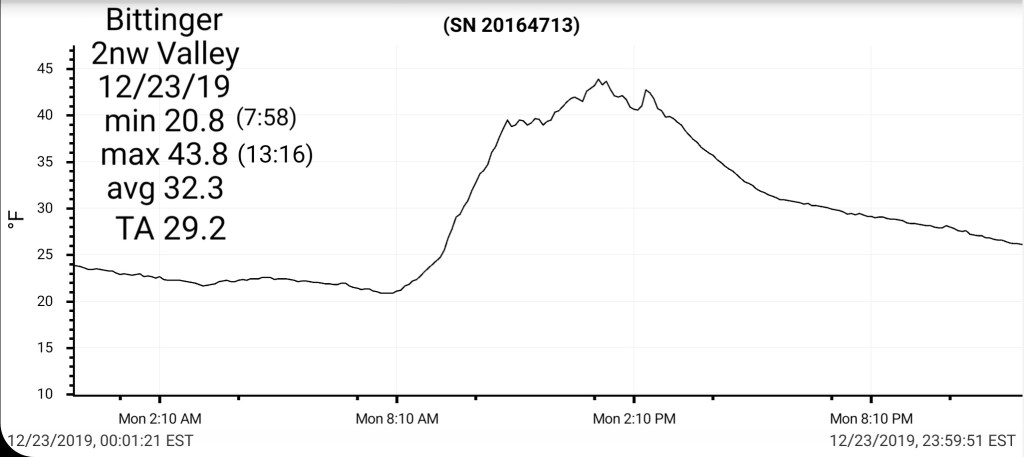
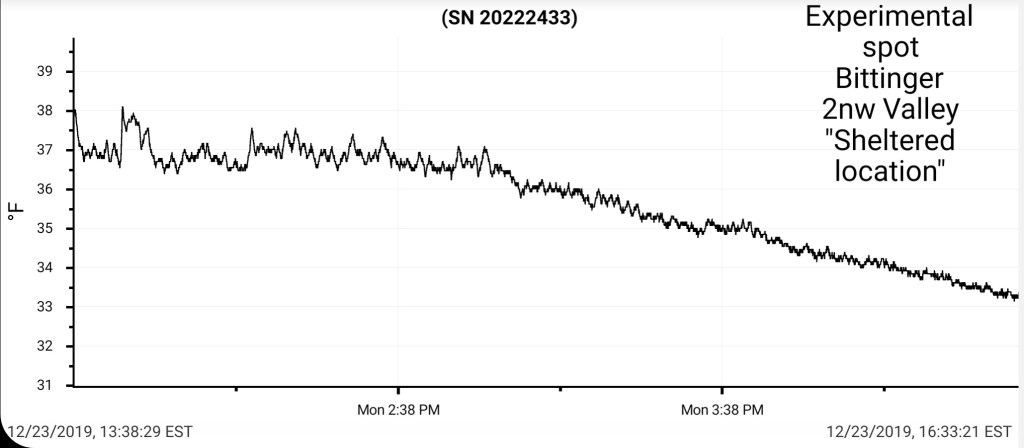
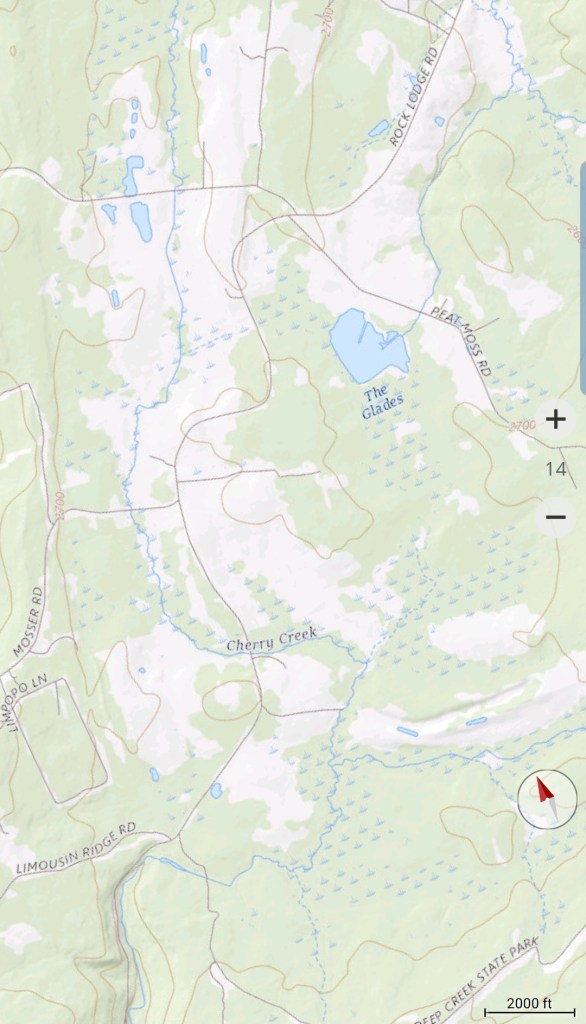
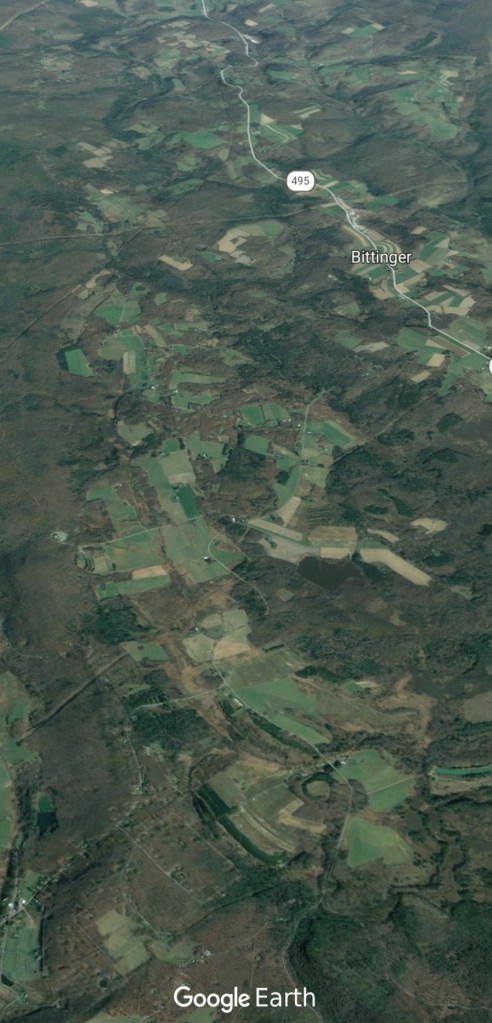
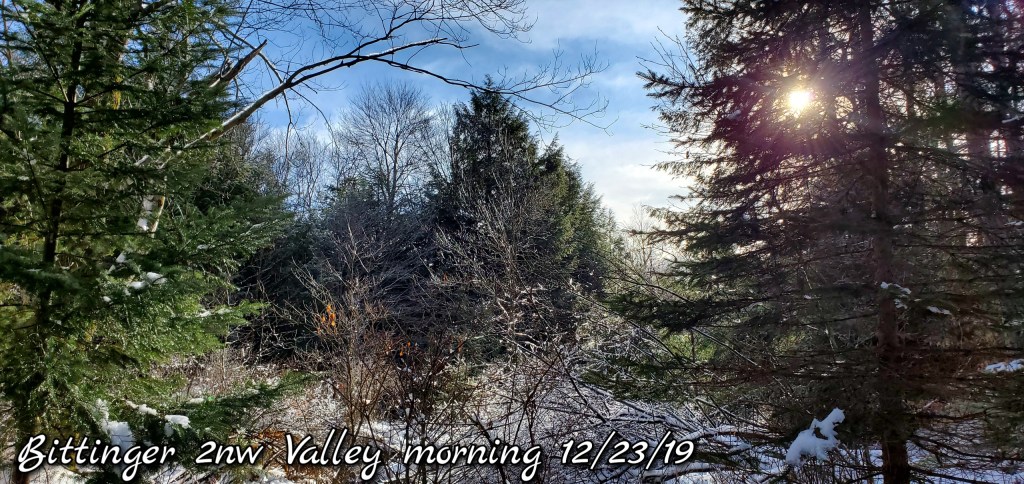
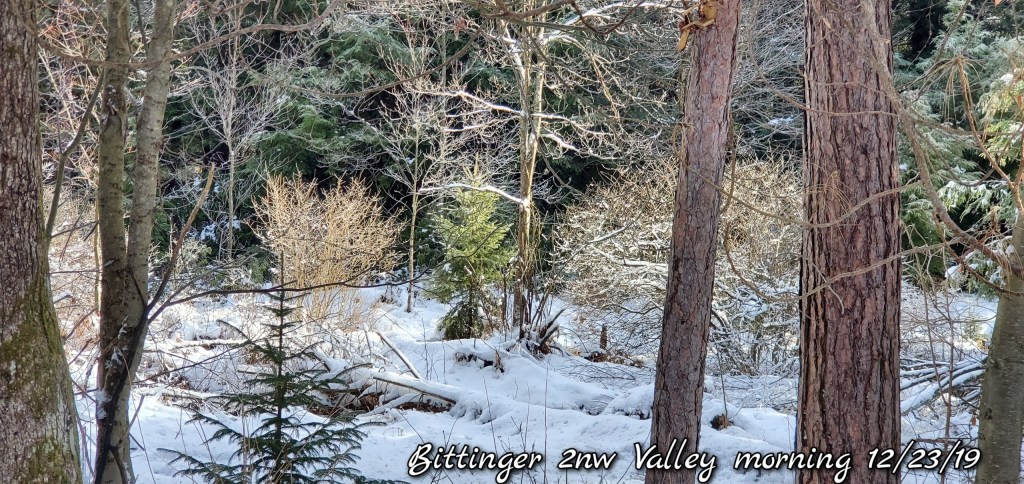
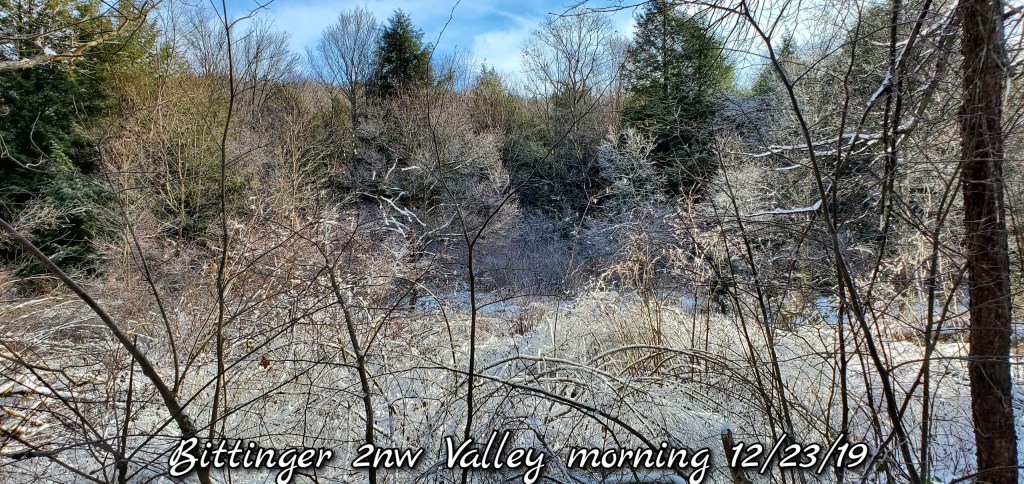
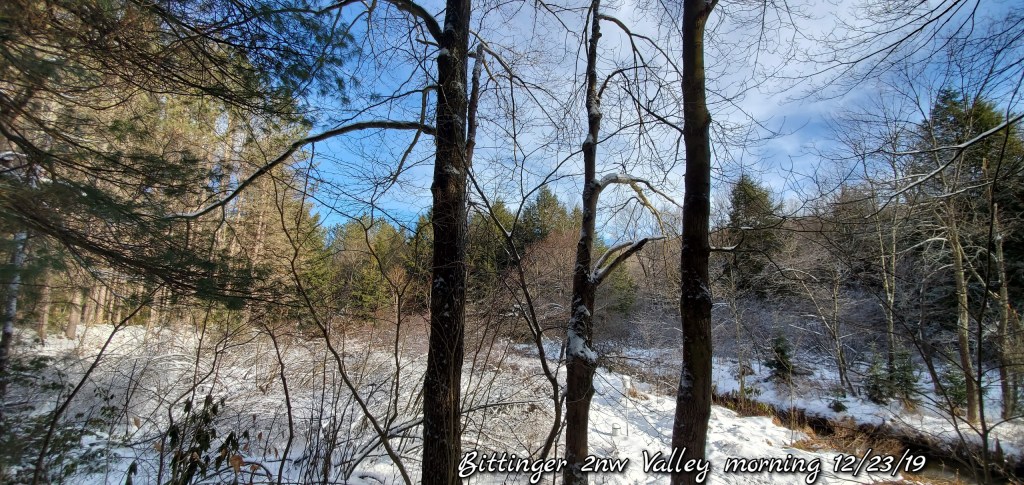
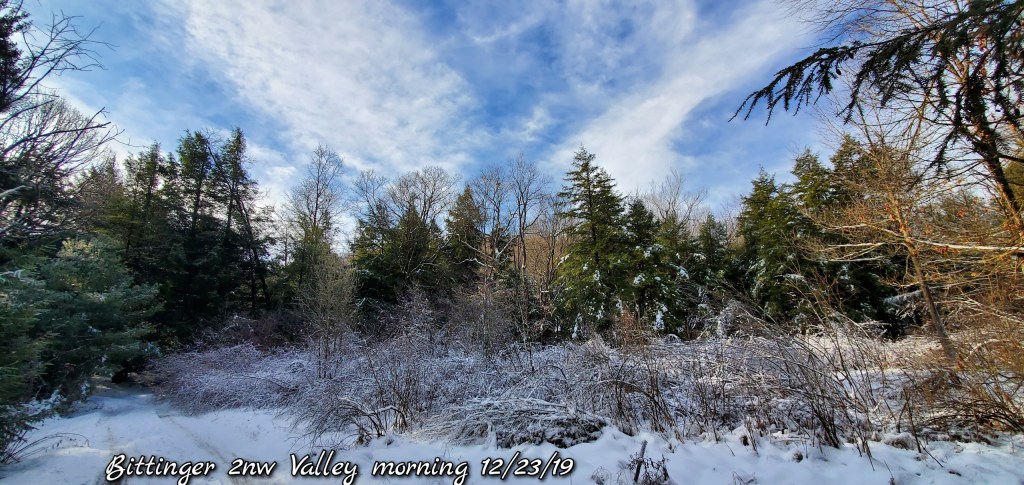
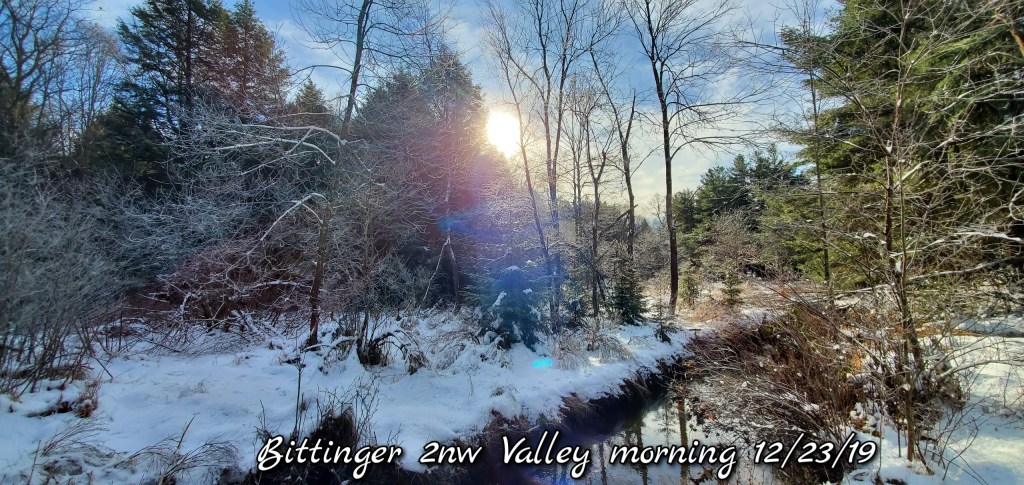
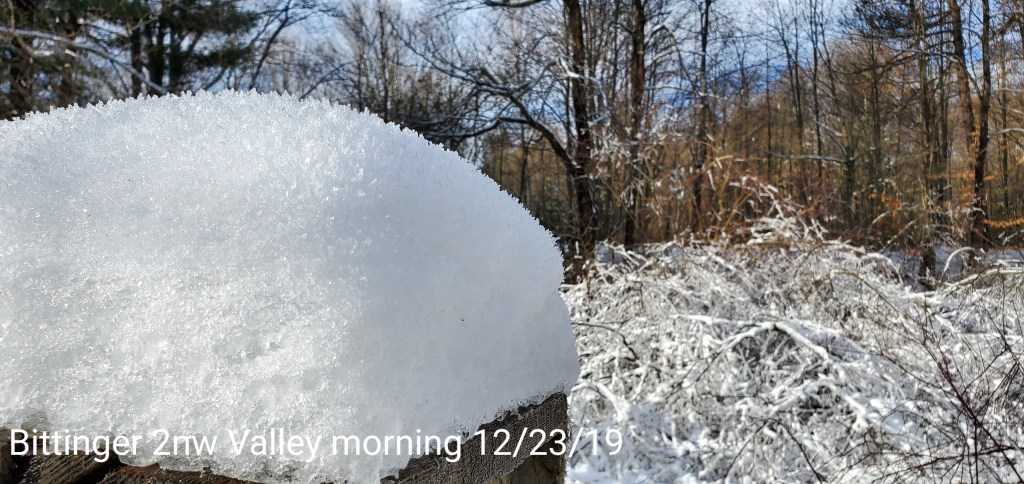
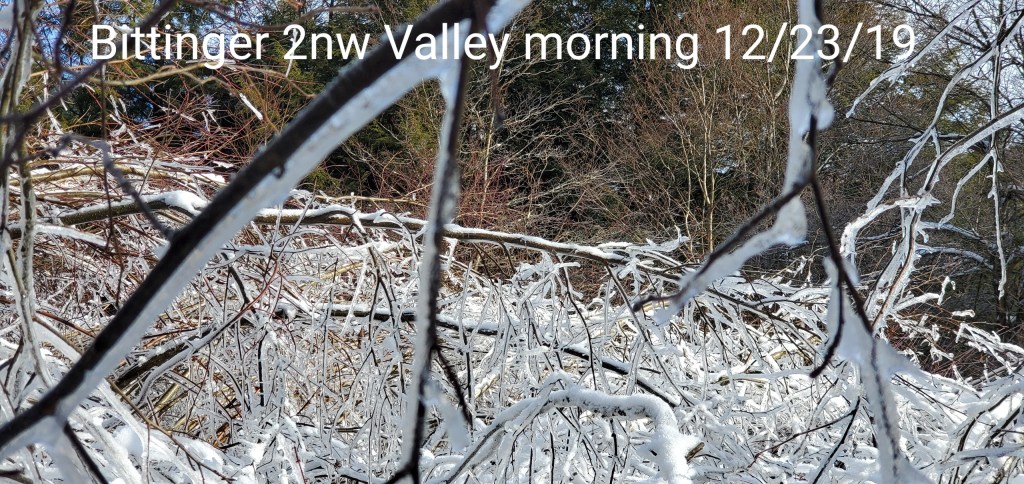
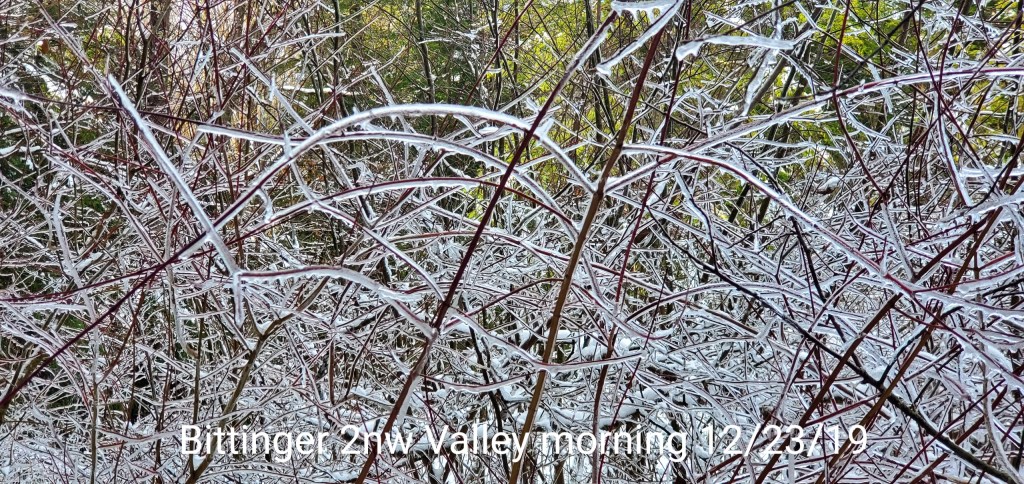
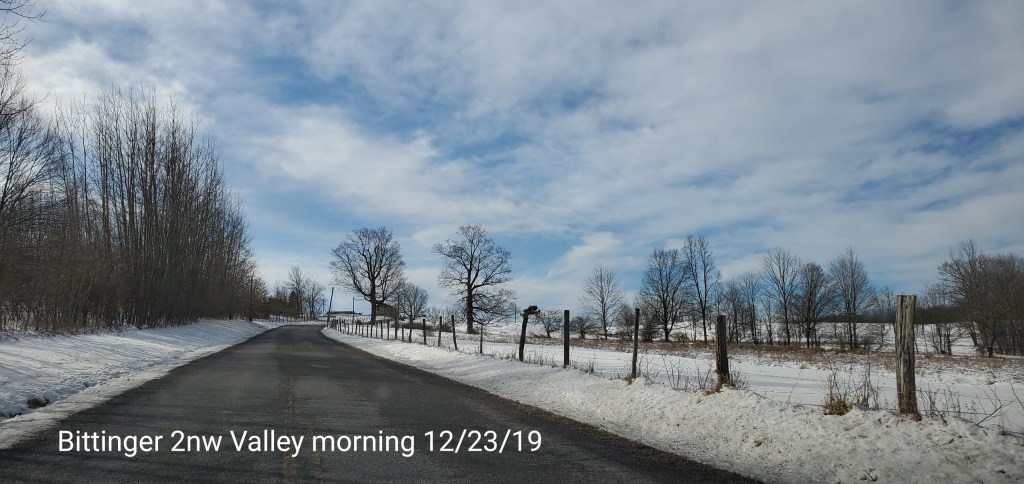
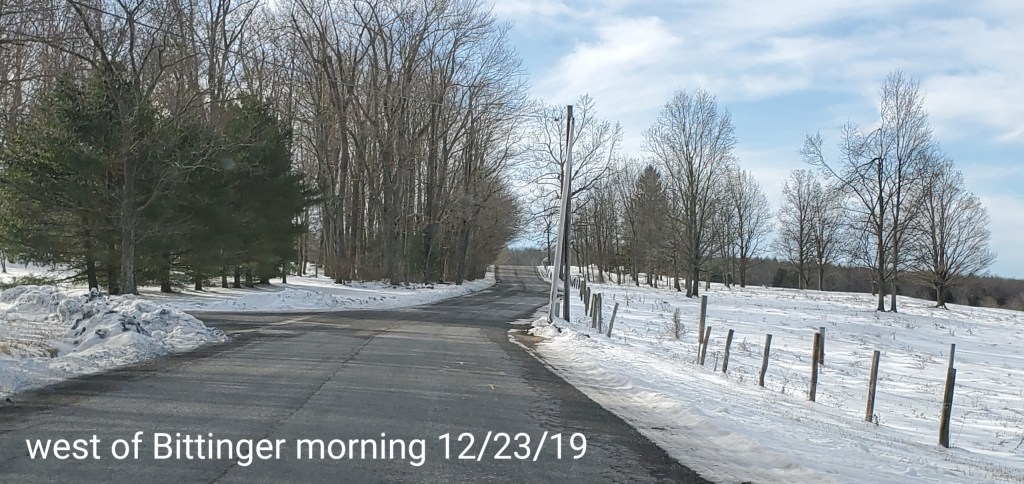
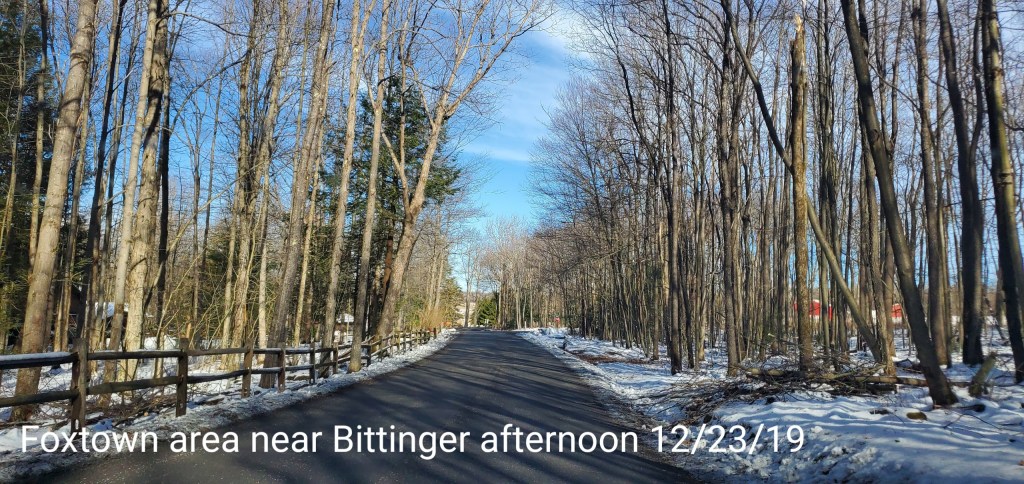
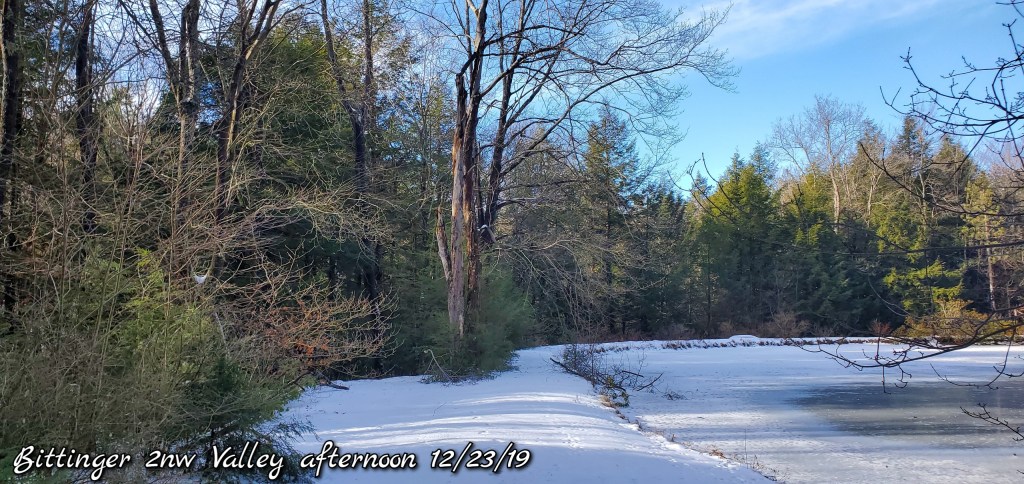
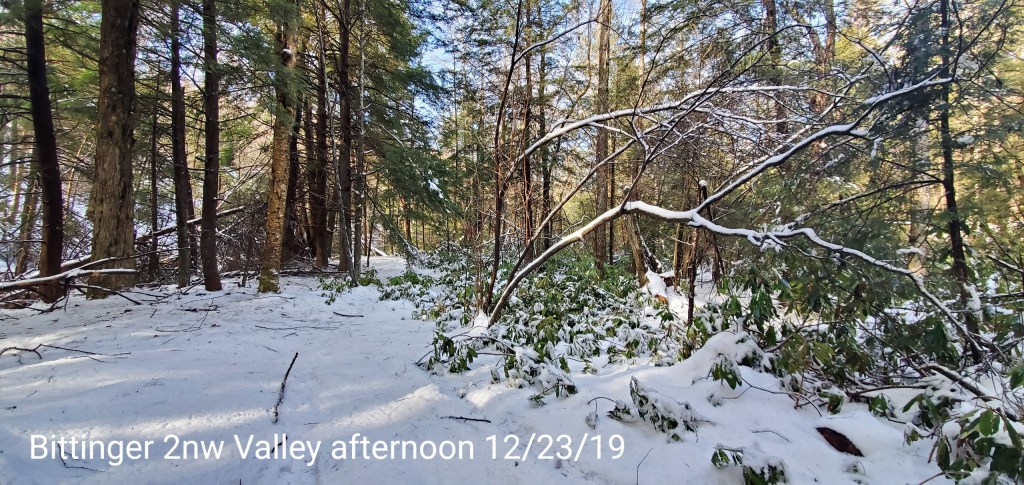
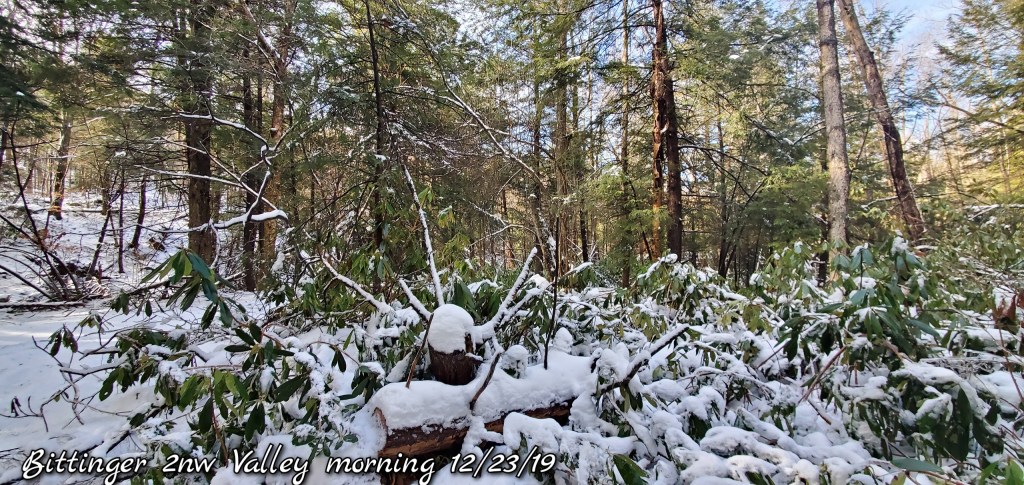
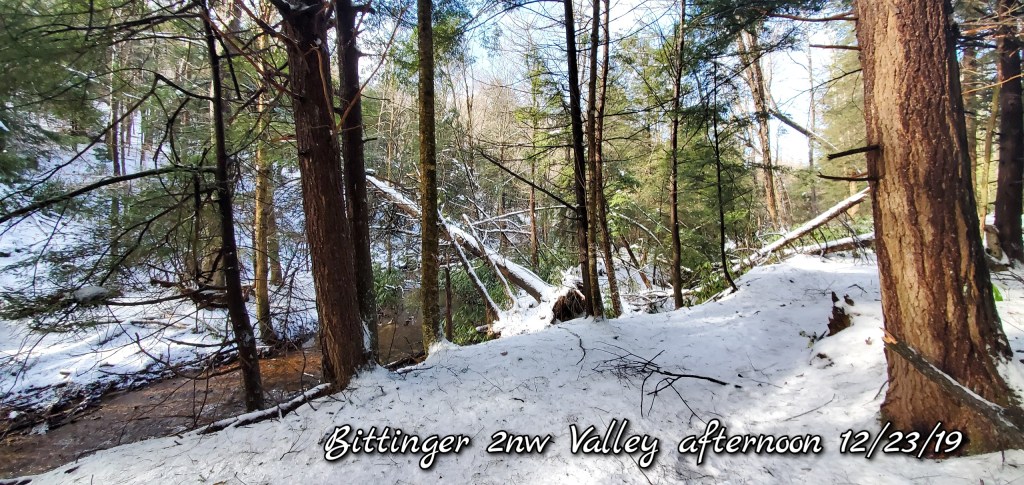
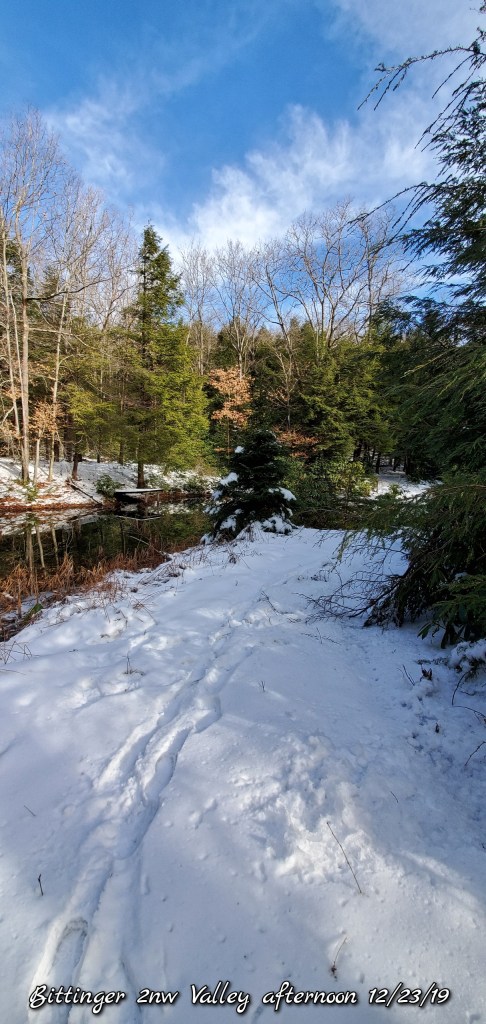
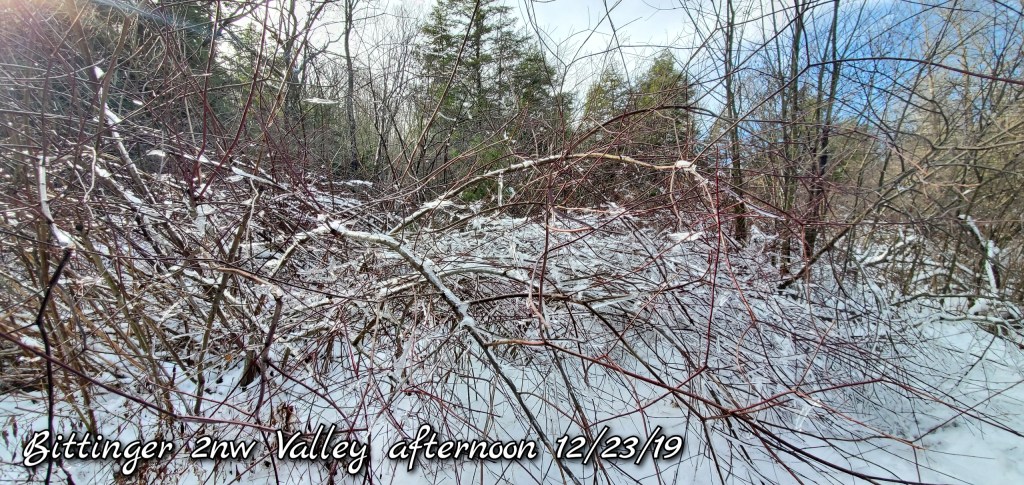
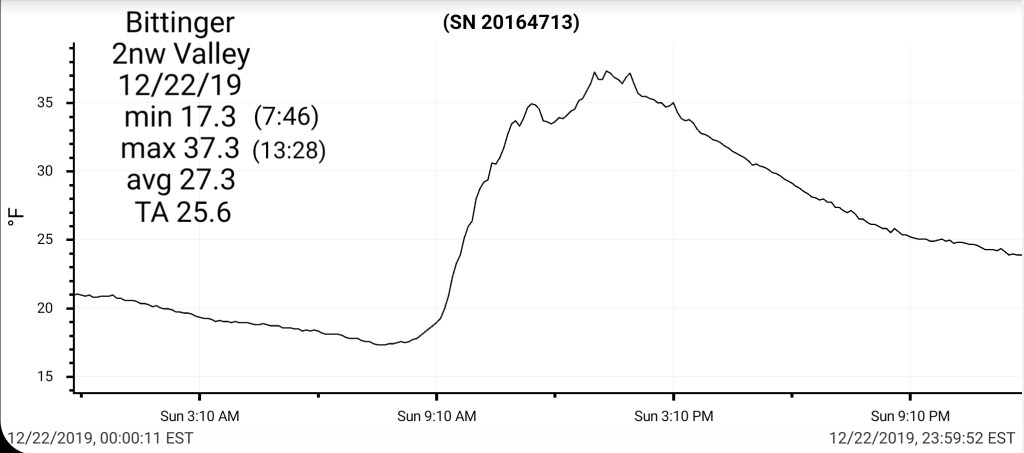
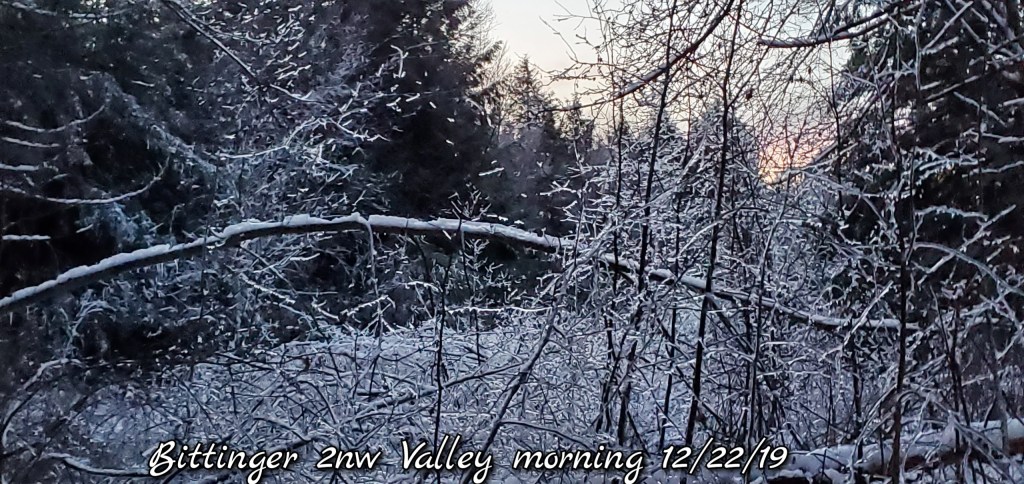
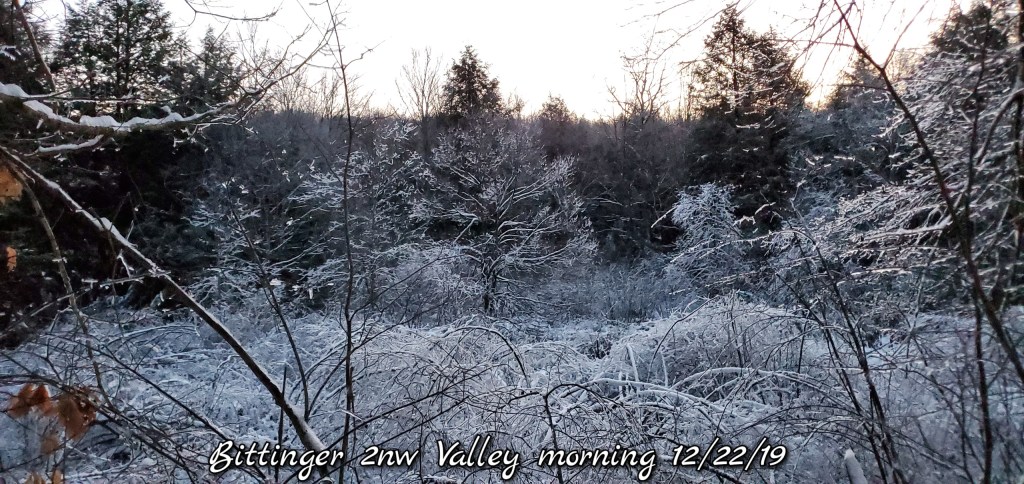
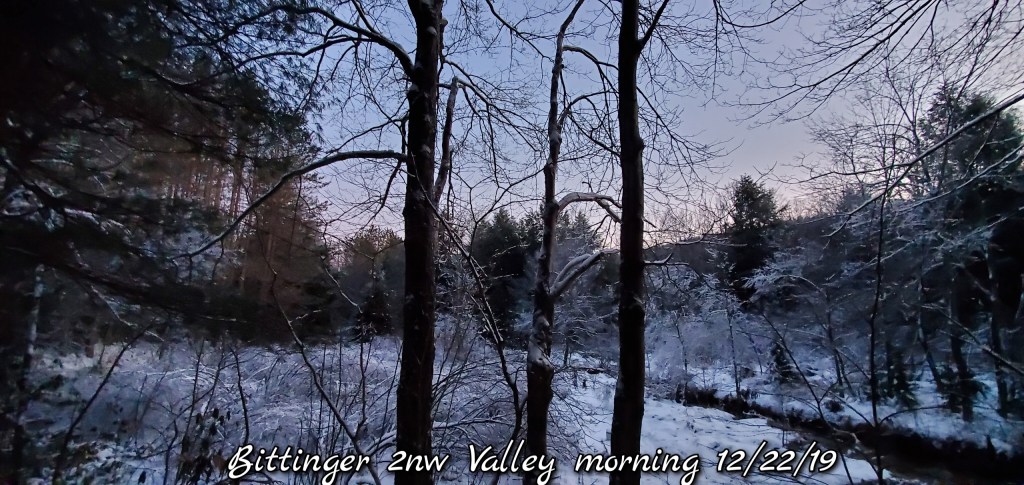
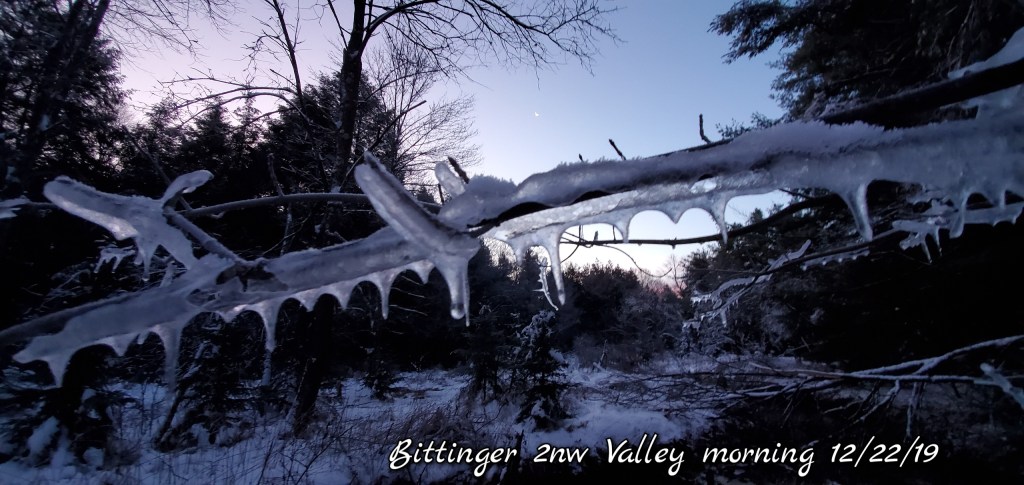
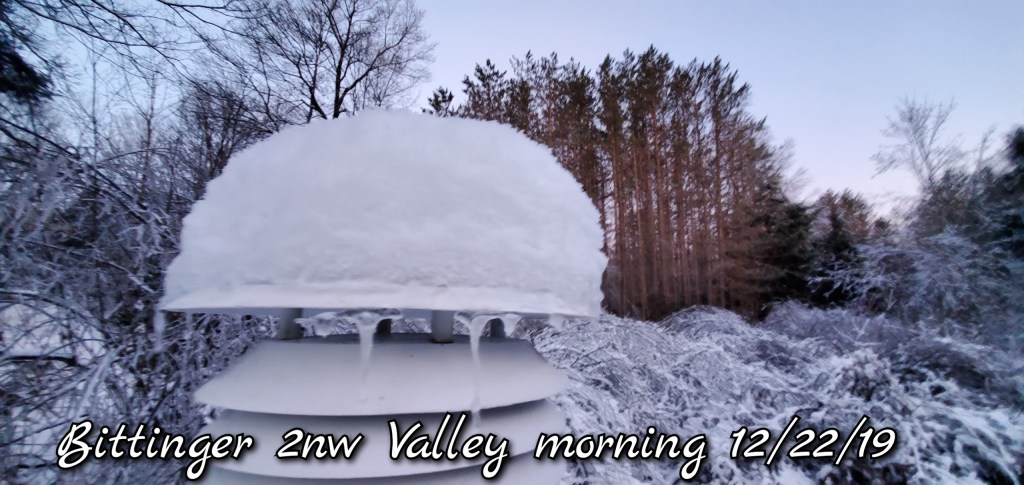
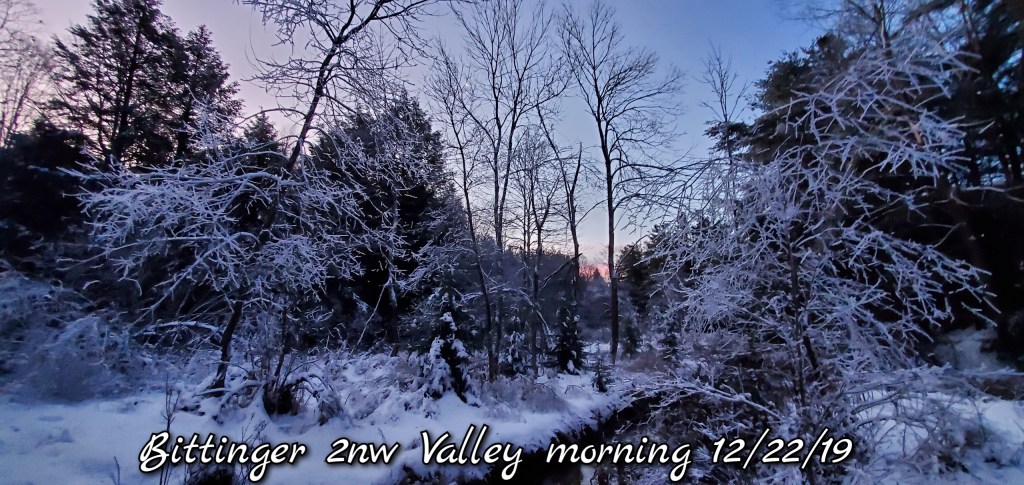
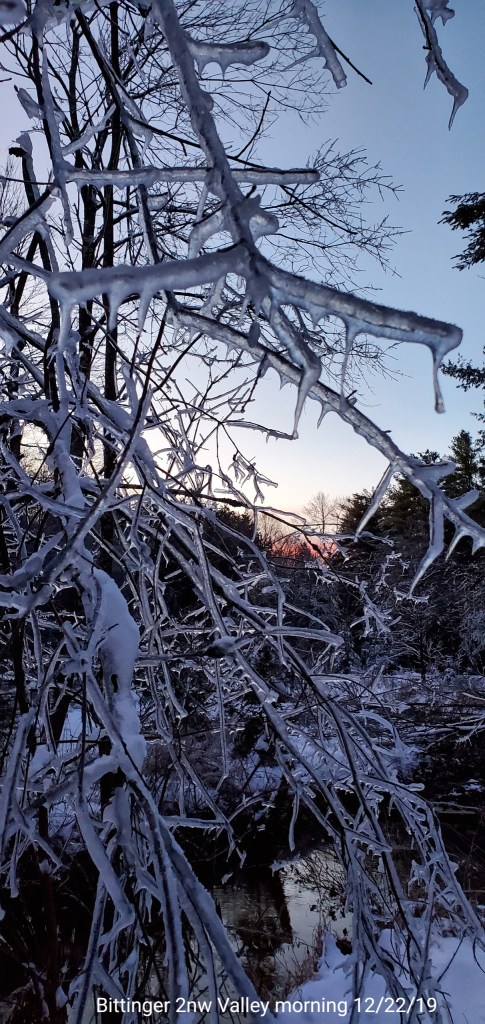
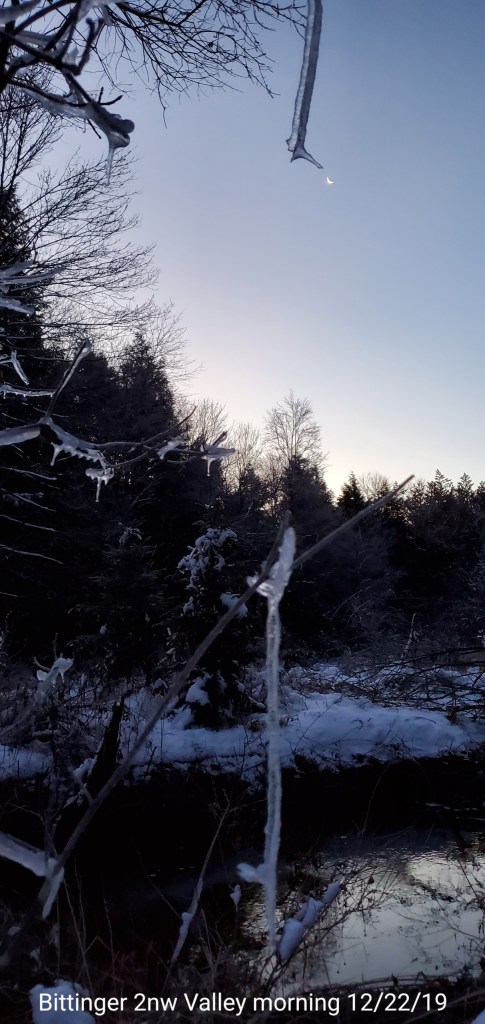
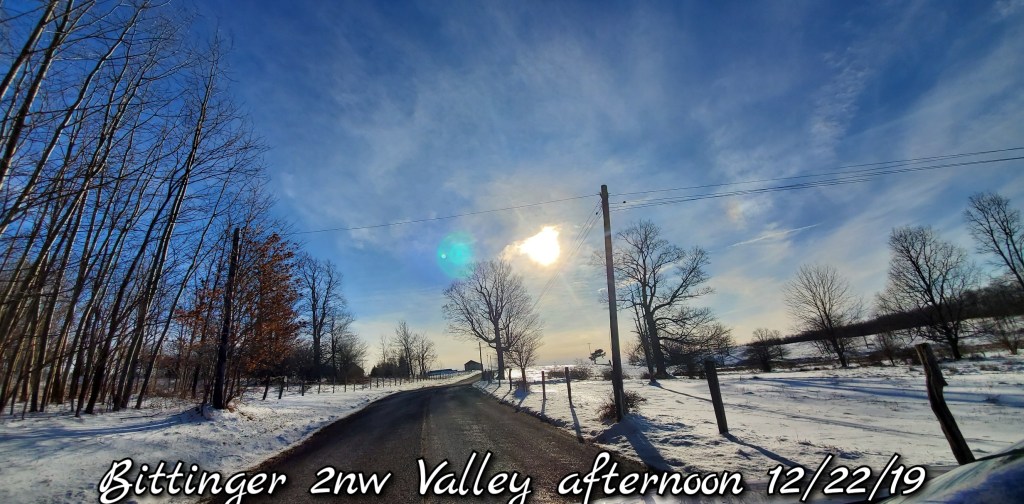
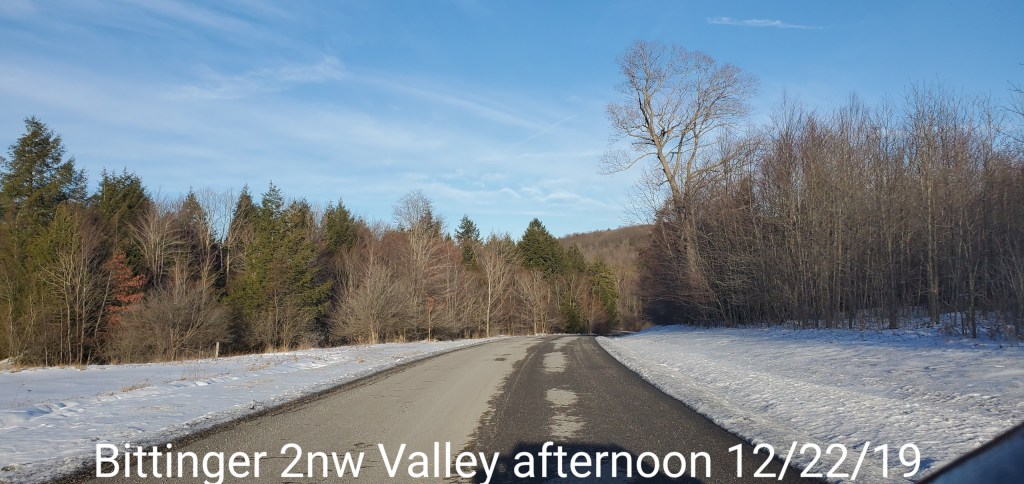
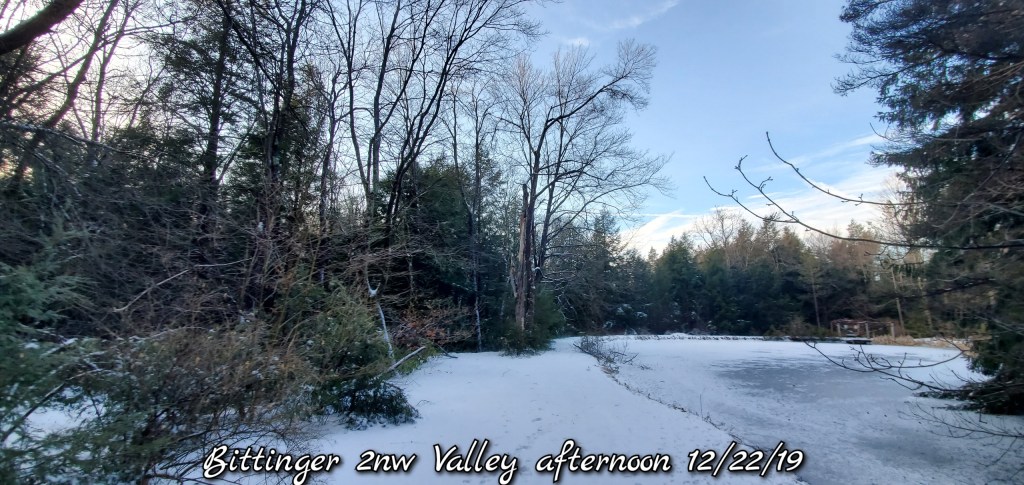
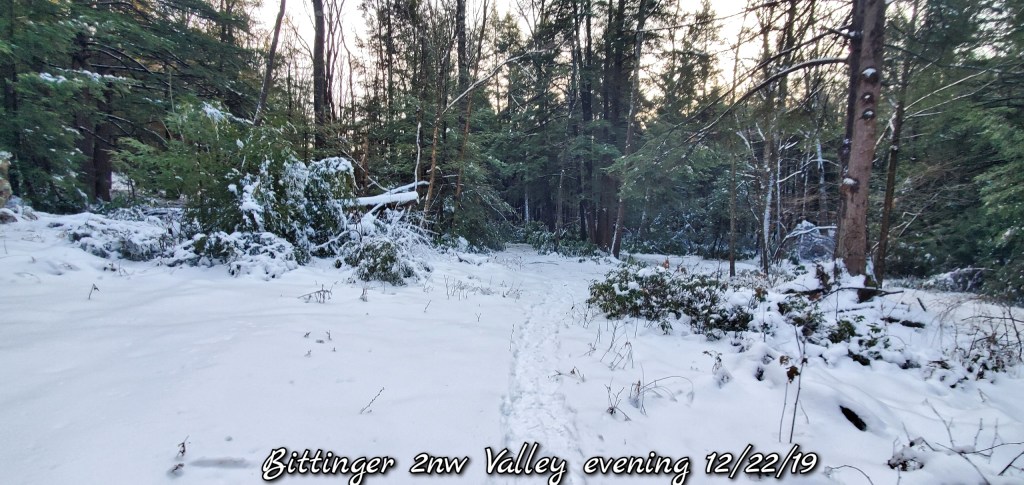
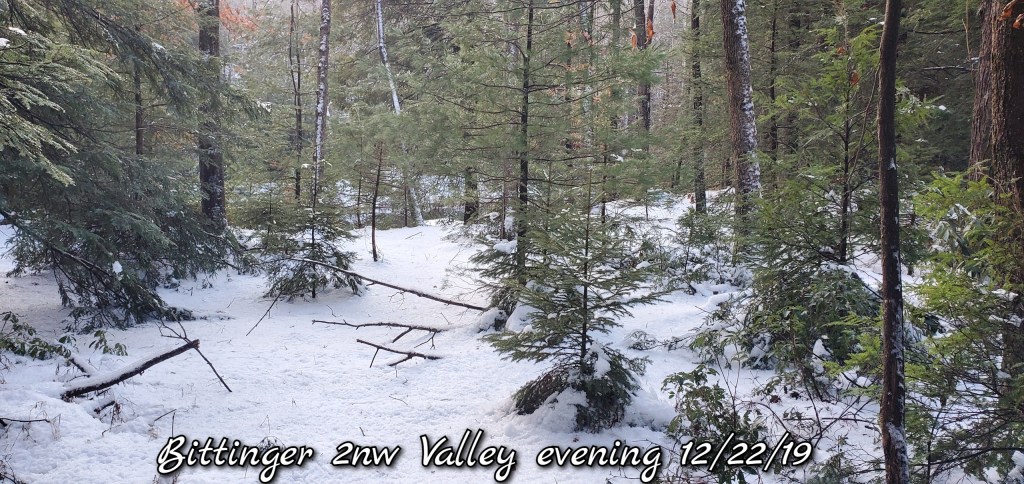
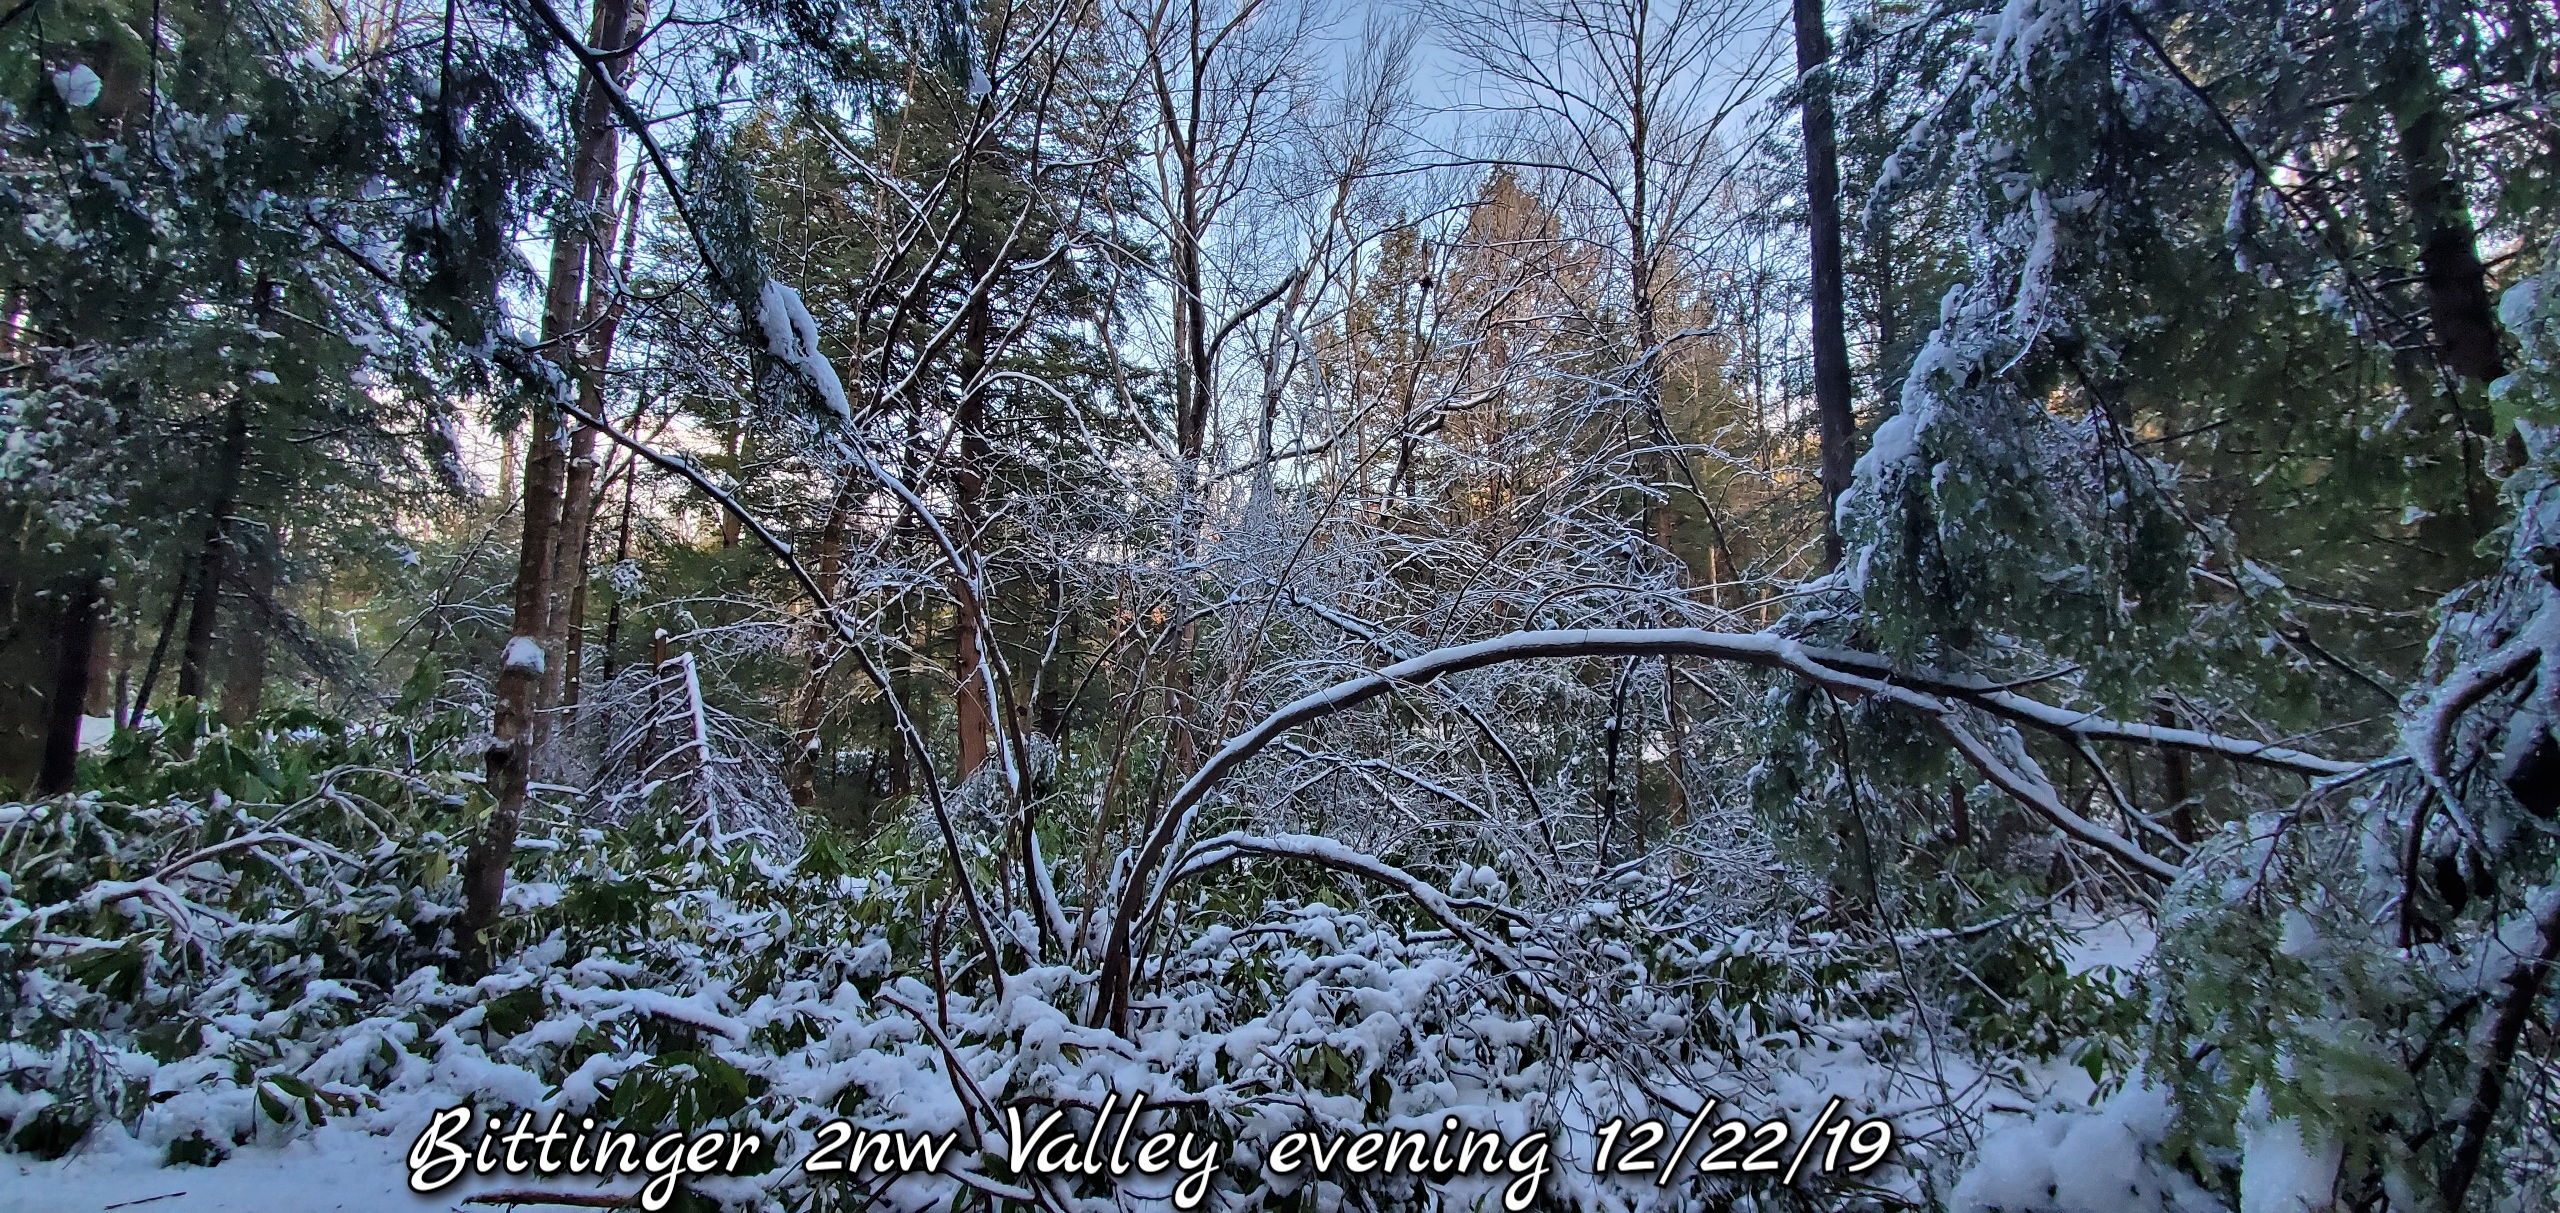
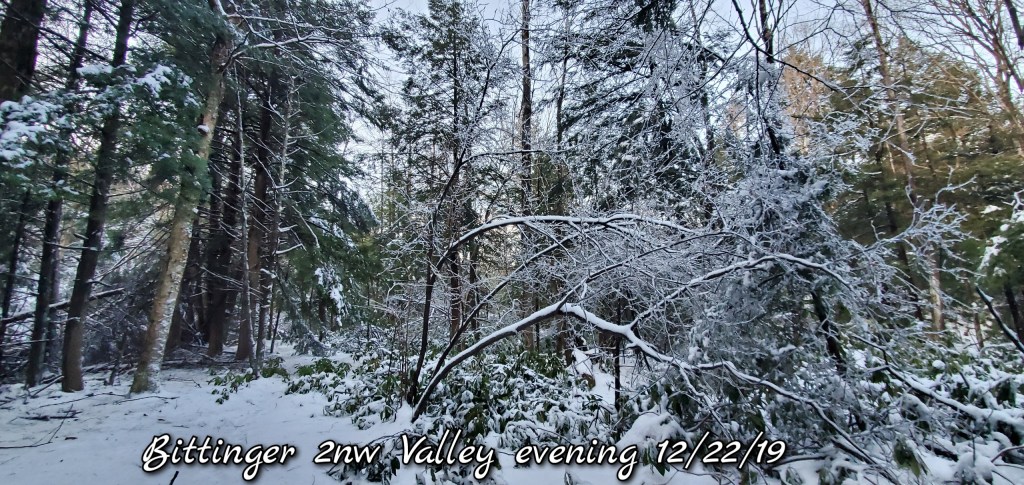
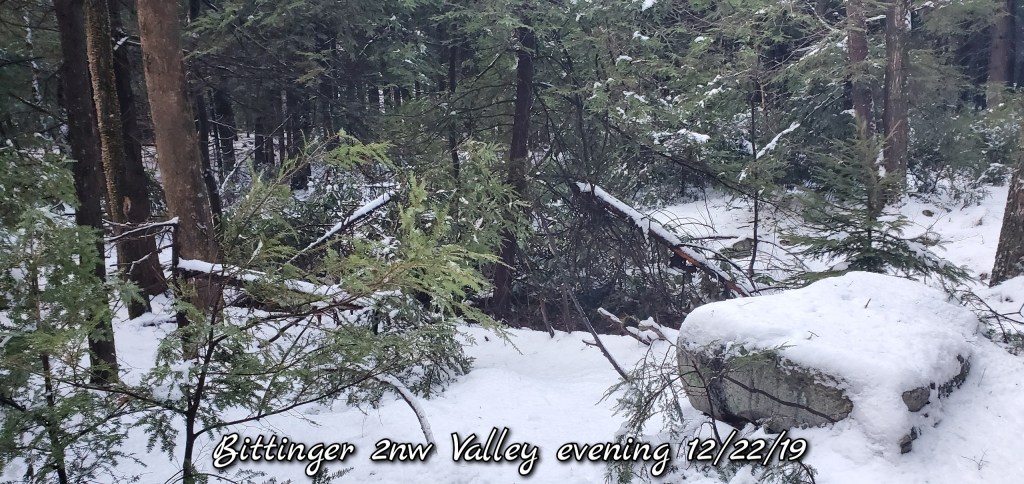
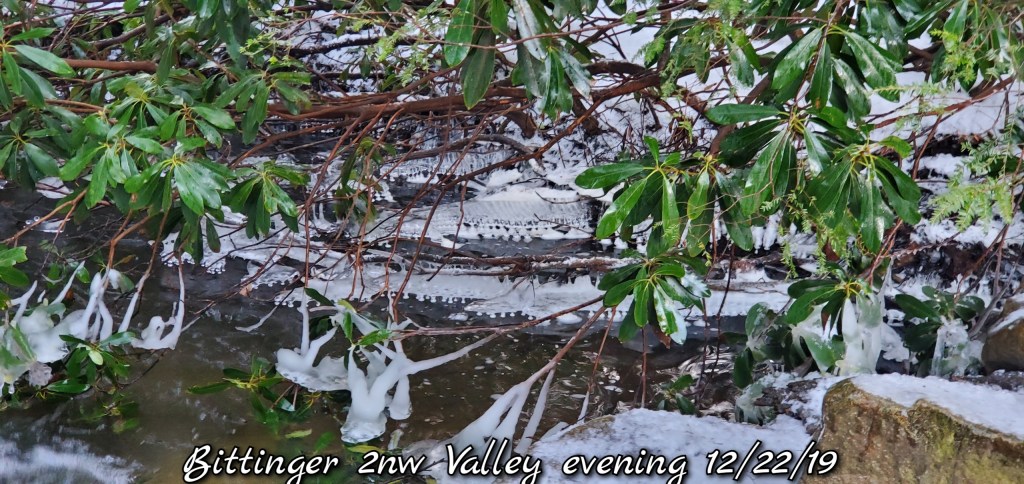
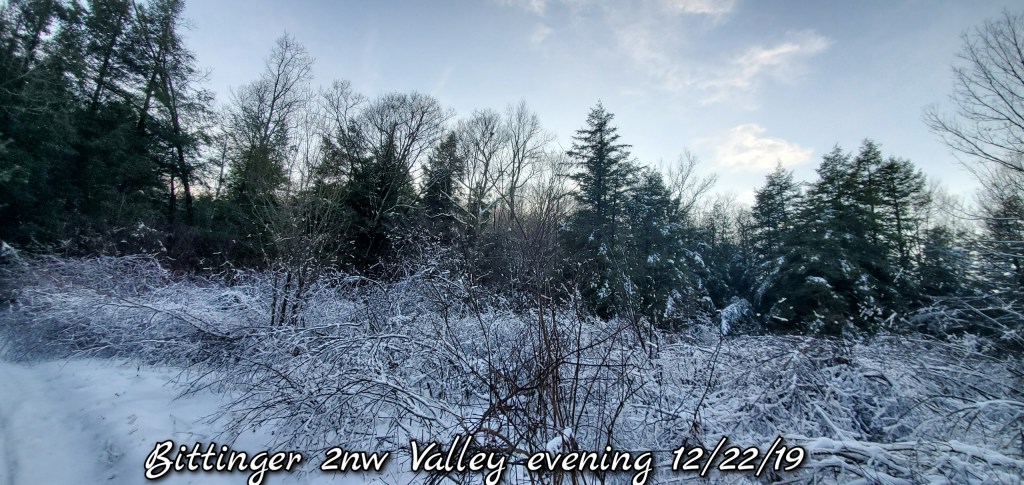
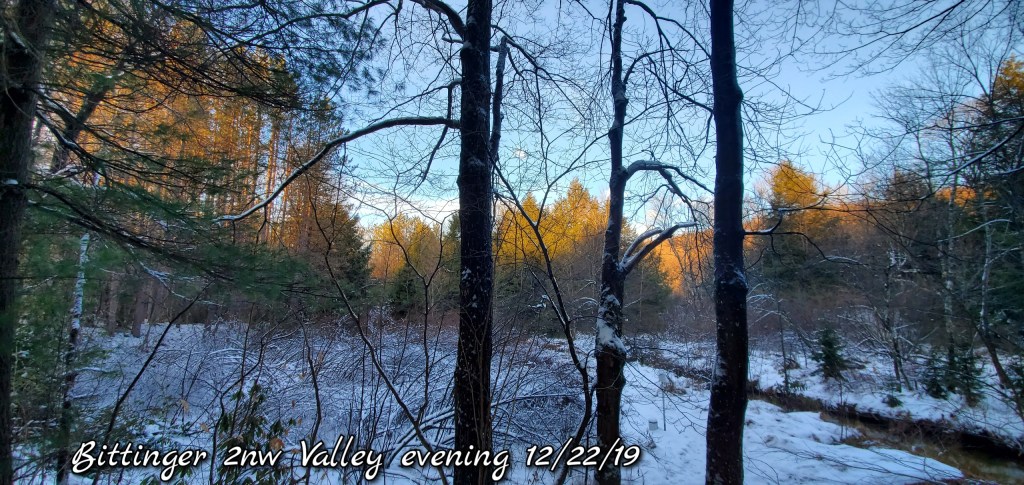
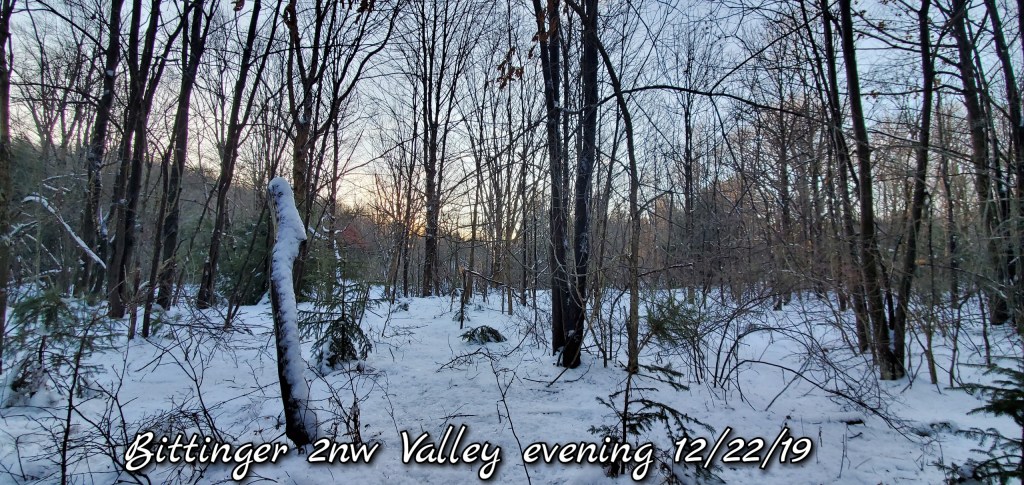
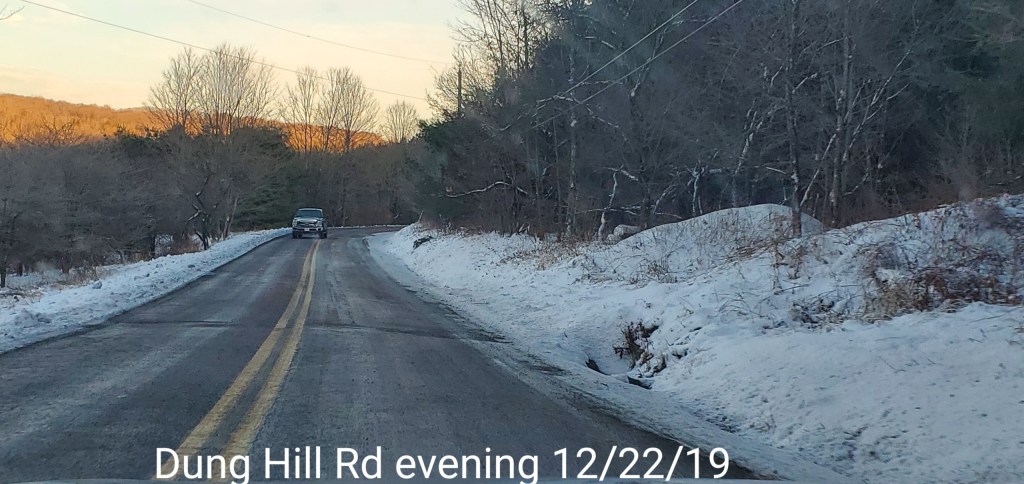
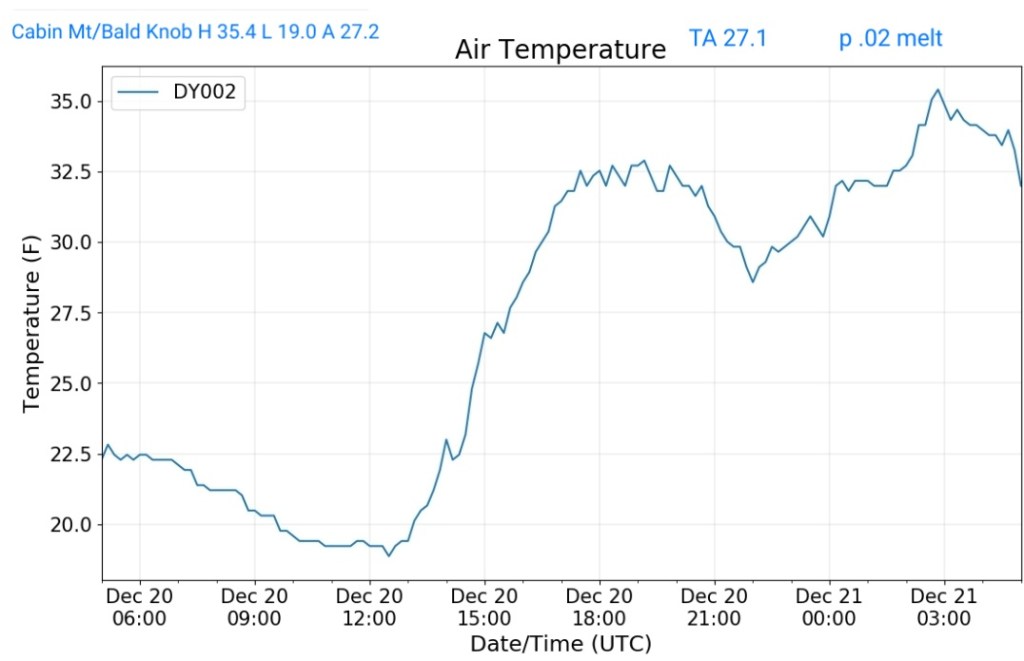
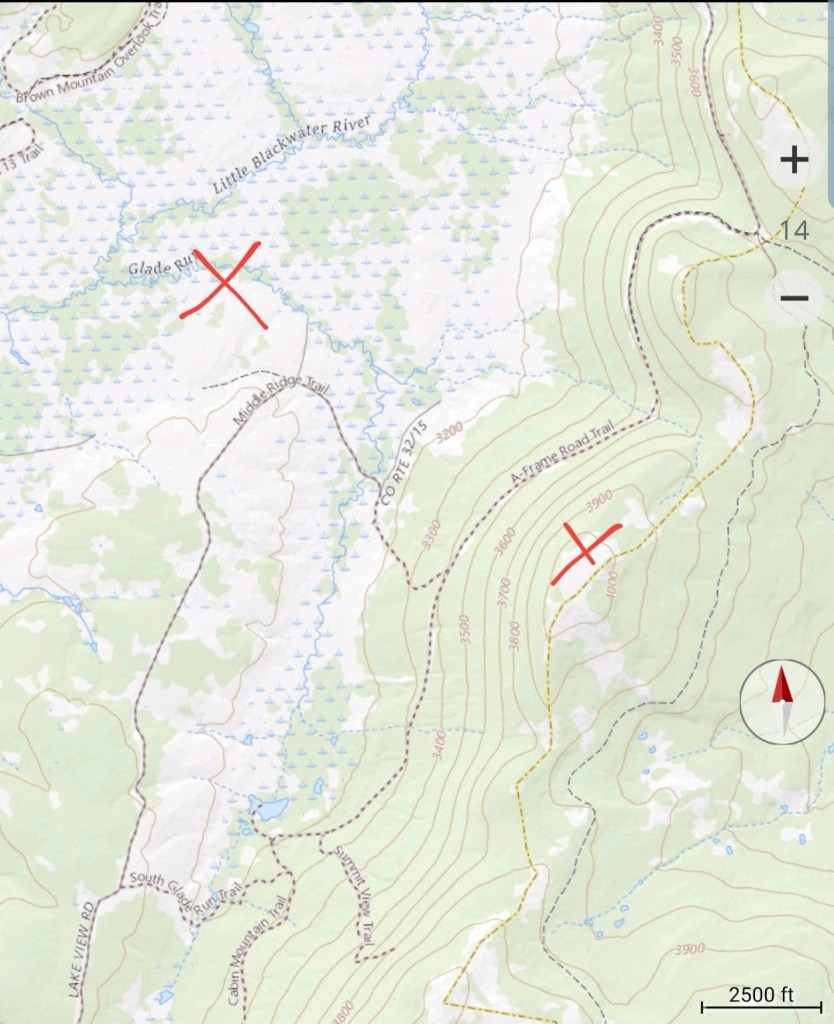
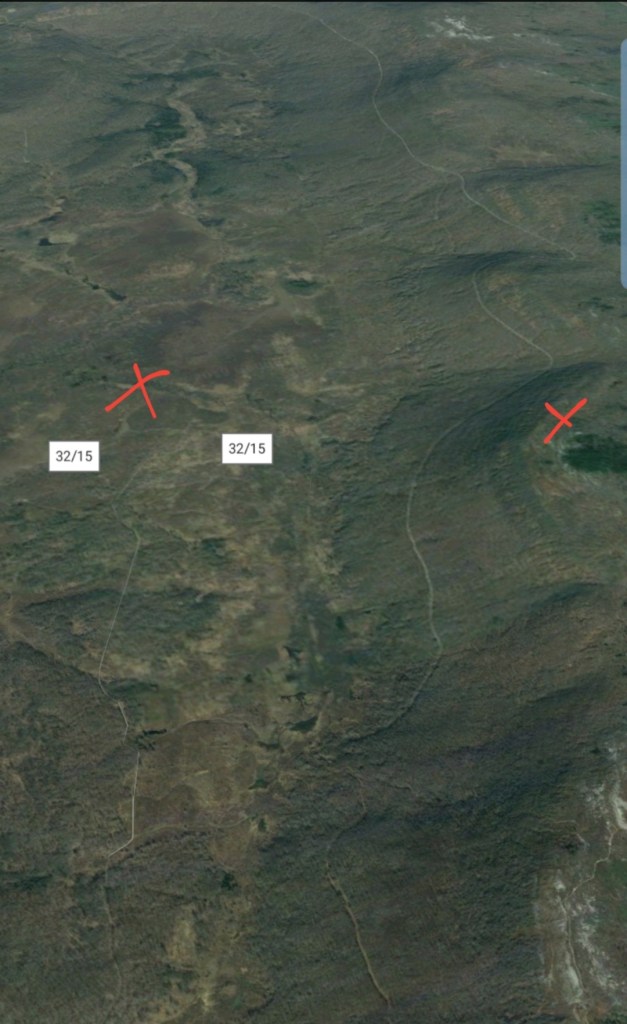
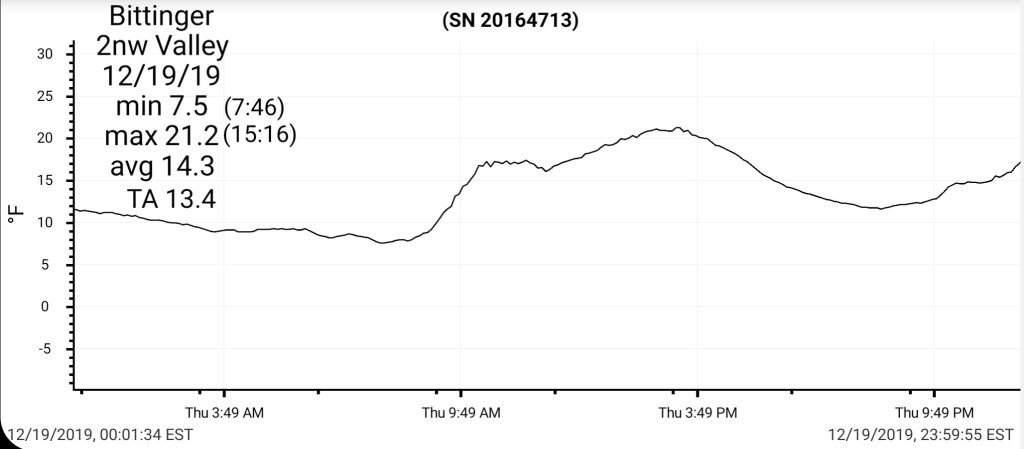
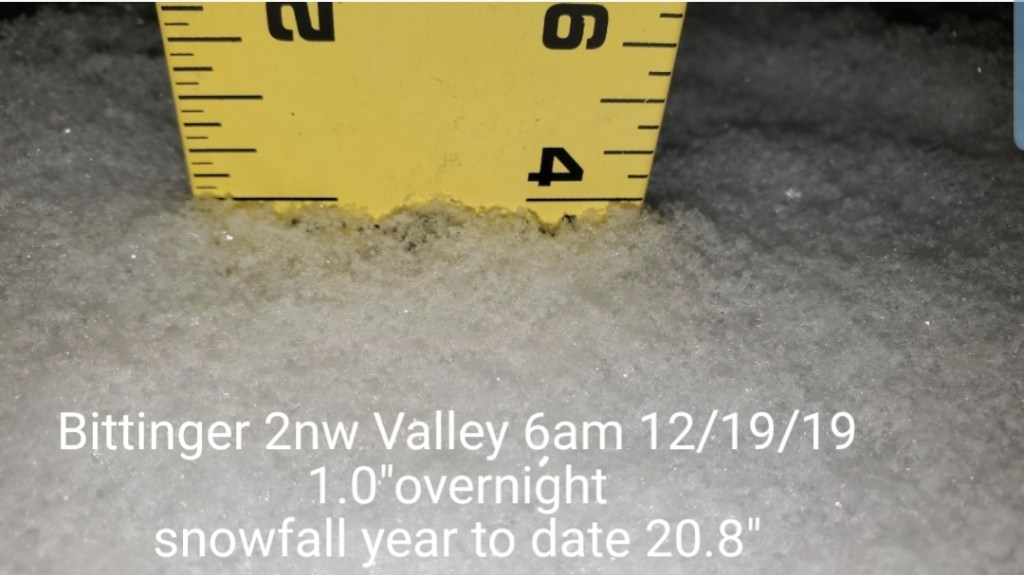
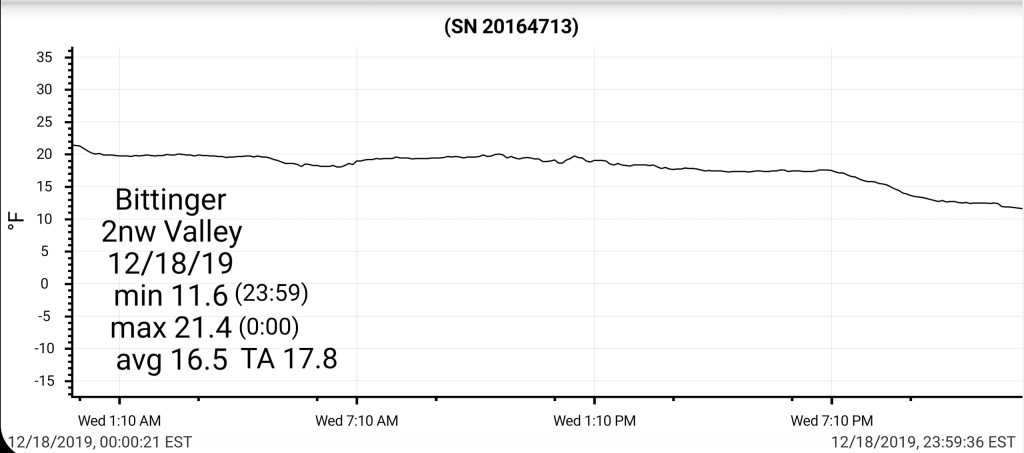
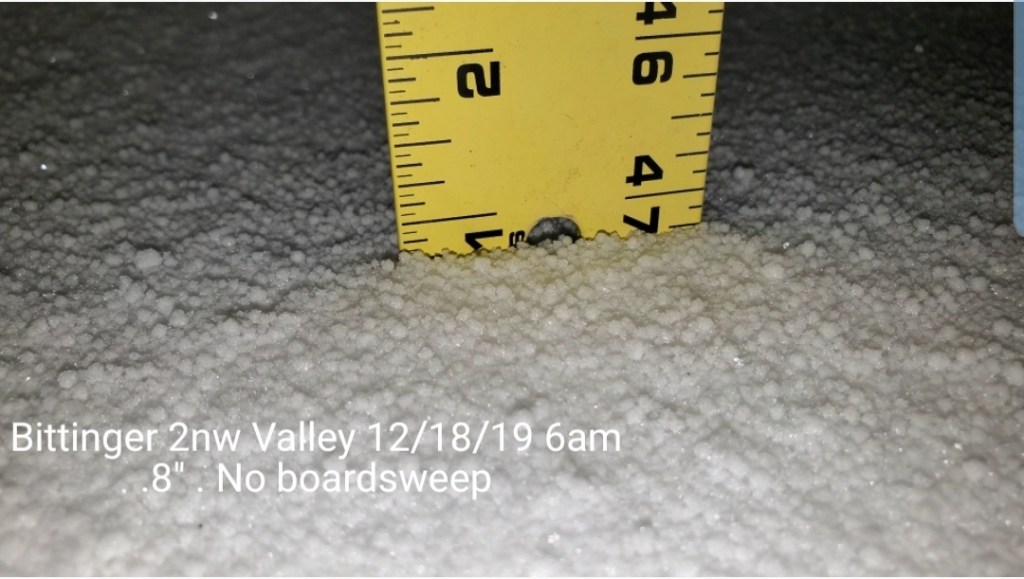
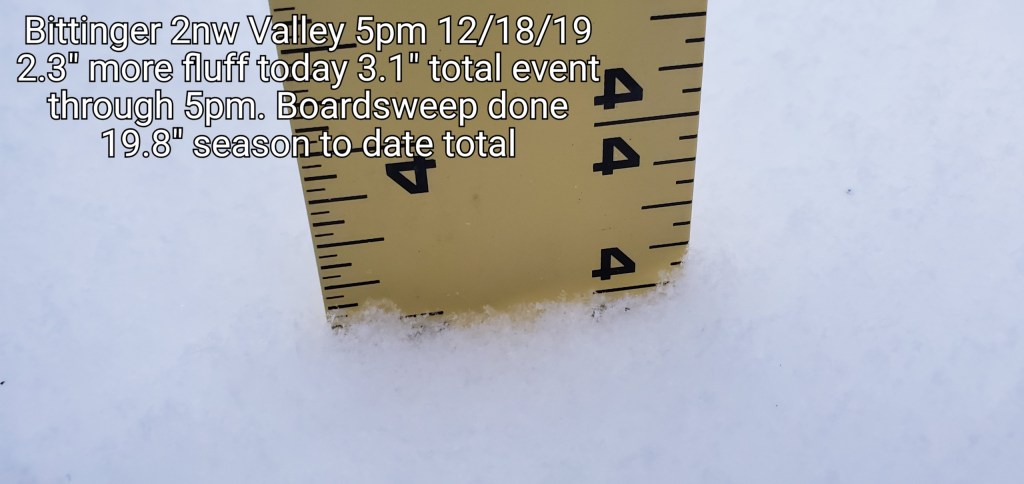
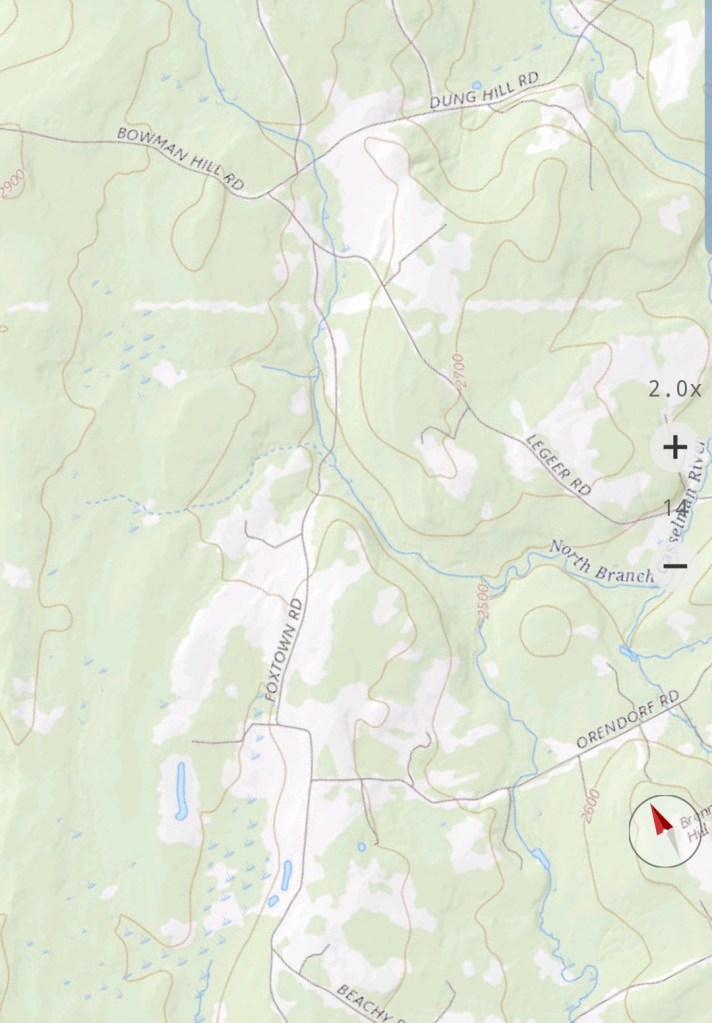
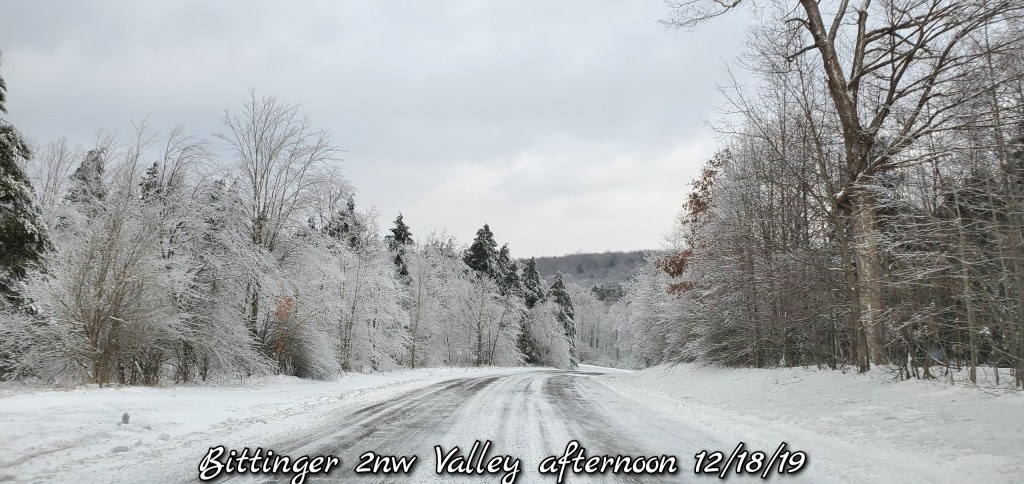
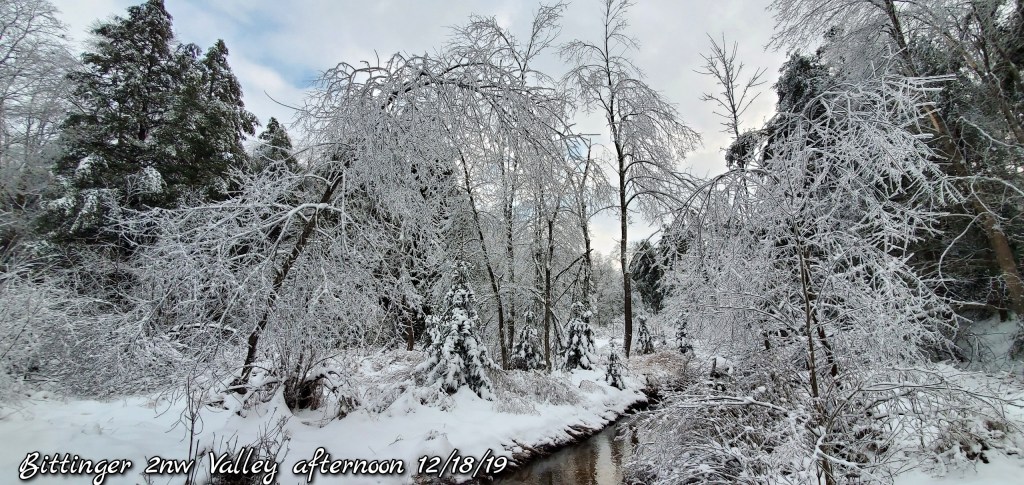
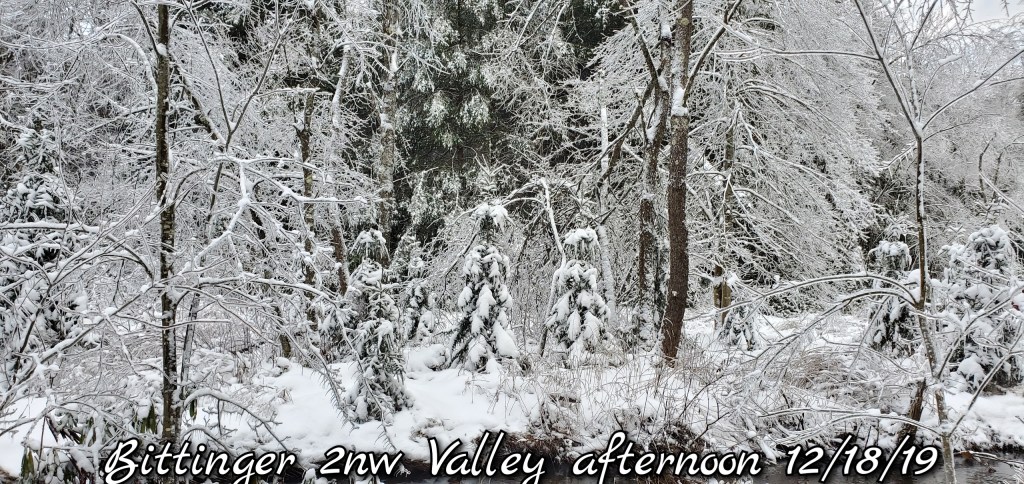
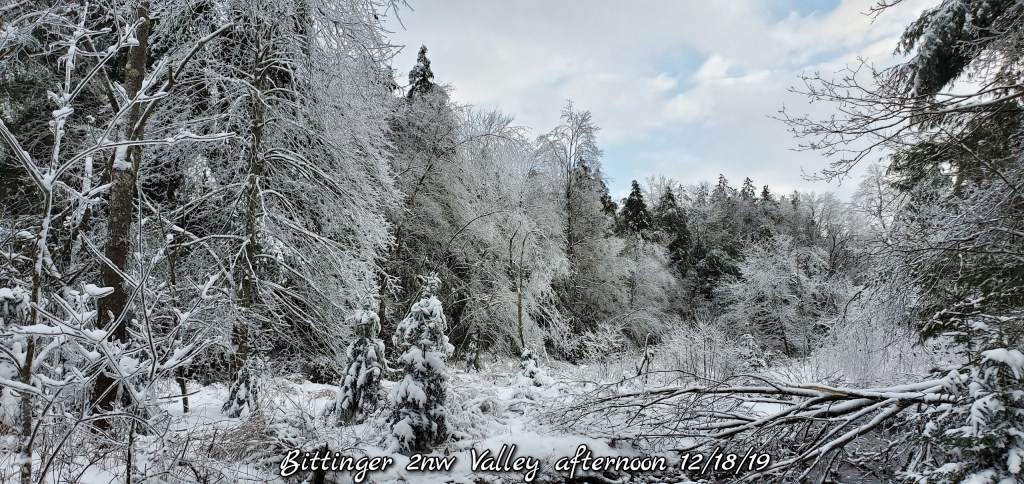
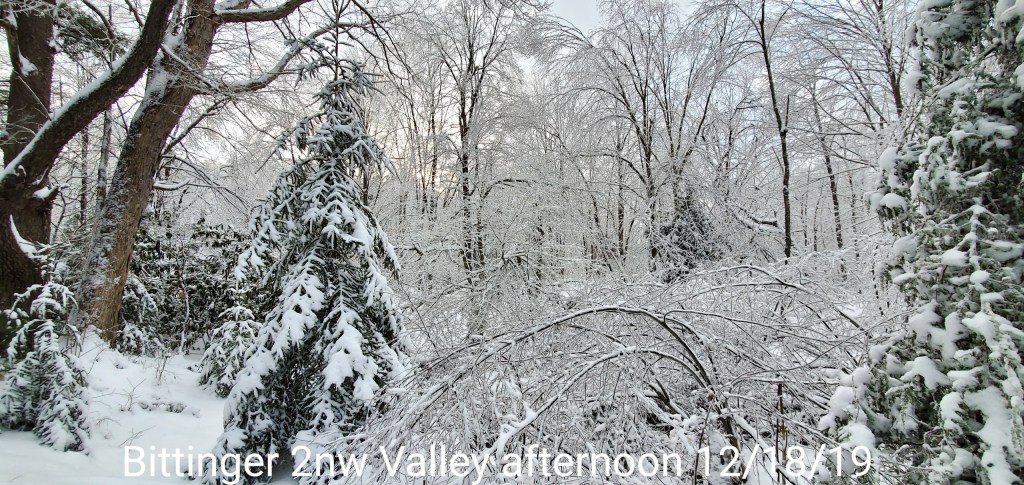
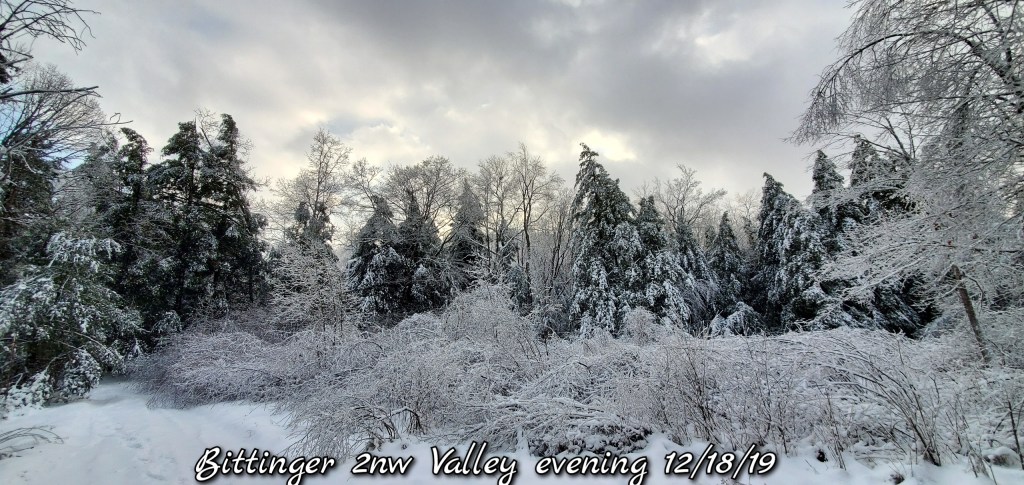
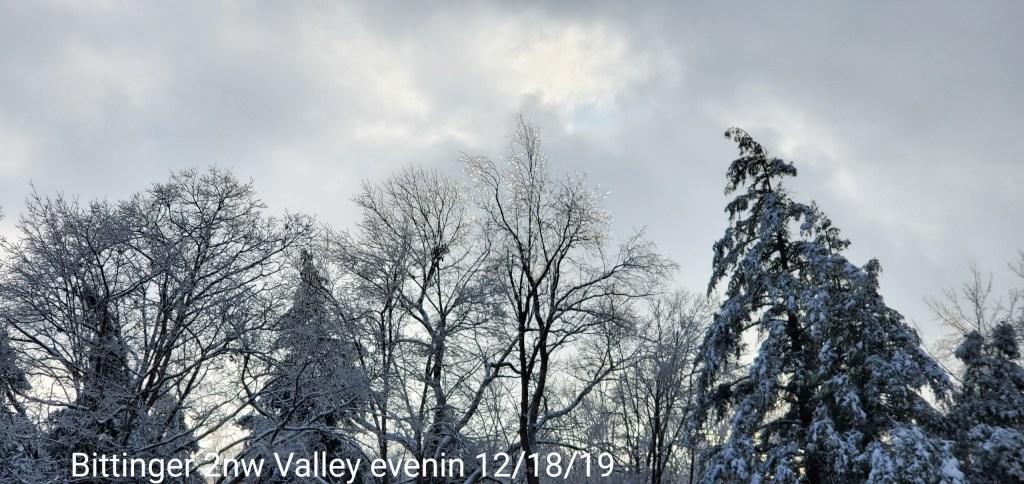
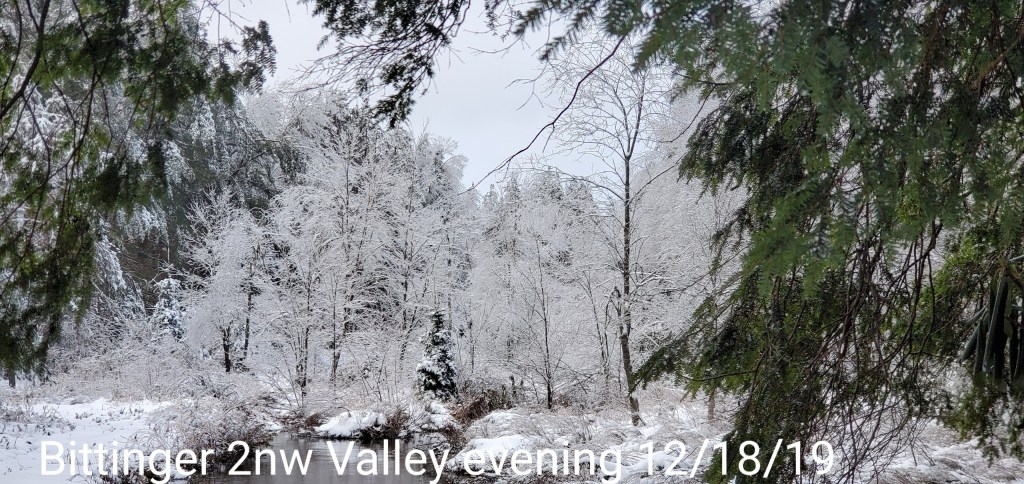
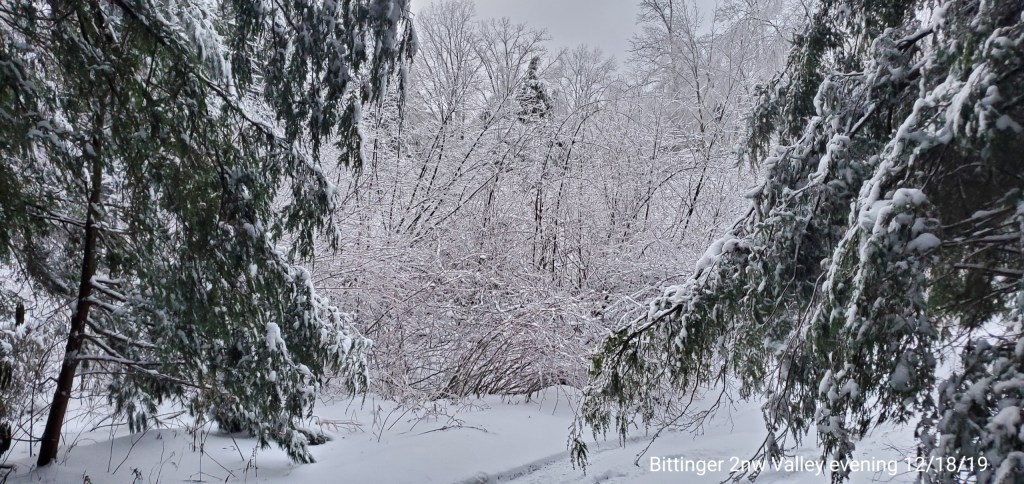
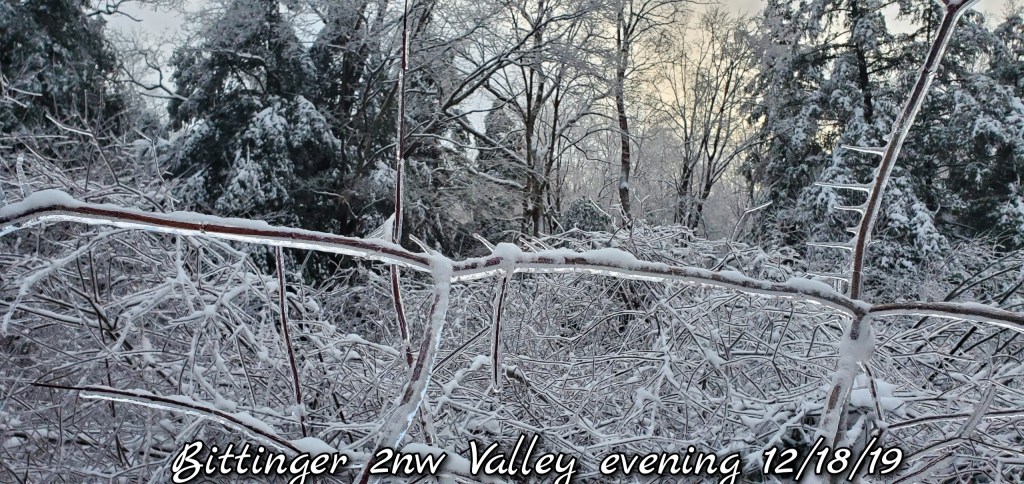
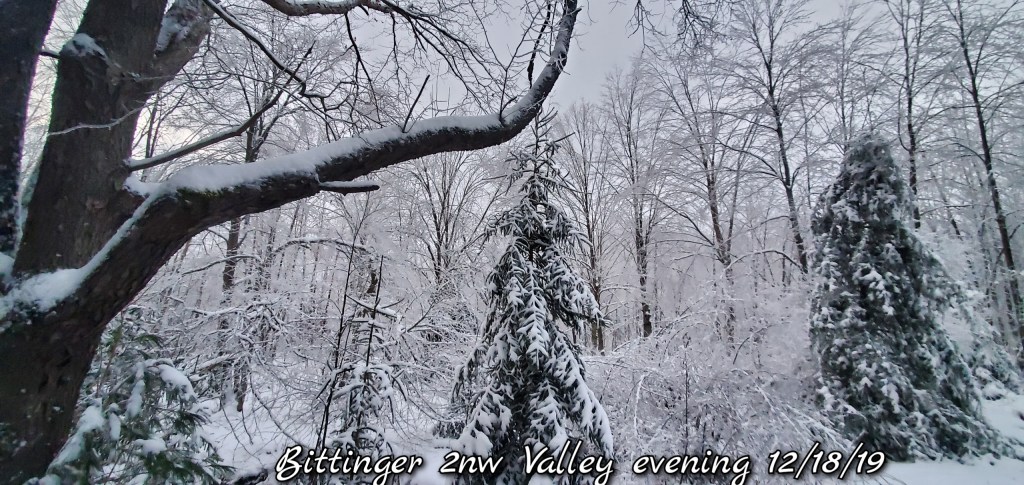
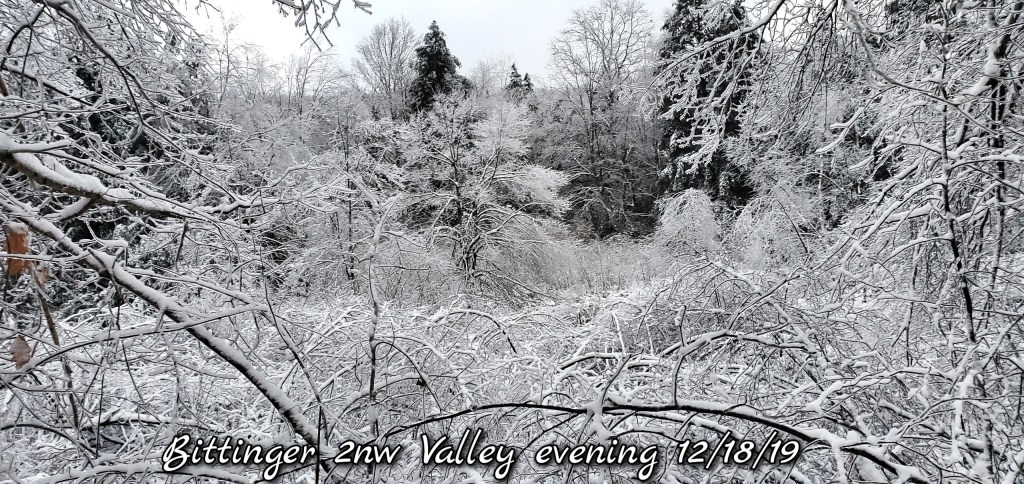
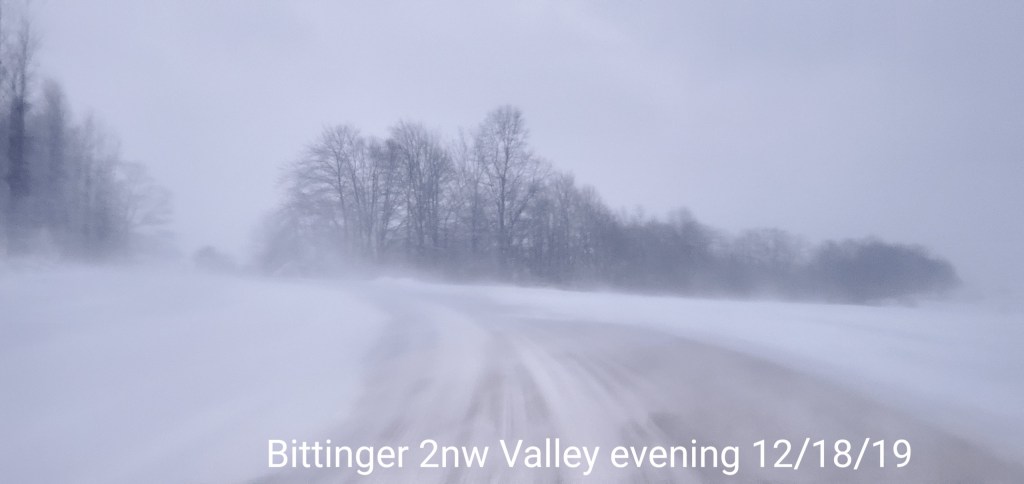
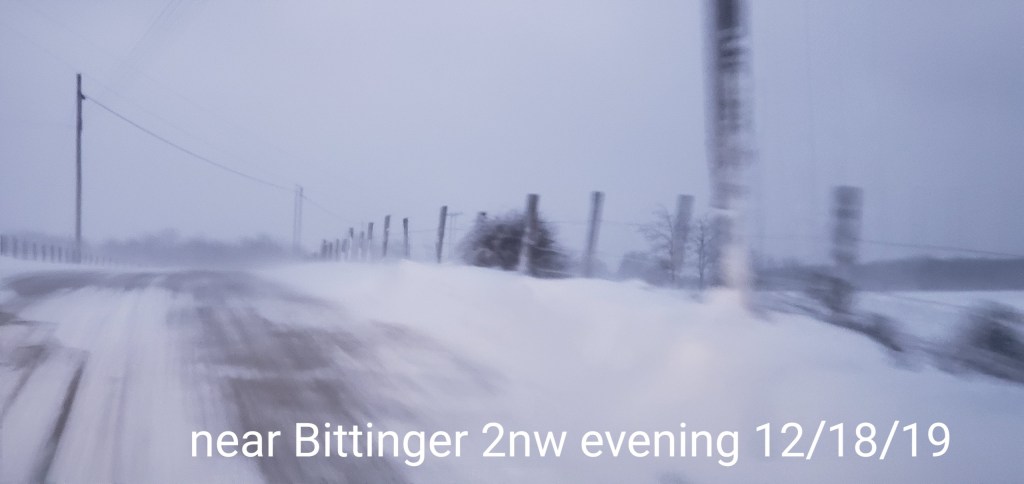
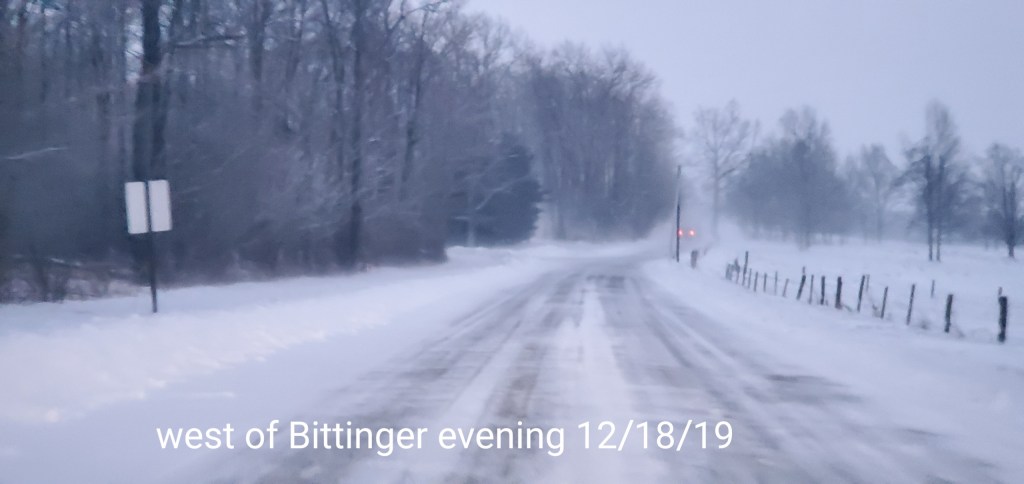
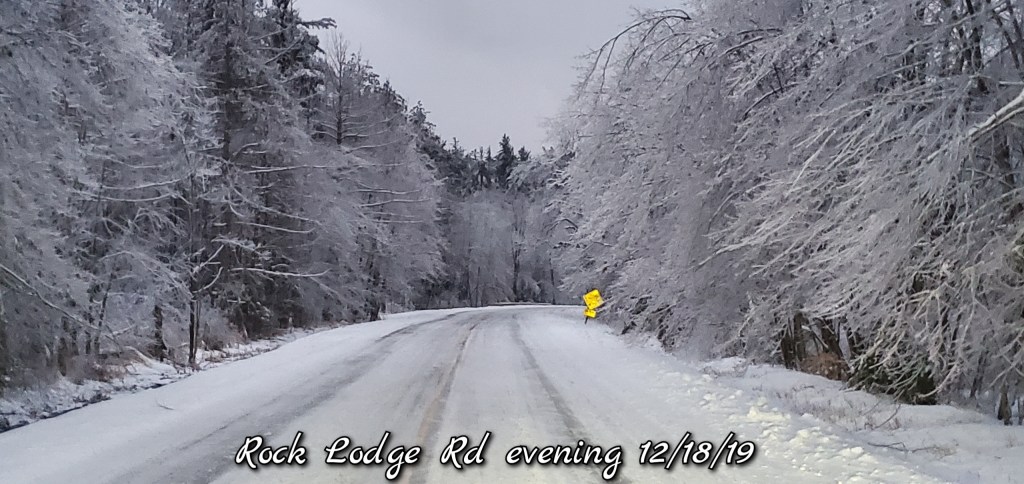
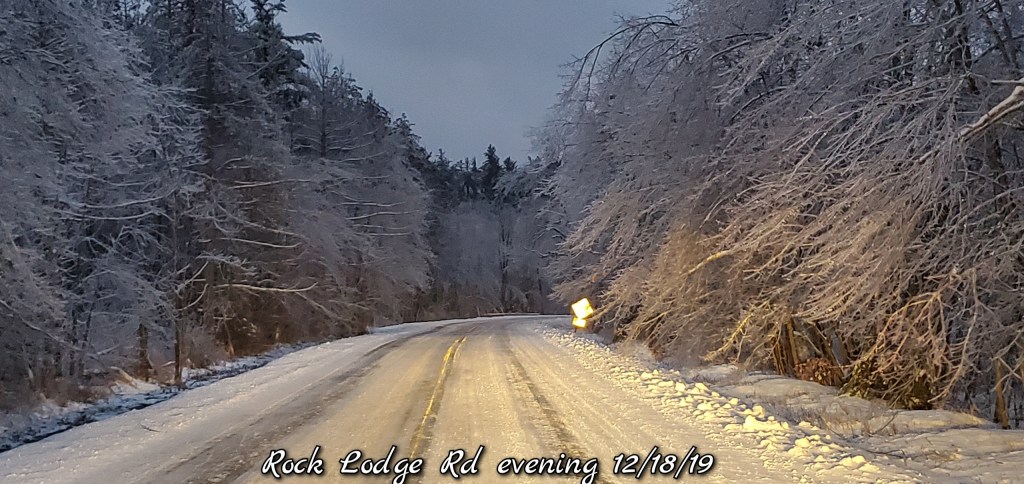
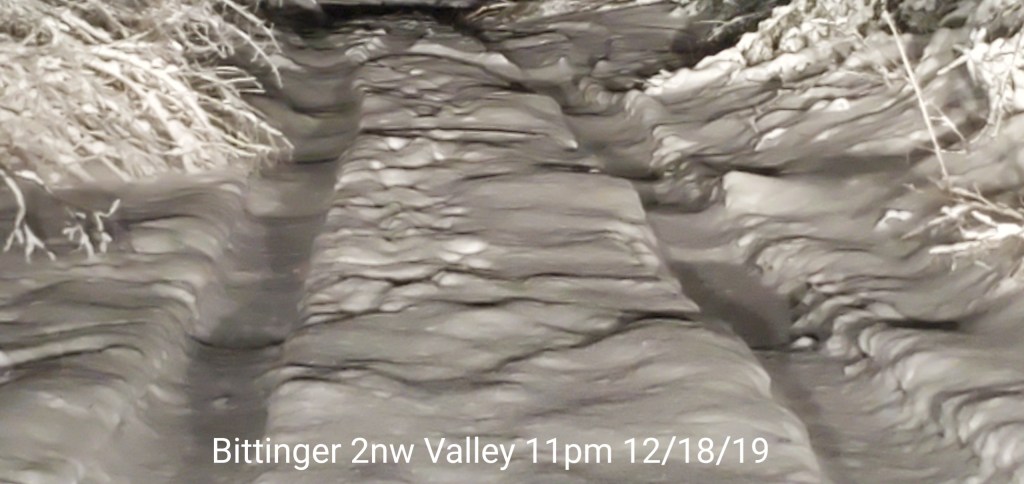
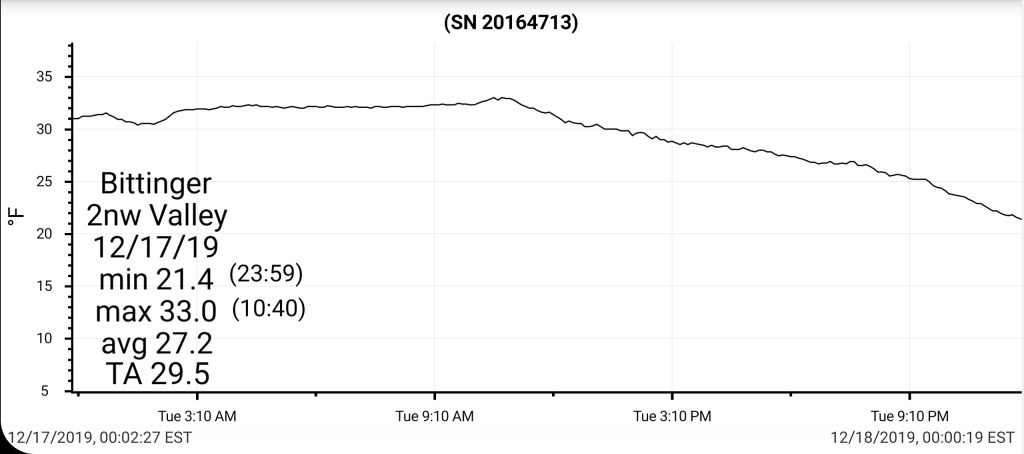
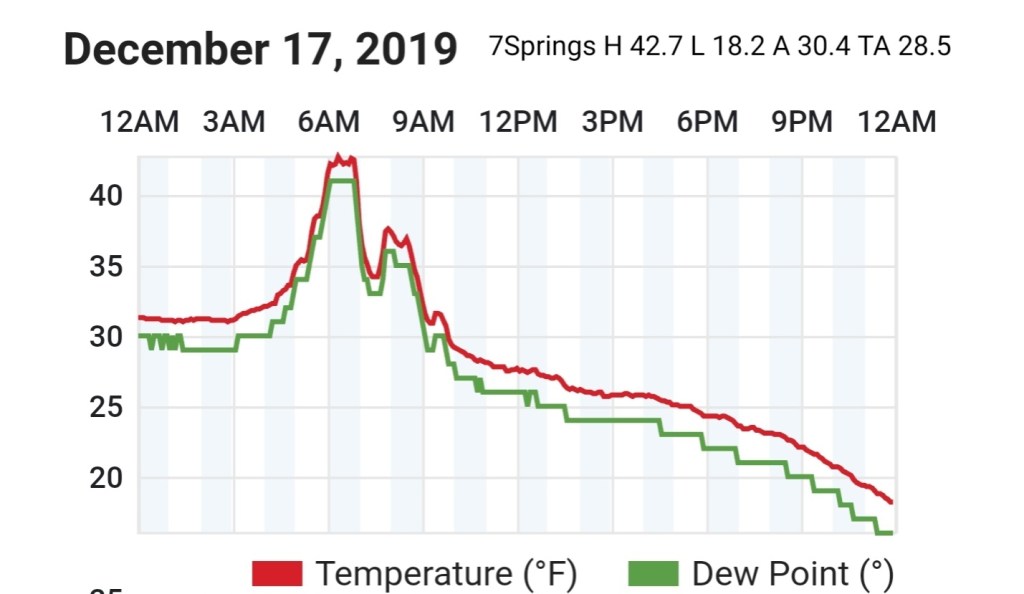
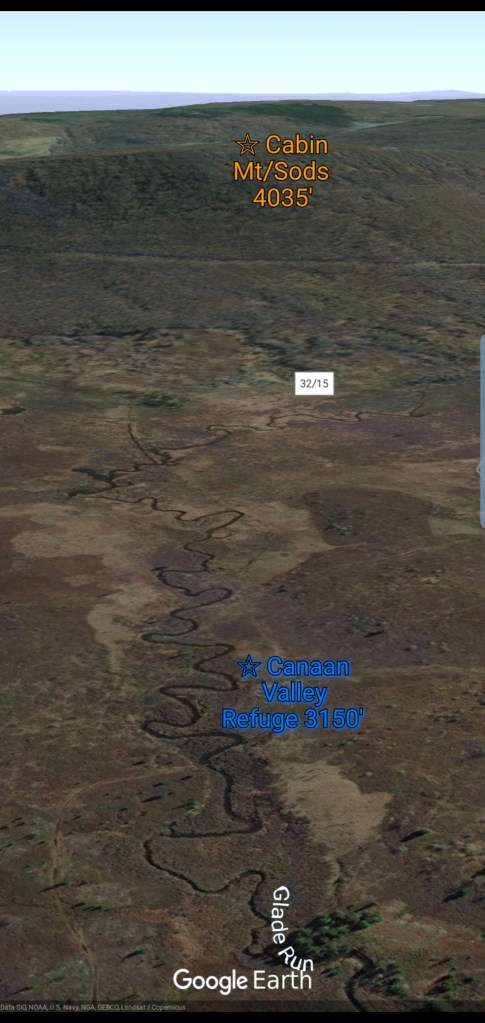
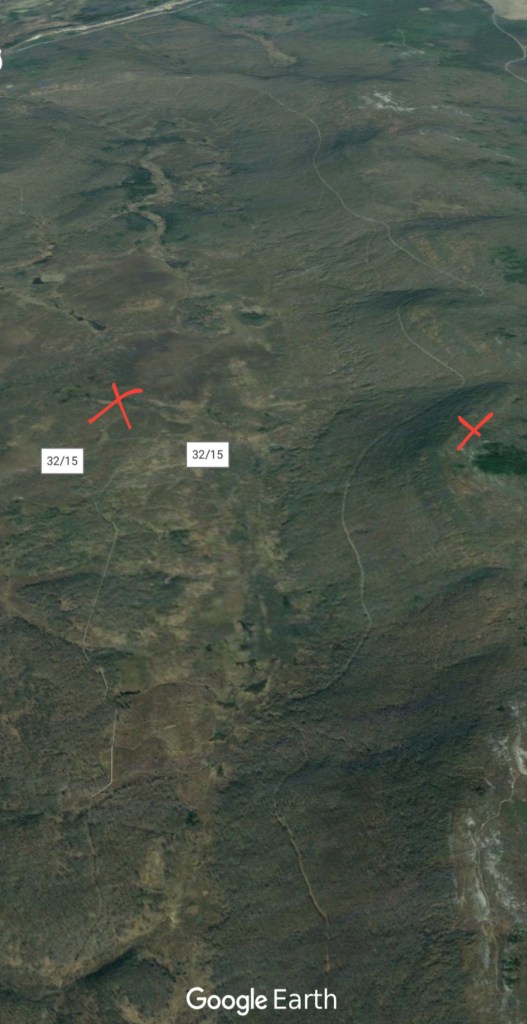
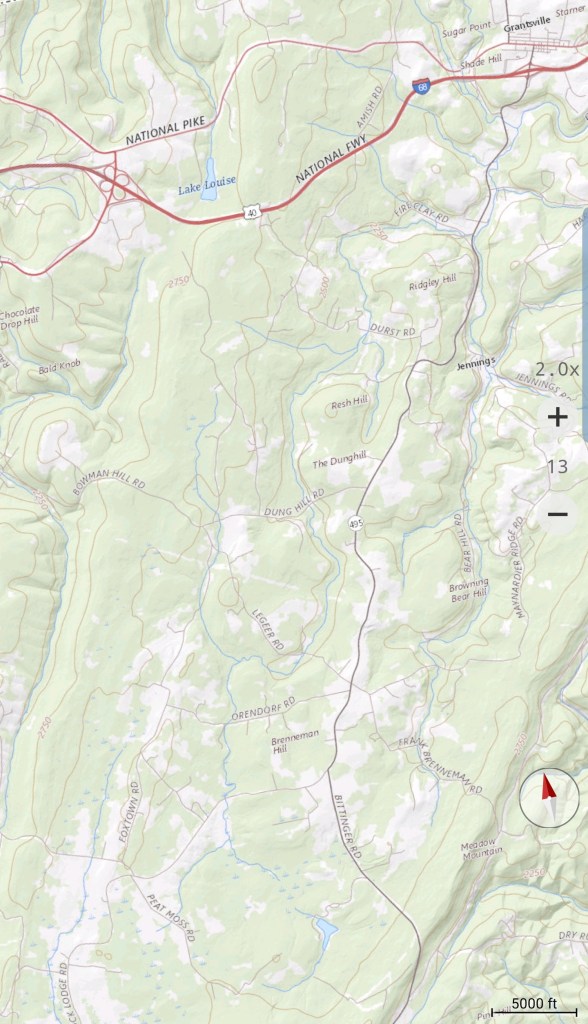
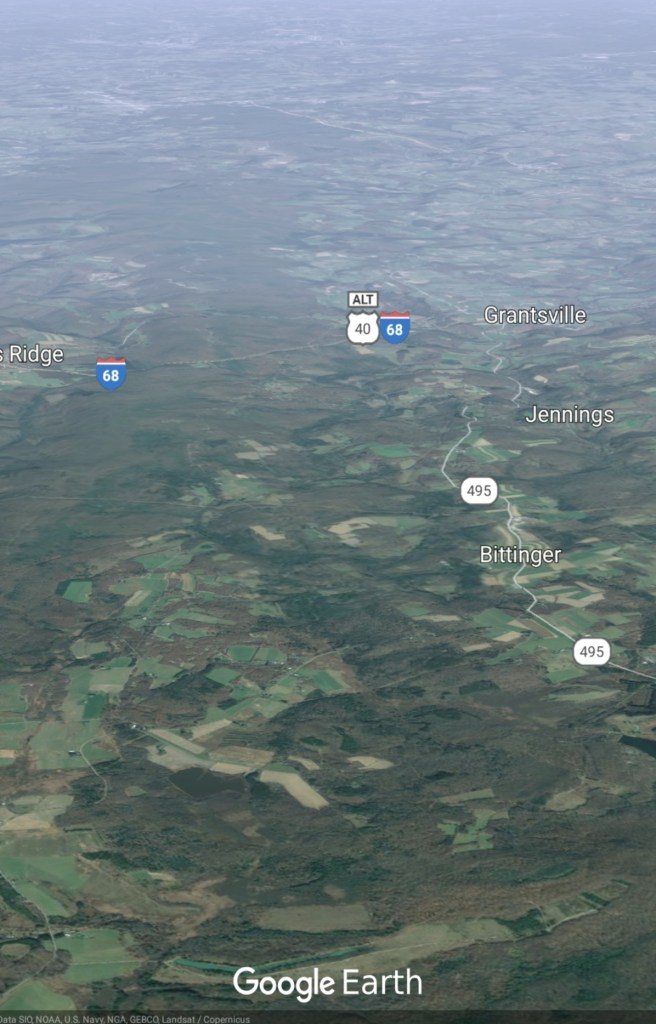
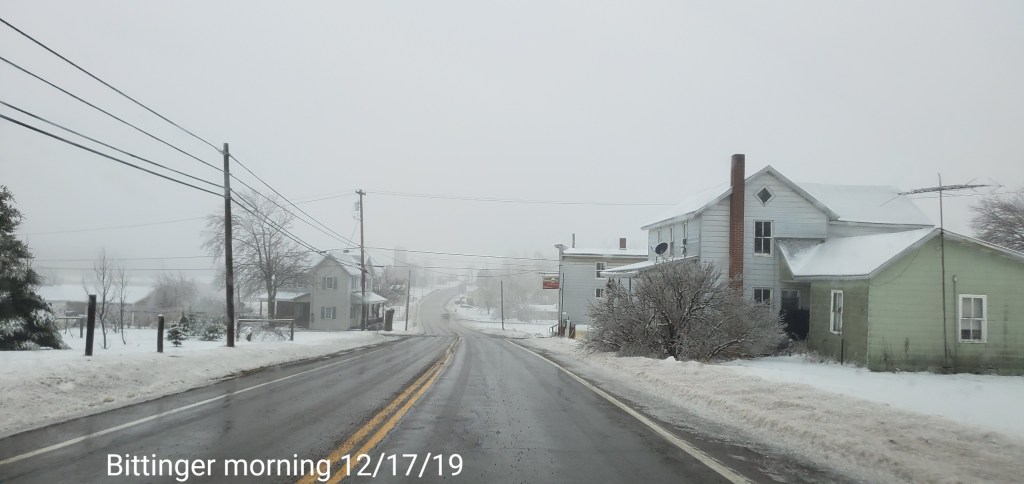
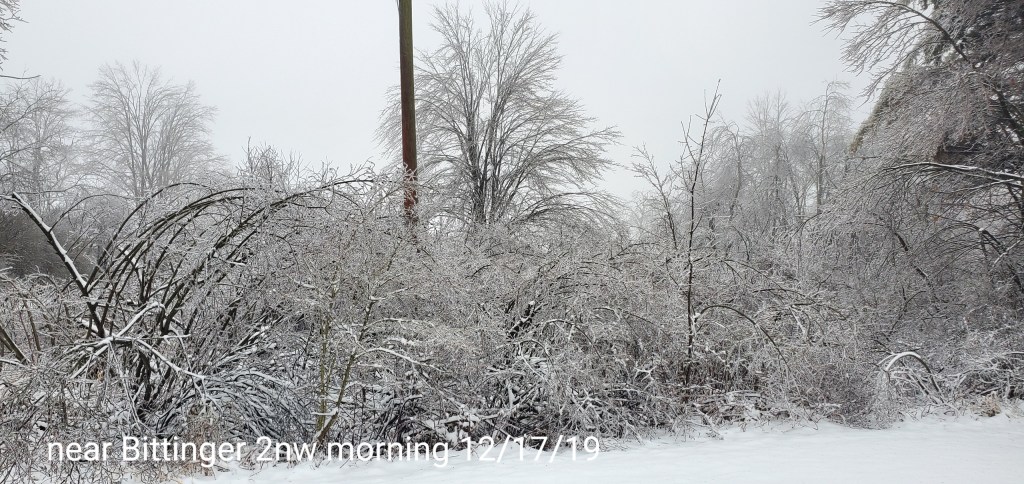
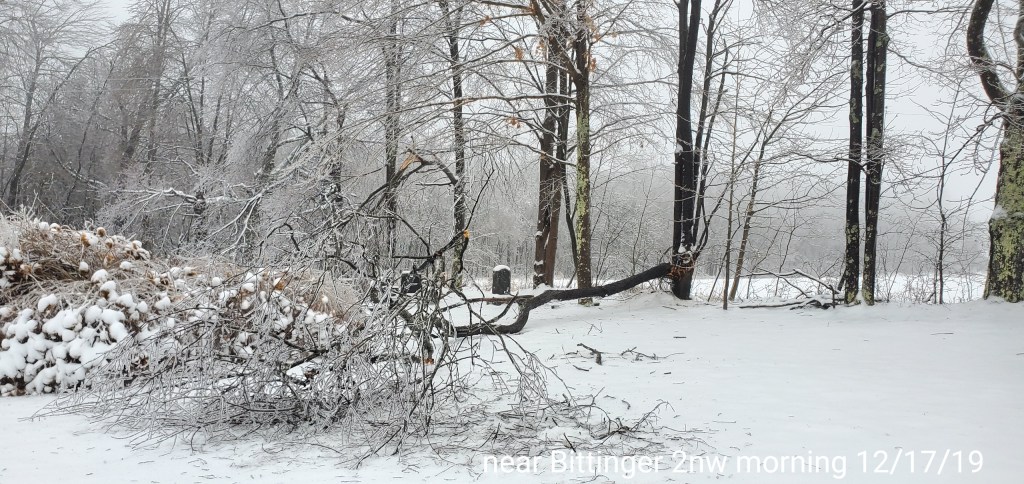
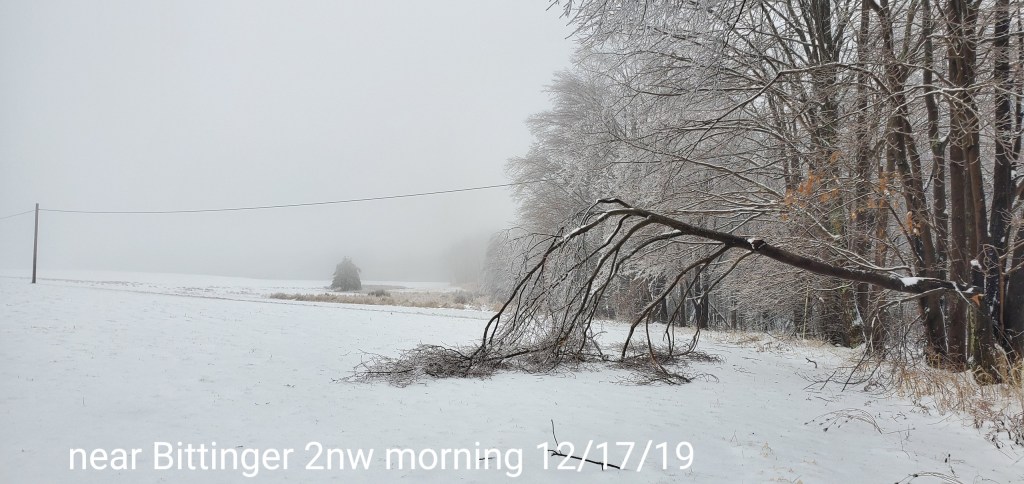
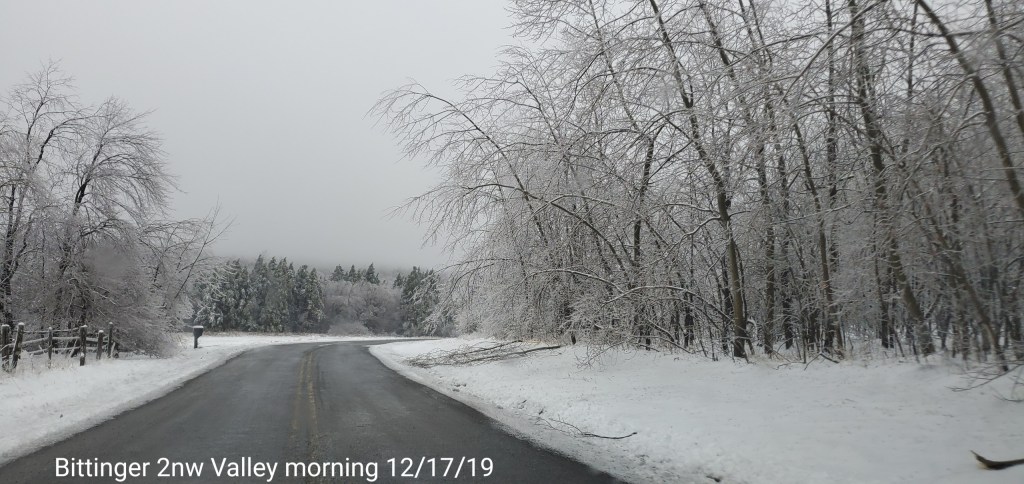
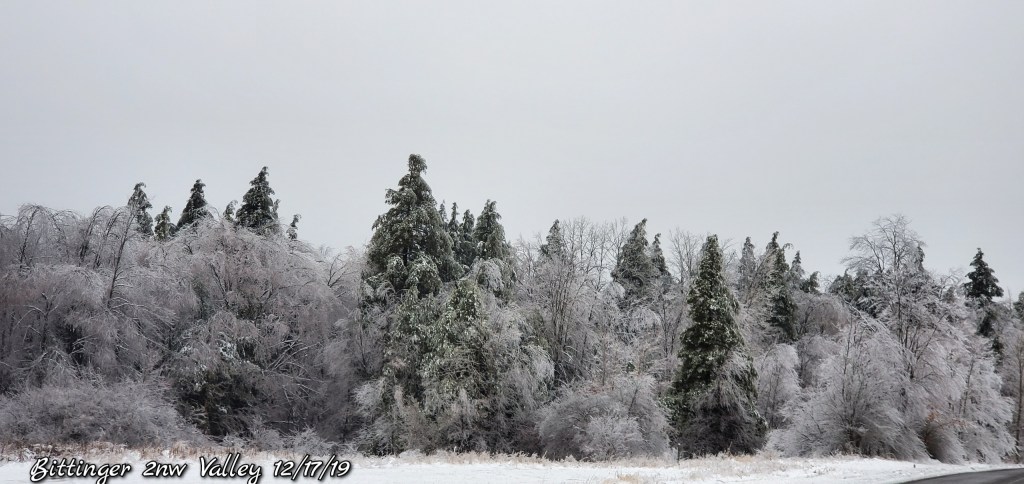
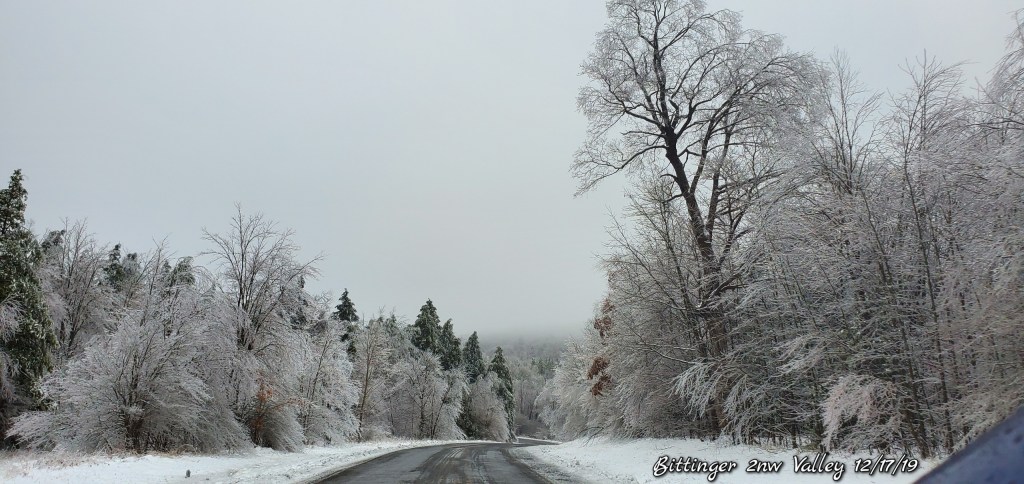
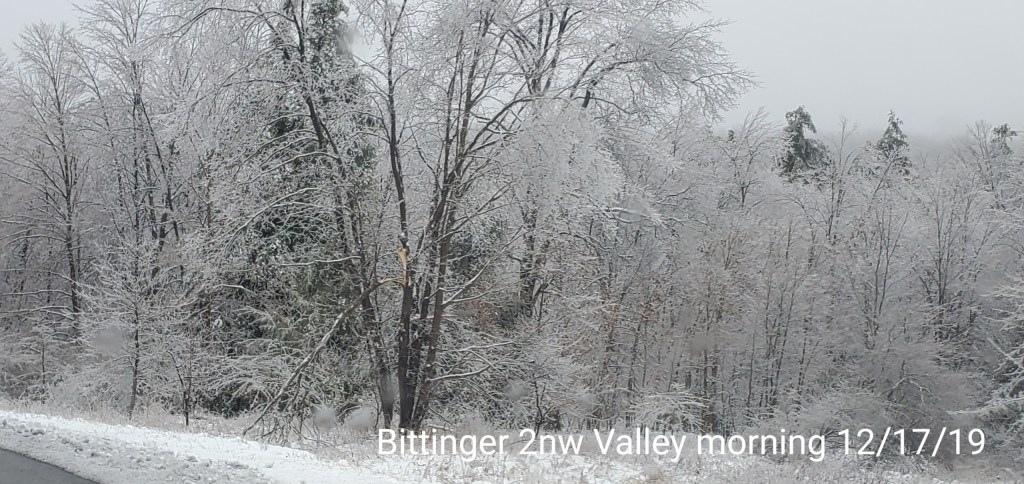
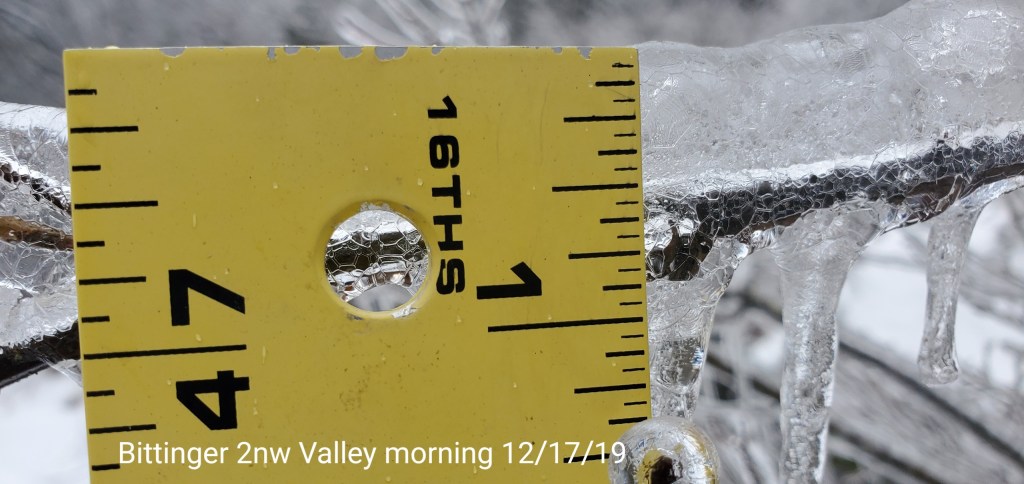
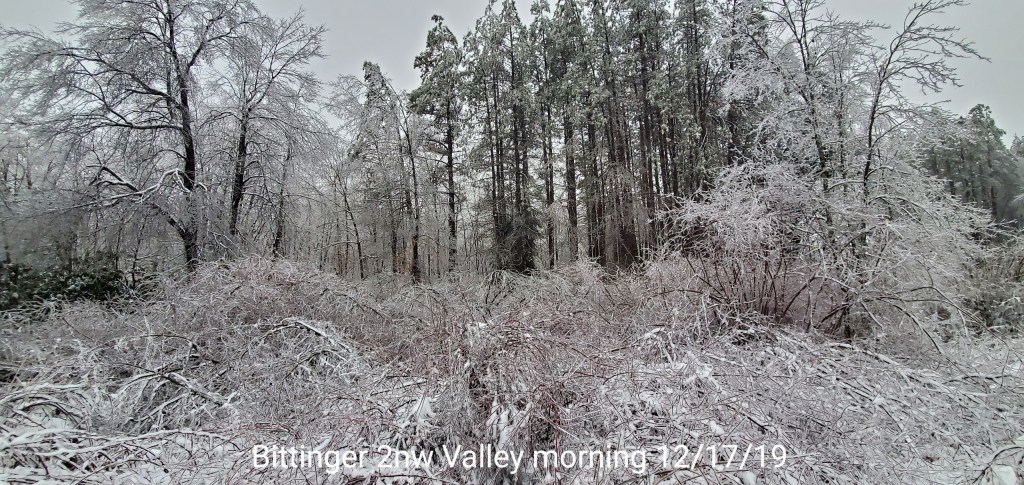
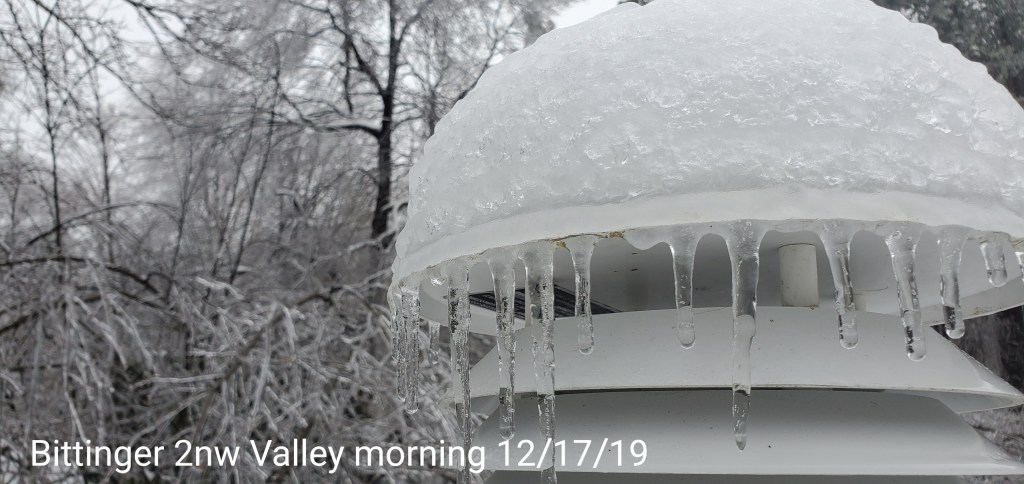
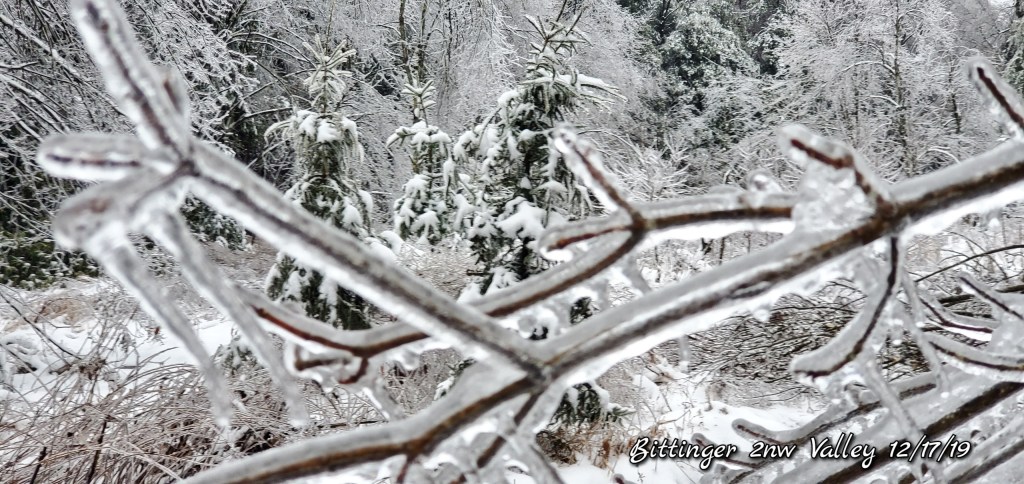
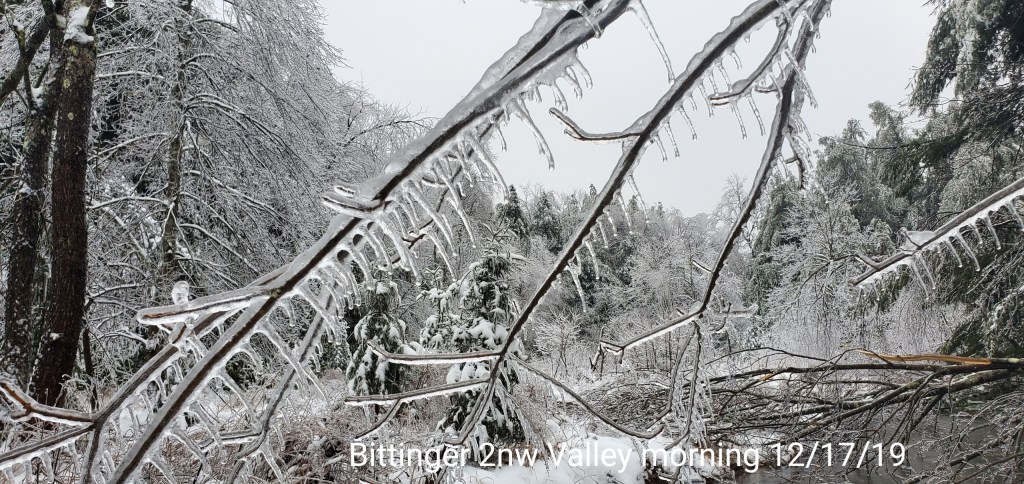
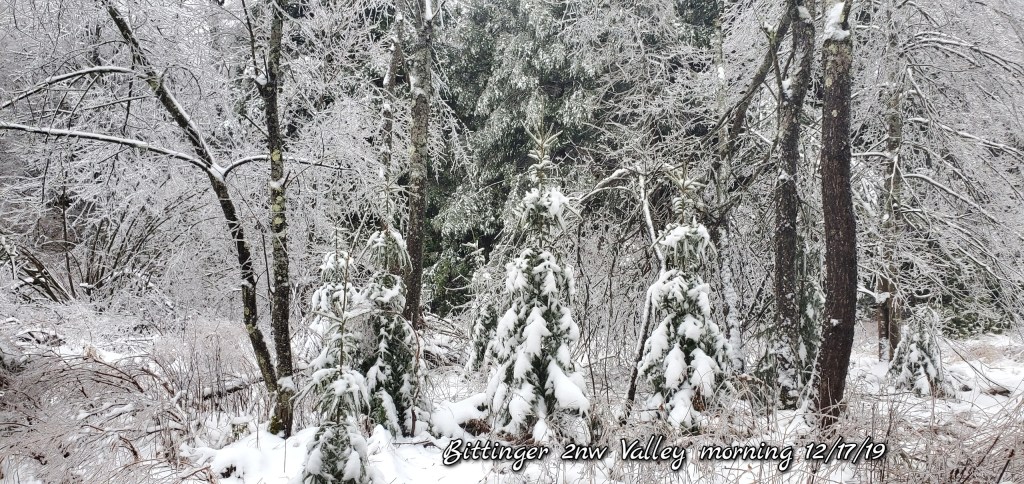
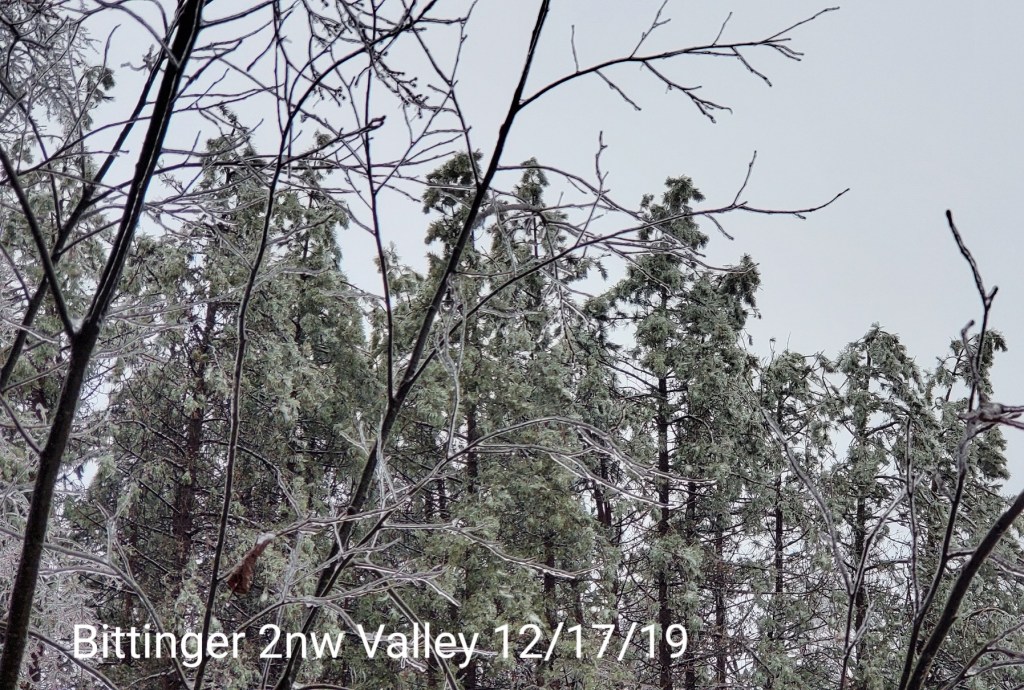
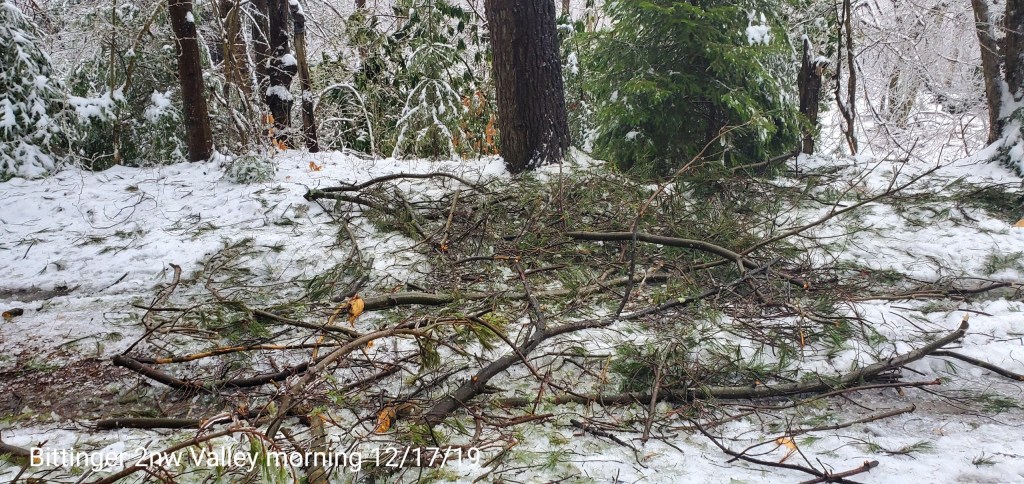
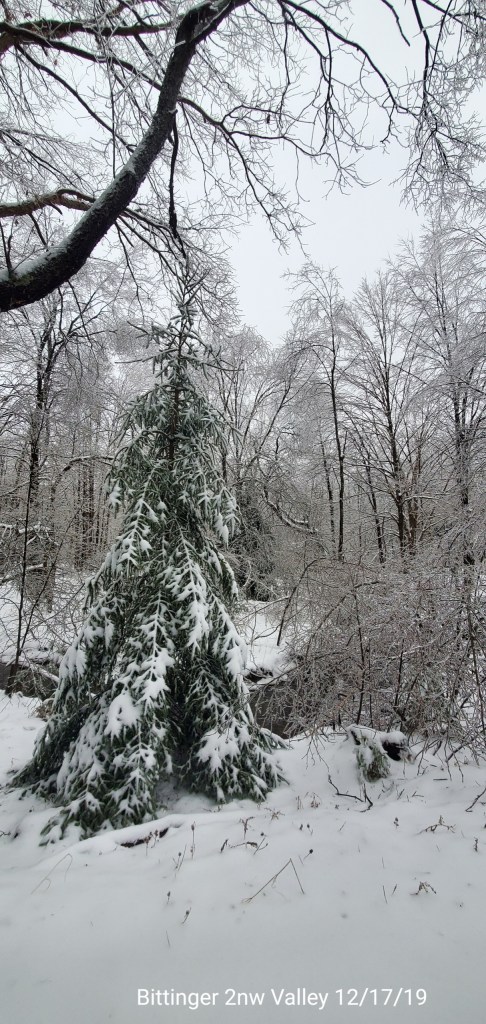
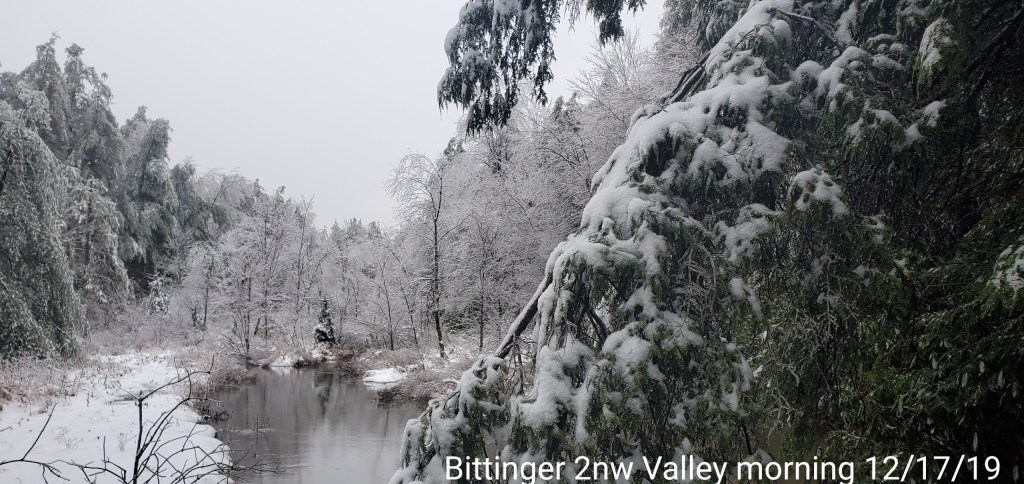
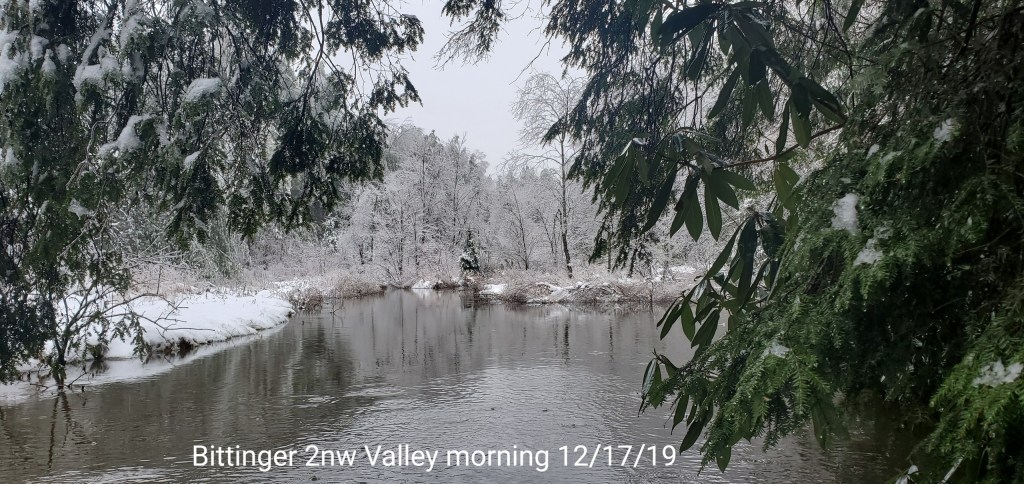
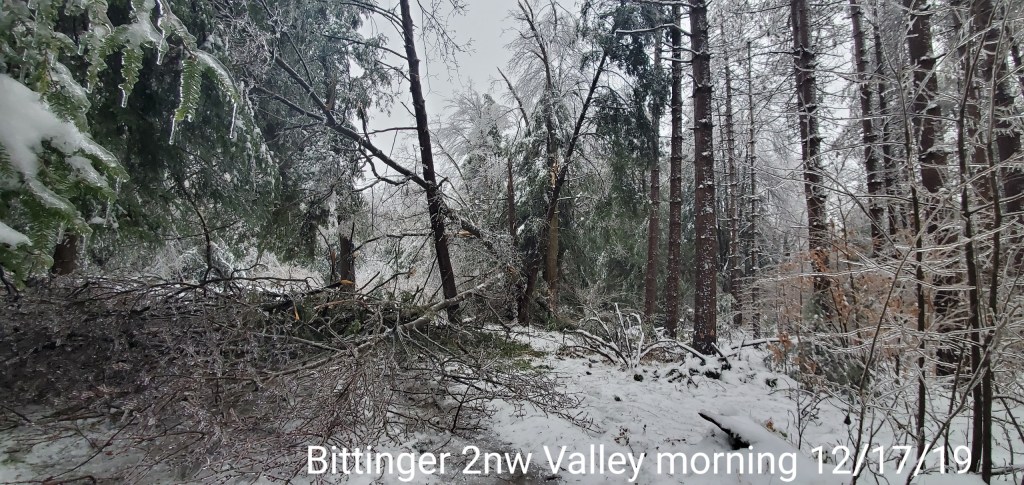
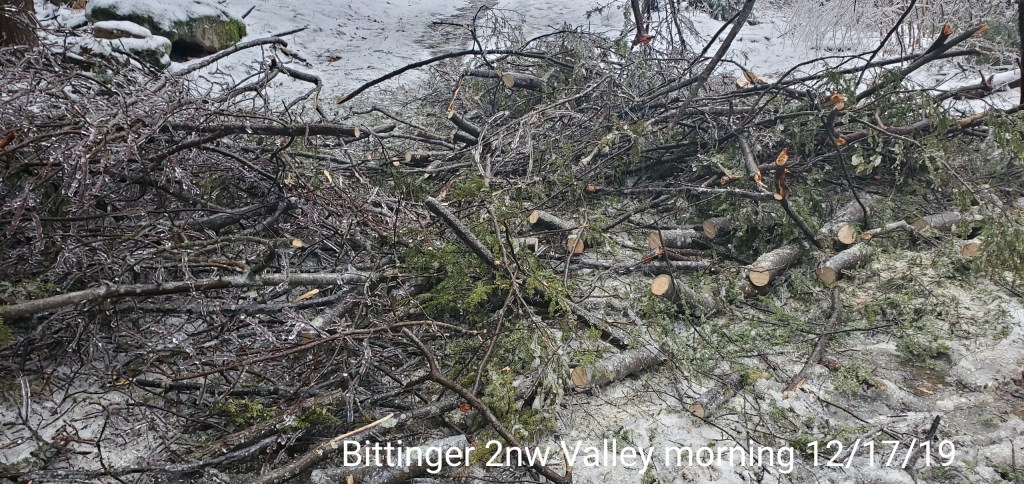
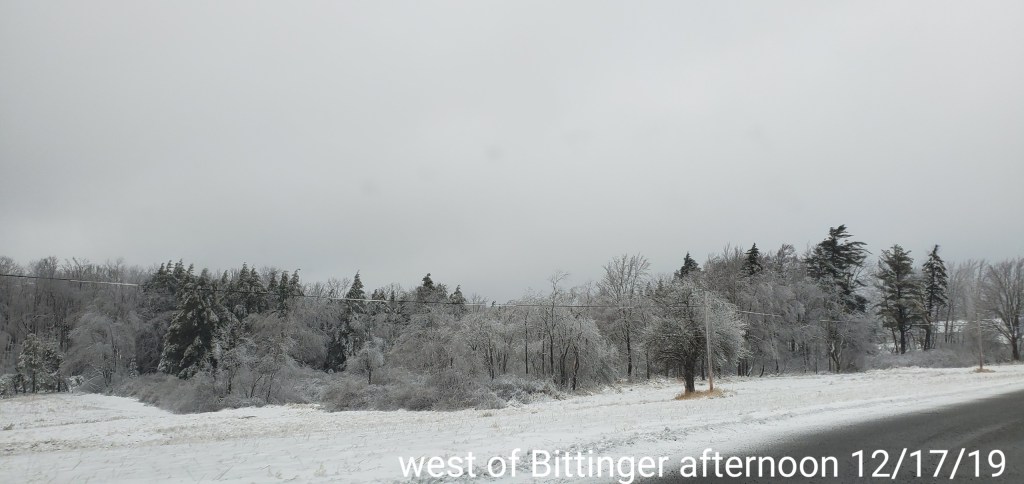
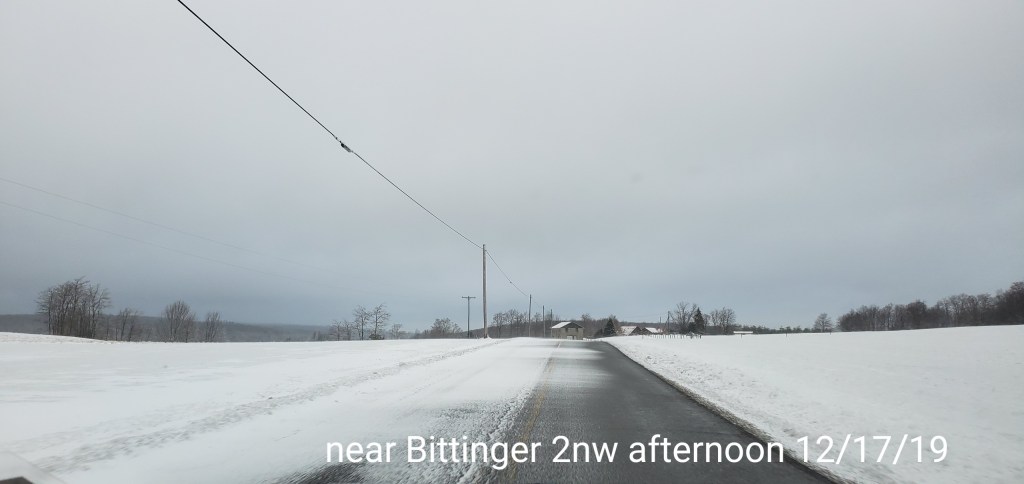
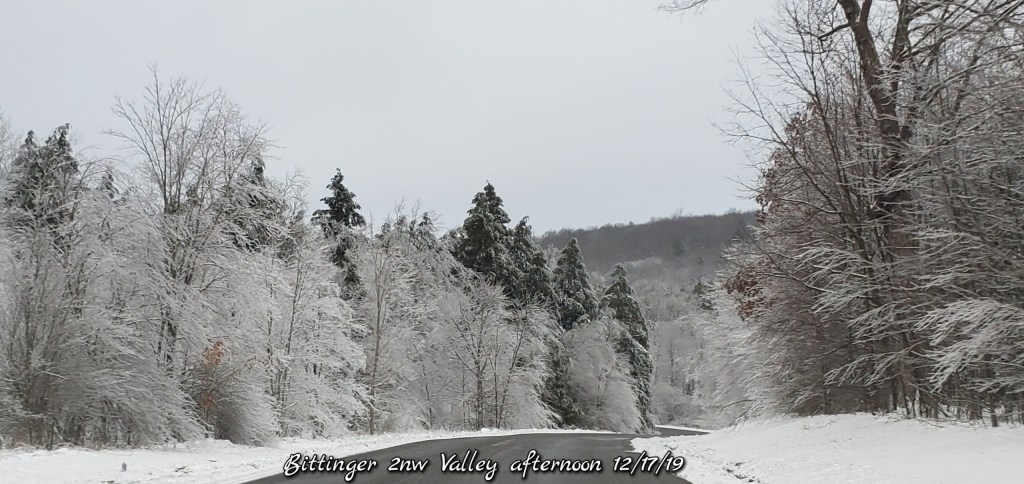
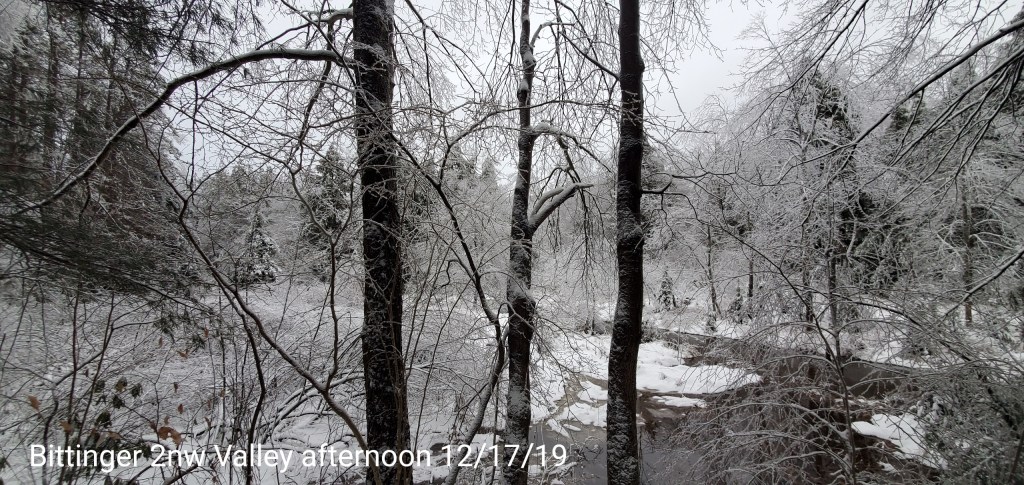
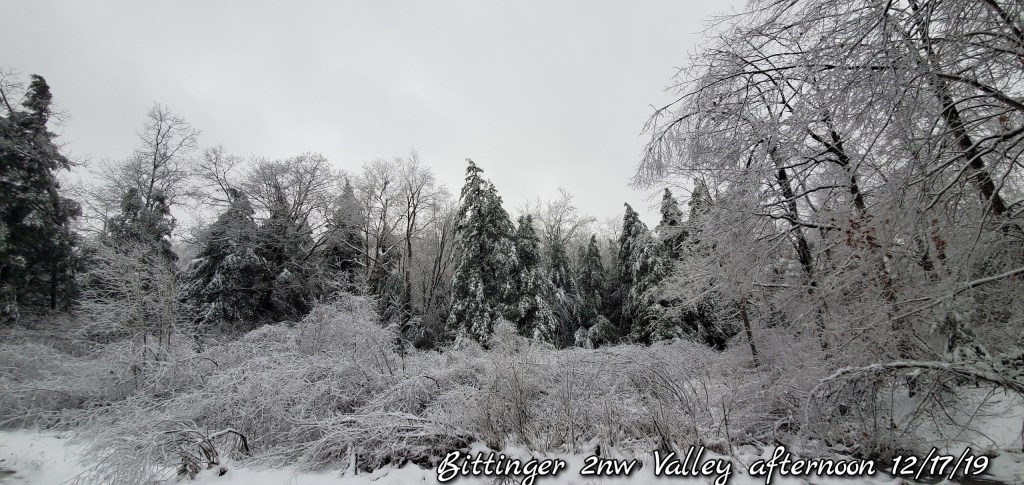
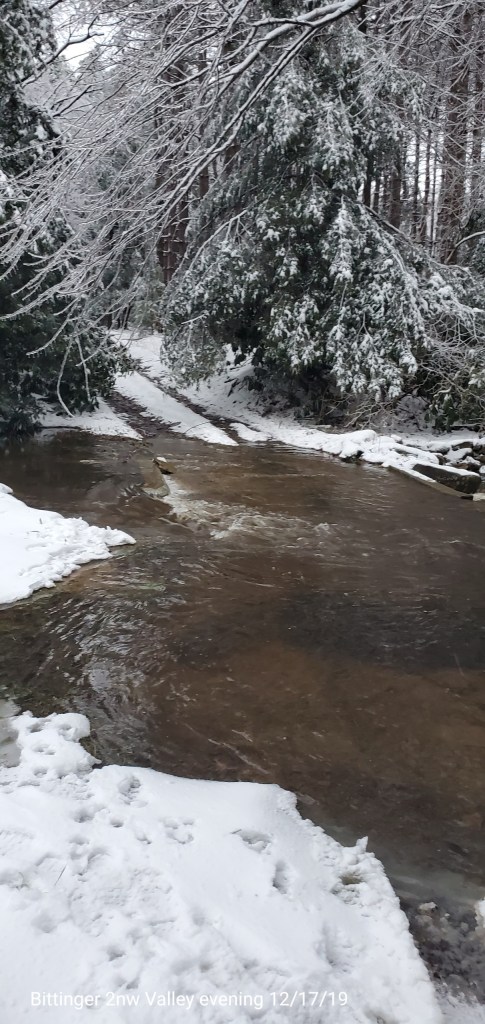
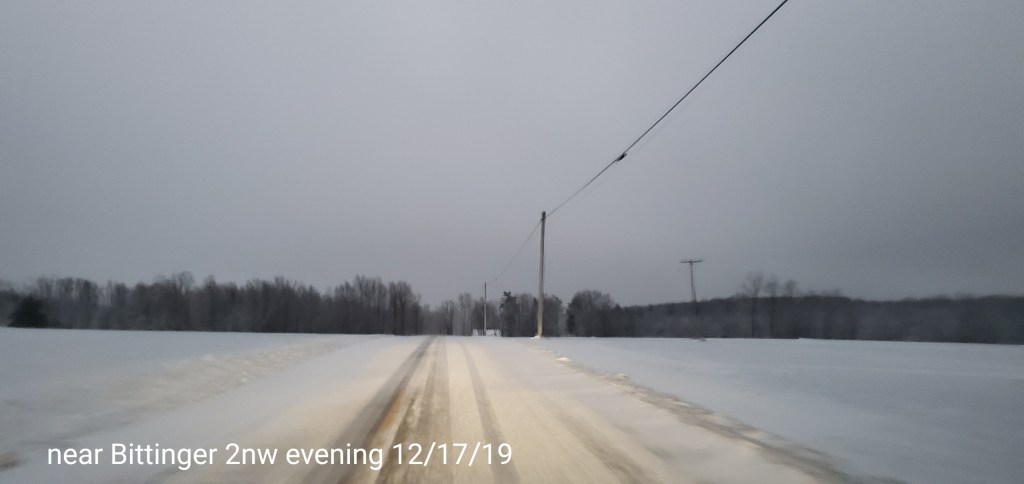
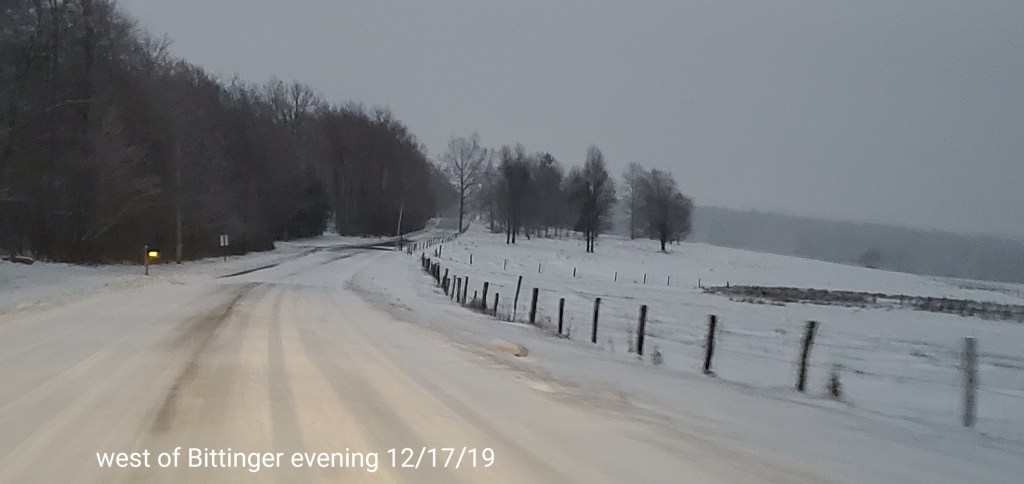
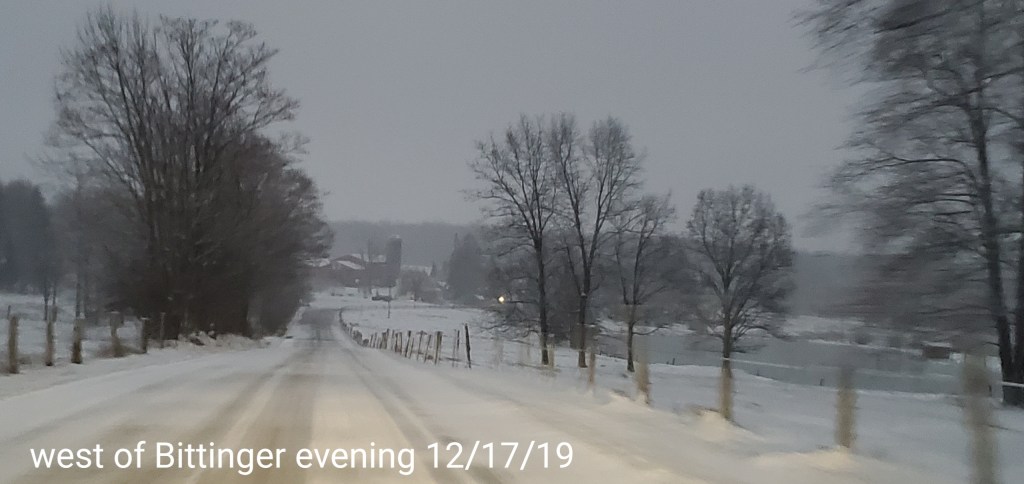
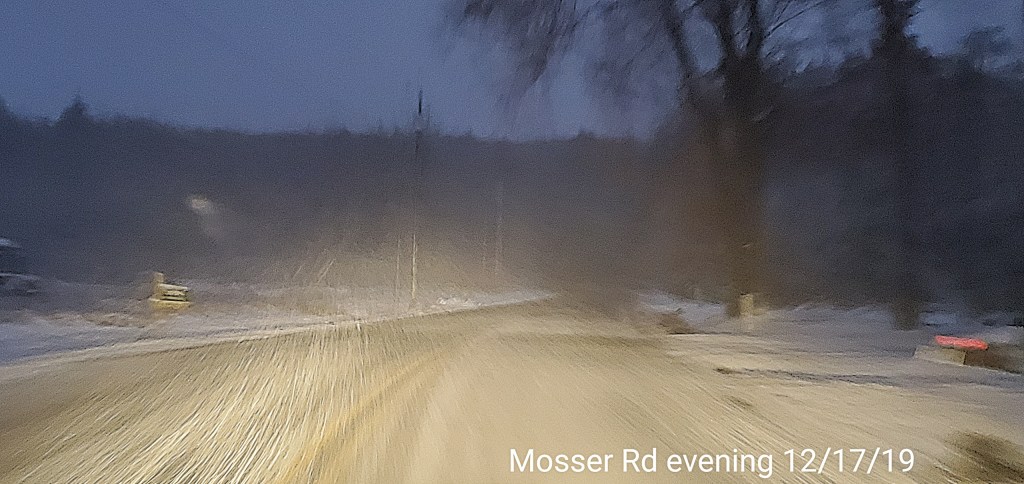
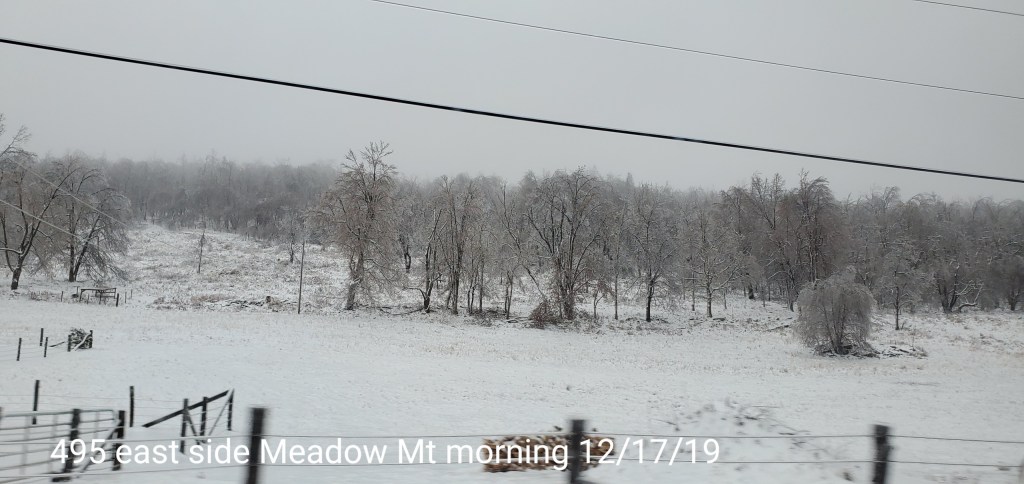
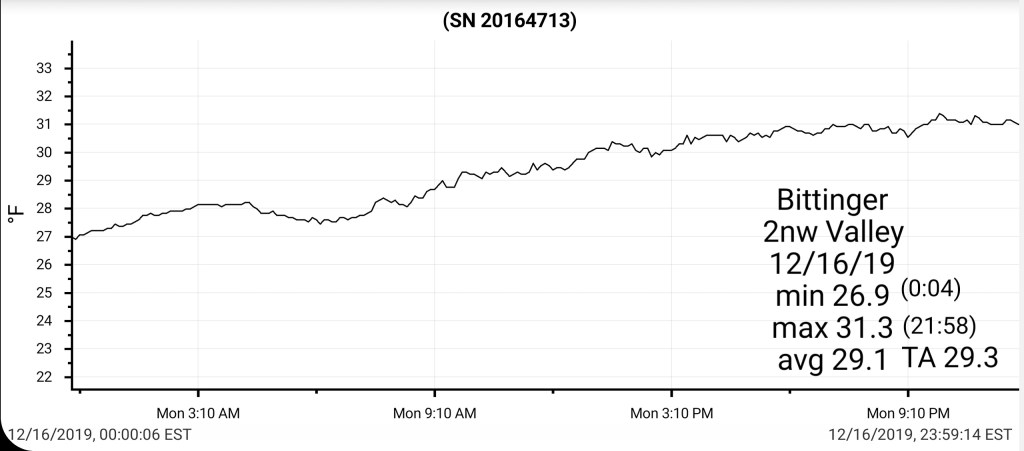
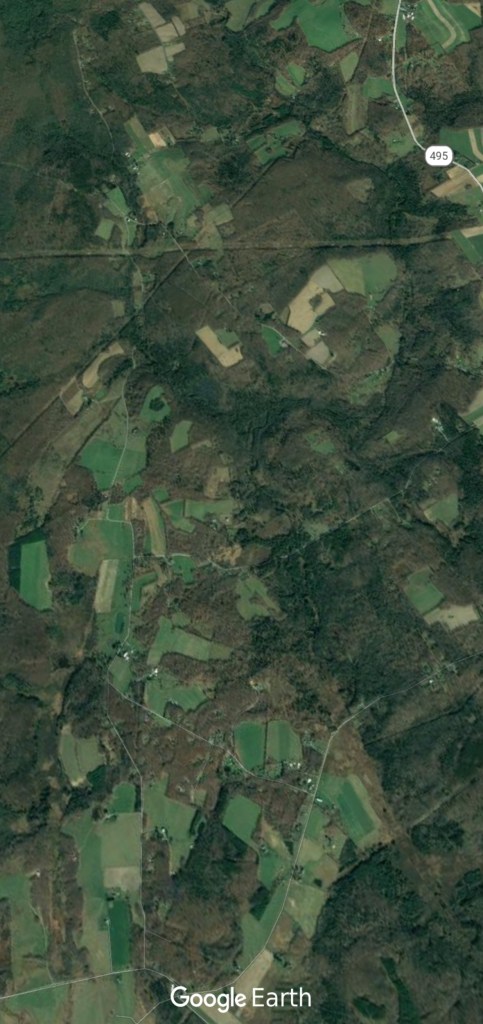
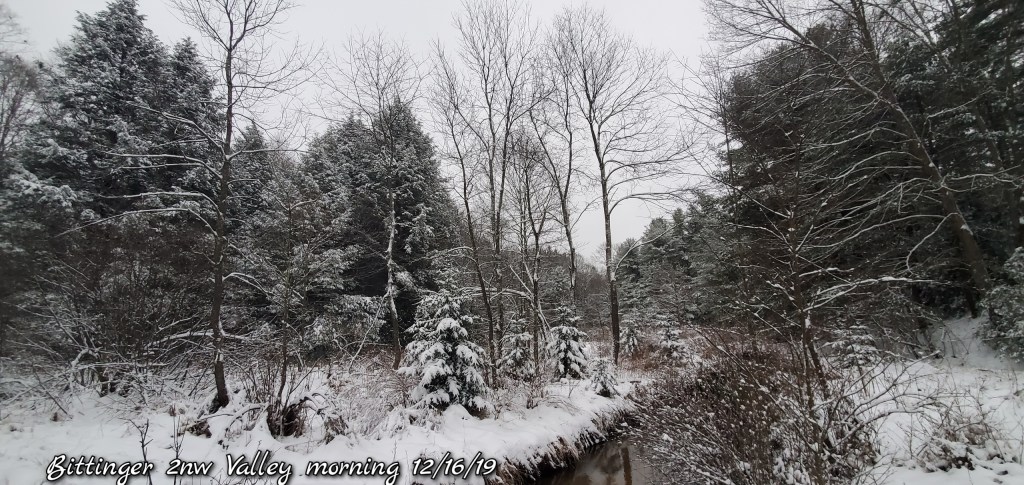
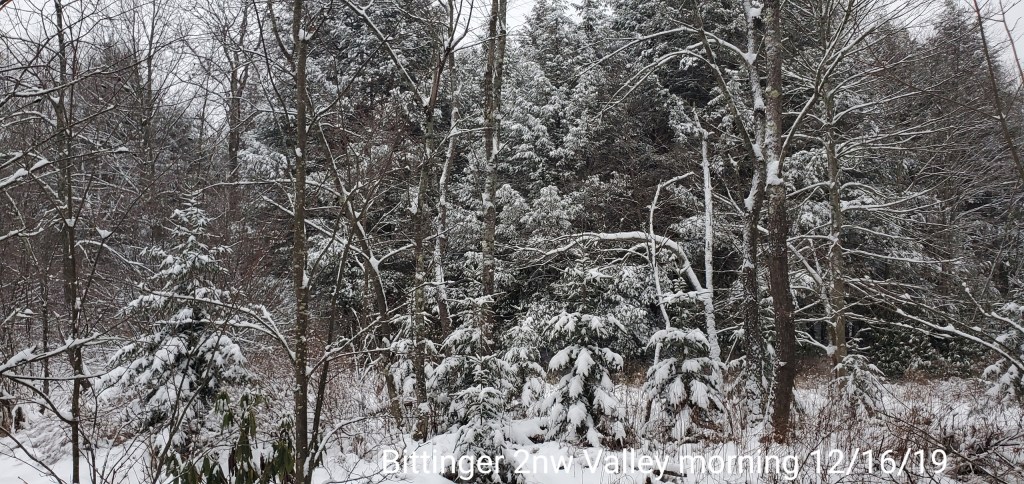
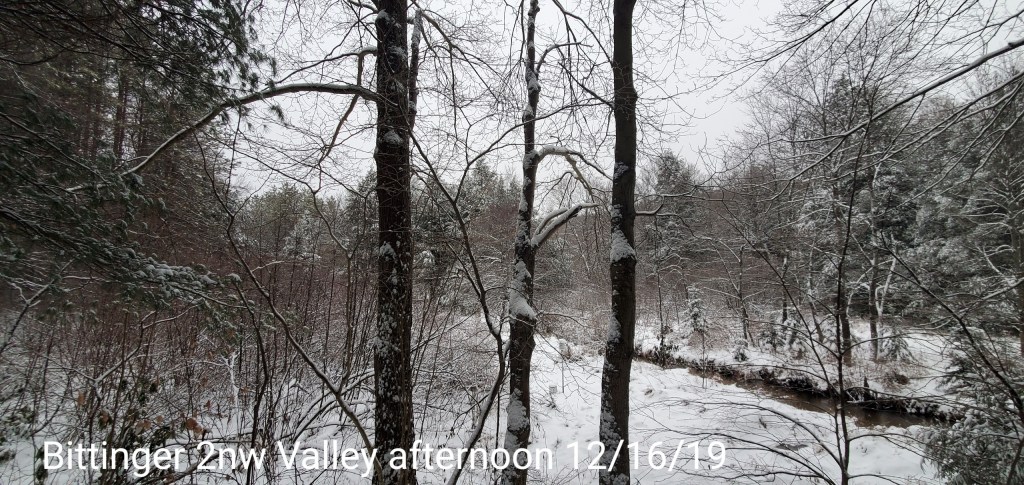
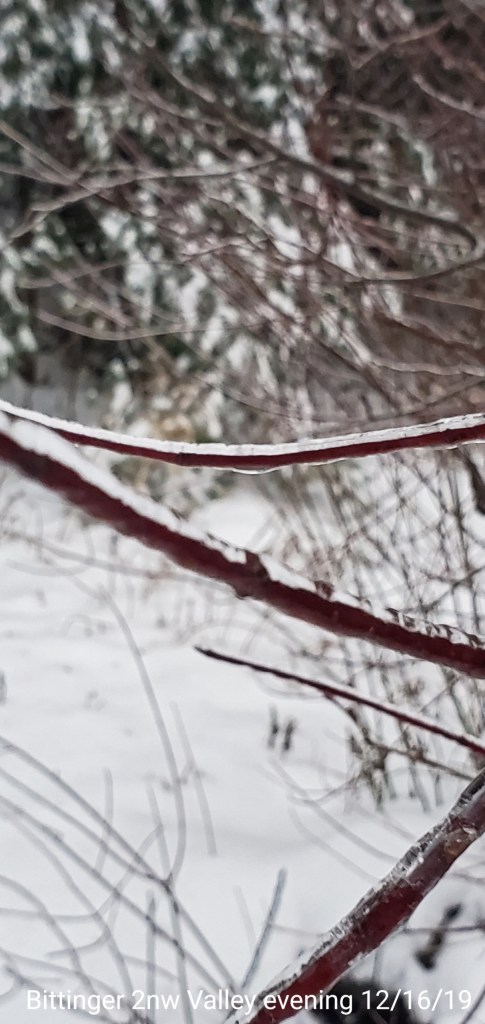
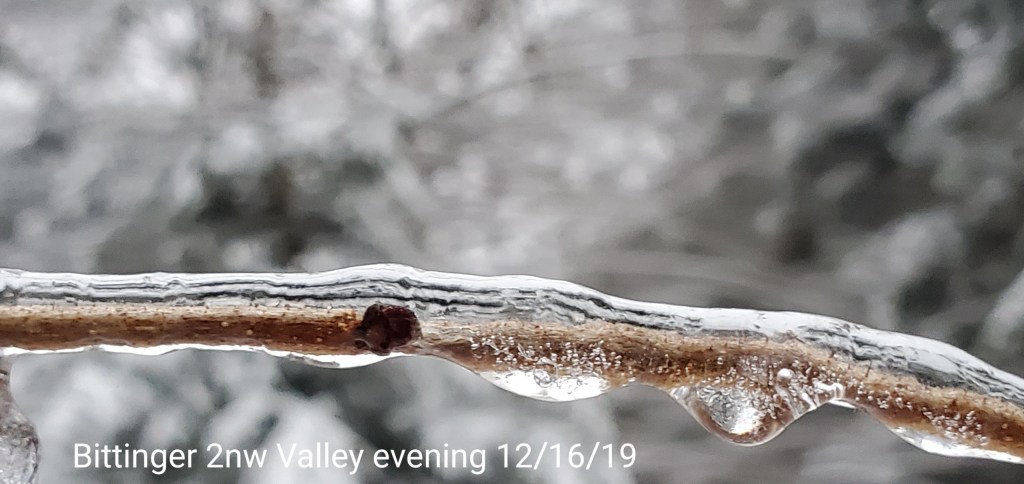
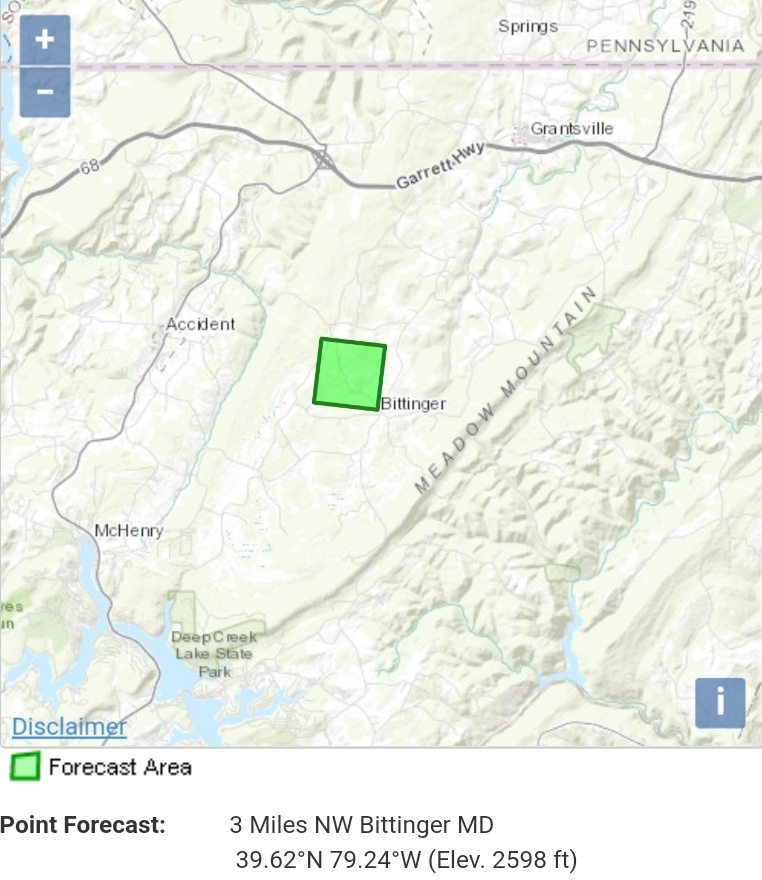
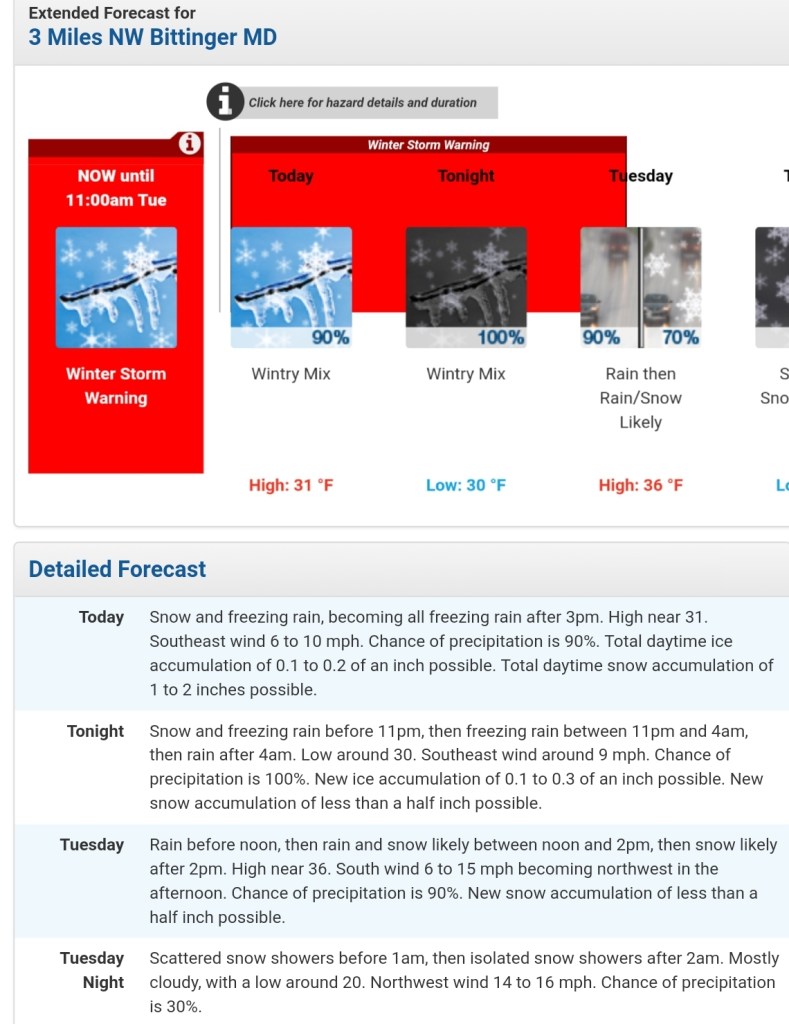
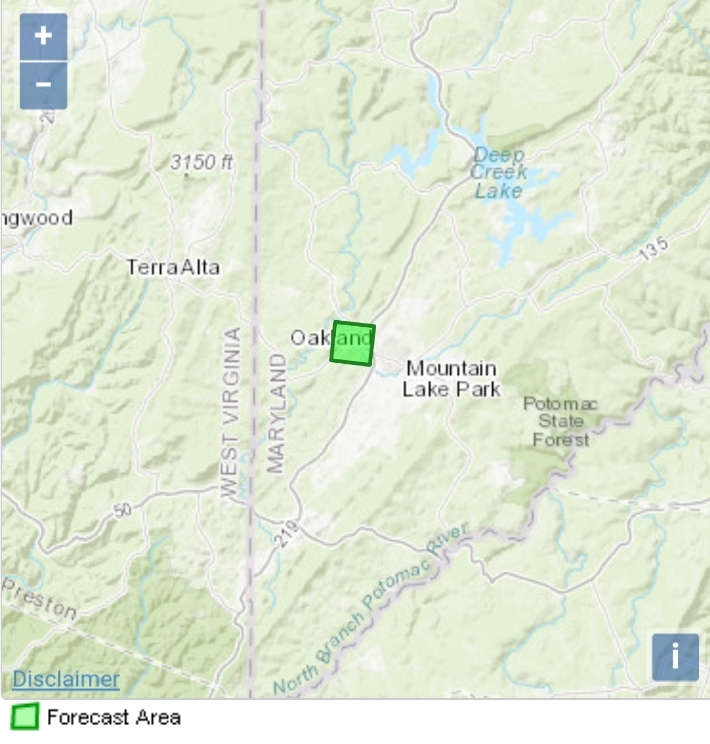
Bittinger 2nw Valley
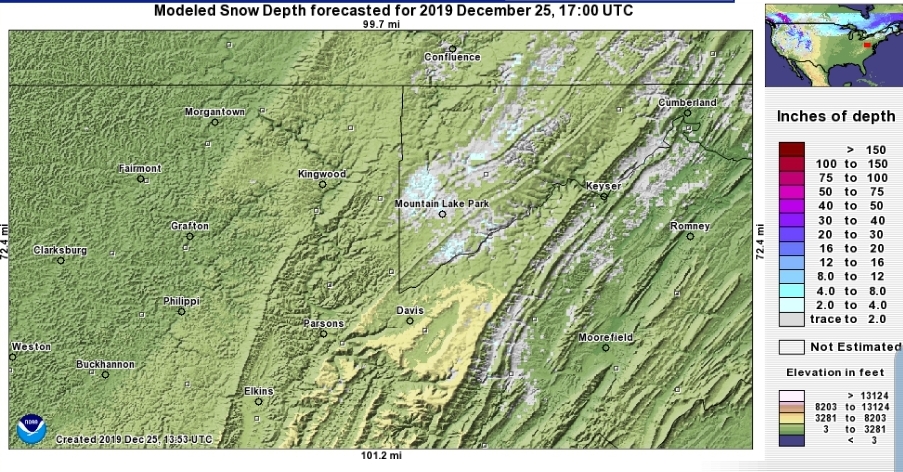
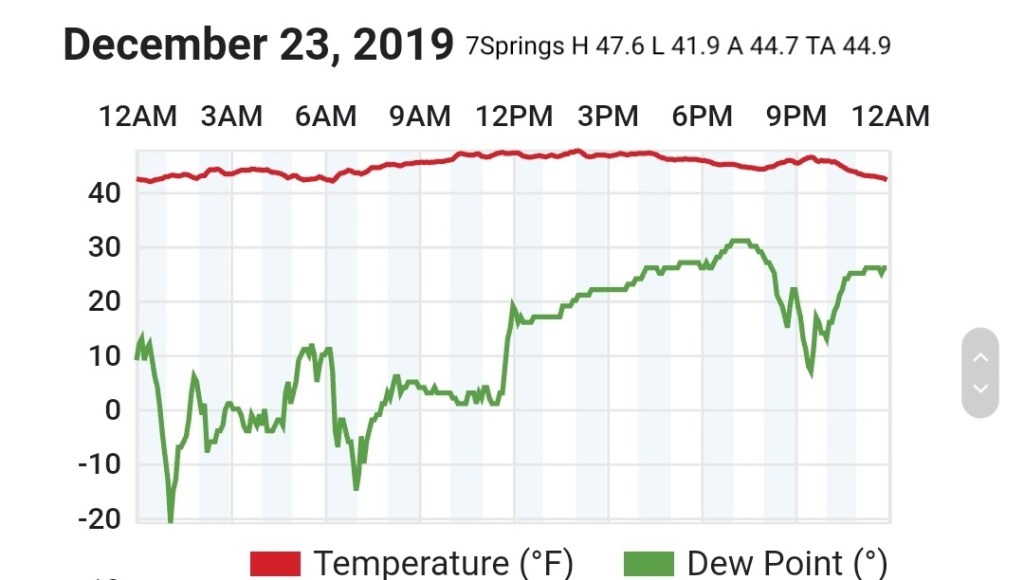
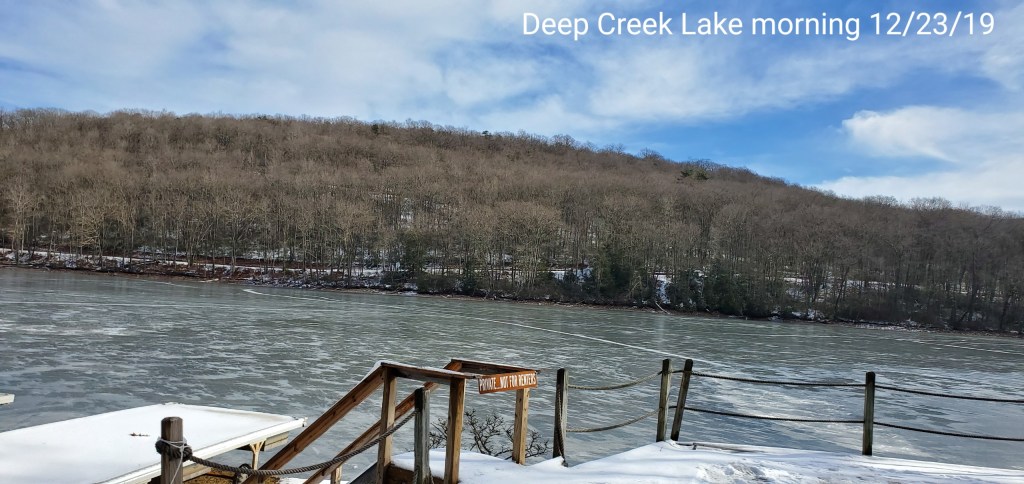
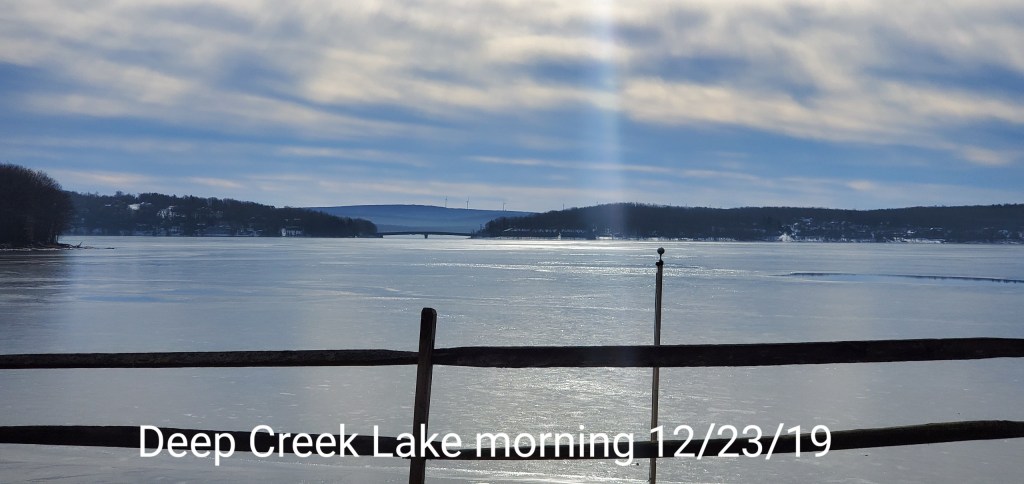
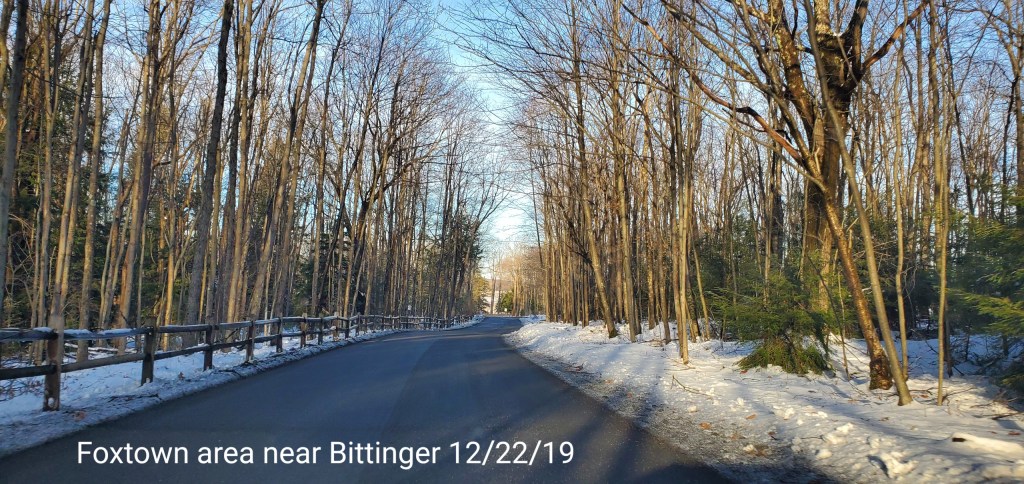
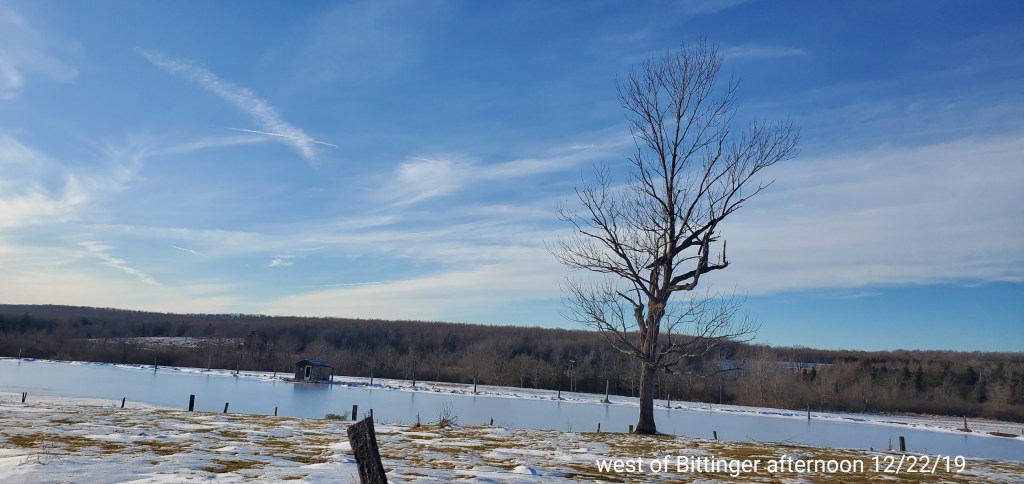
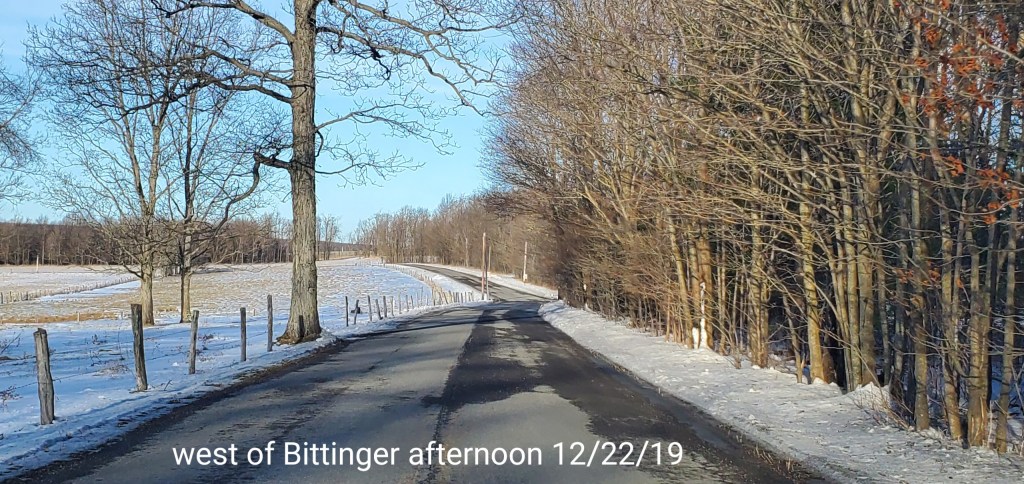
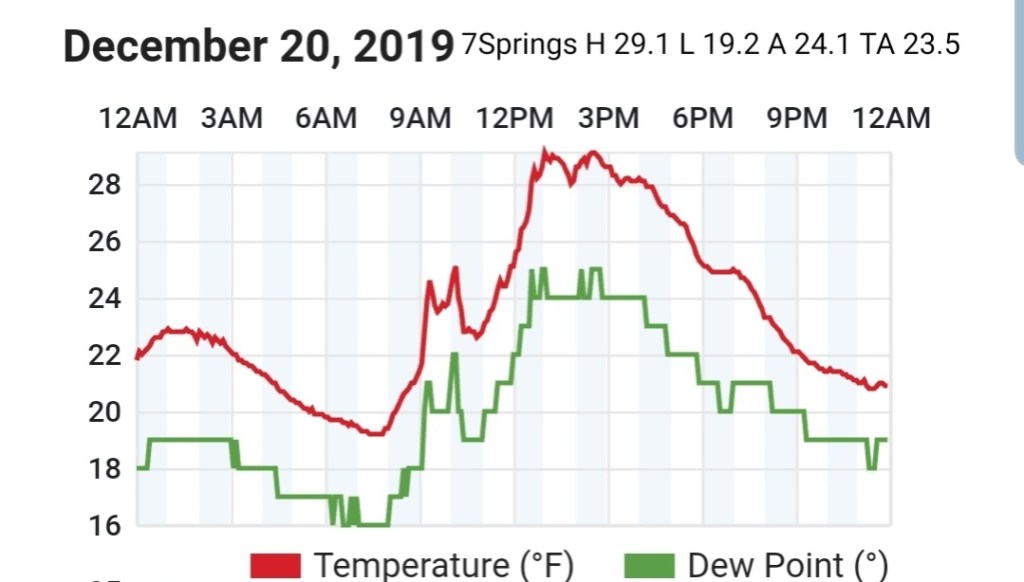
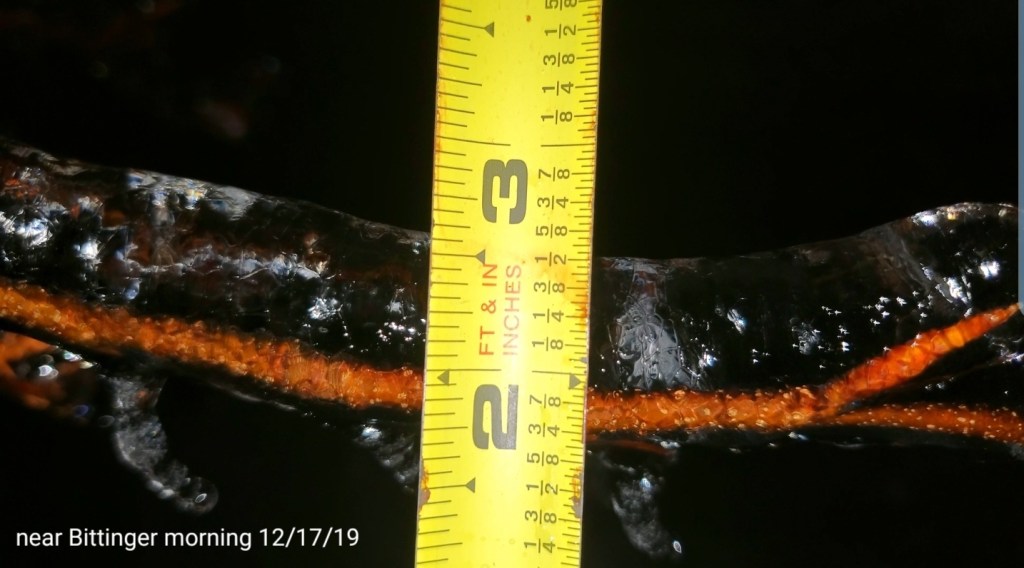
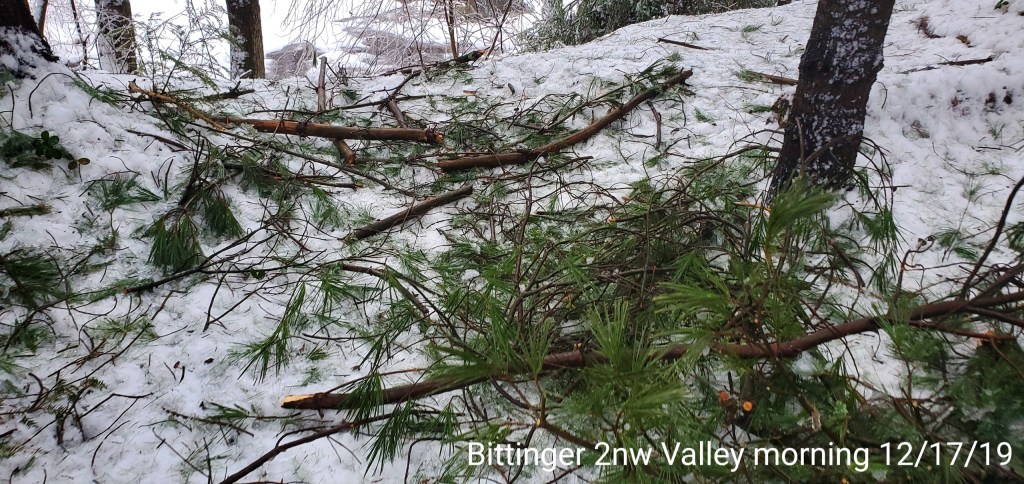
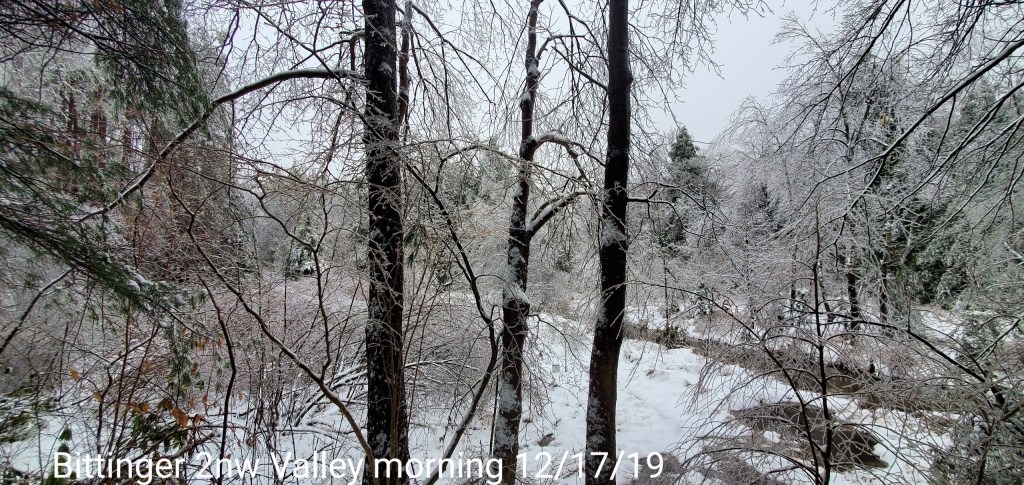
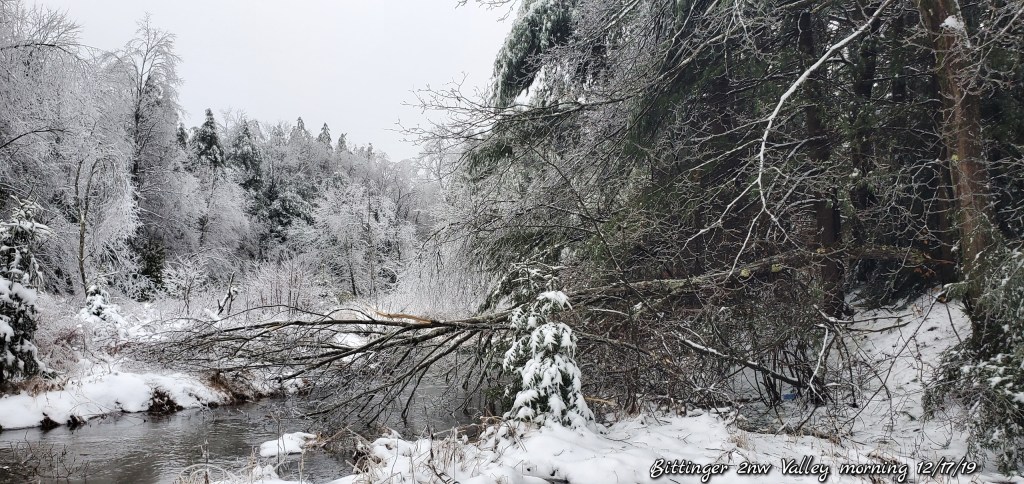
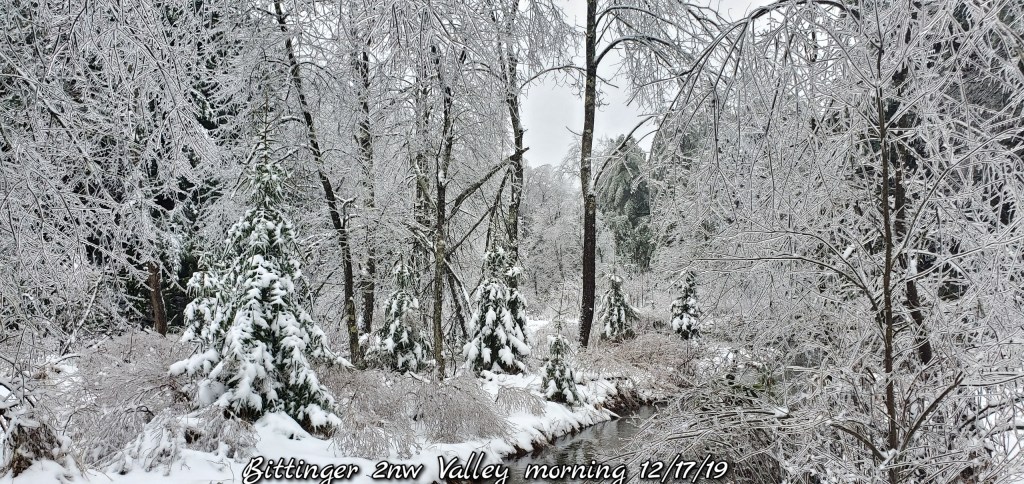
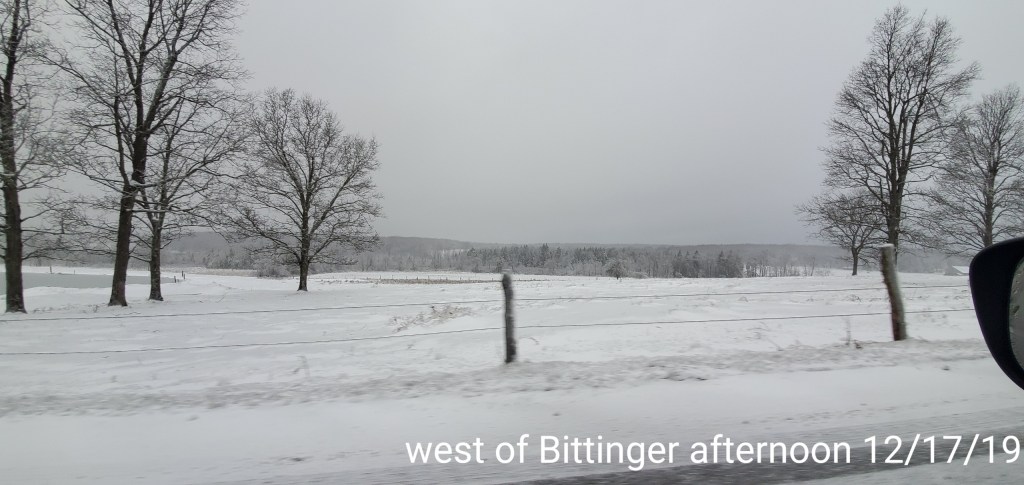
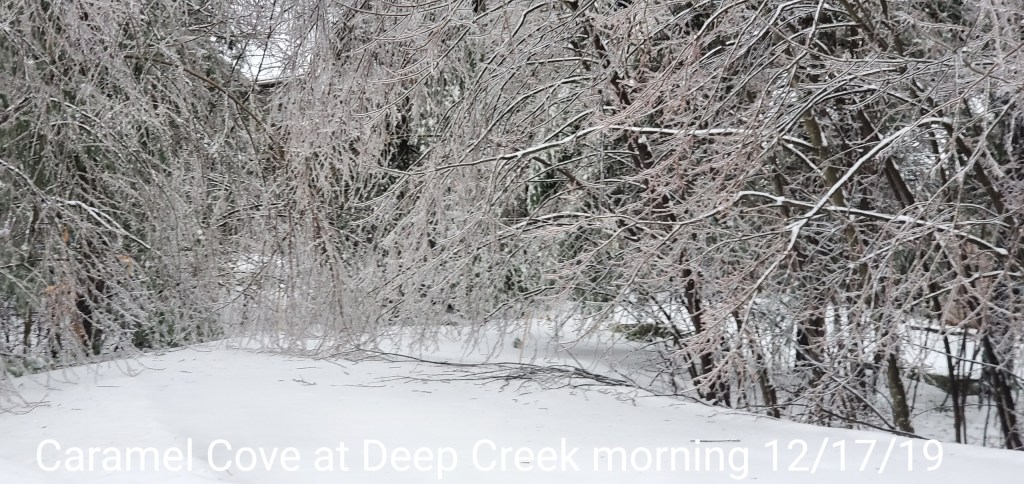
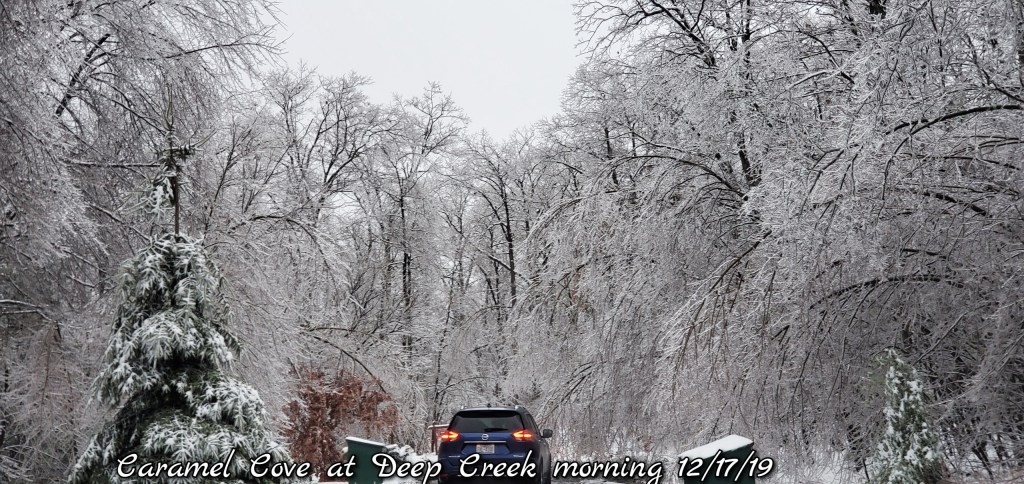
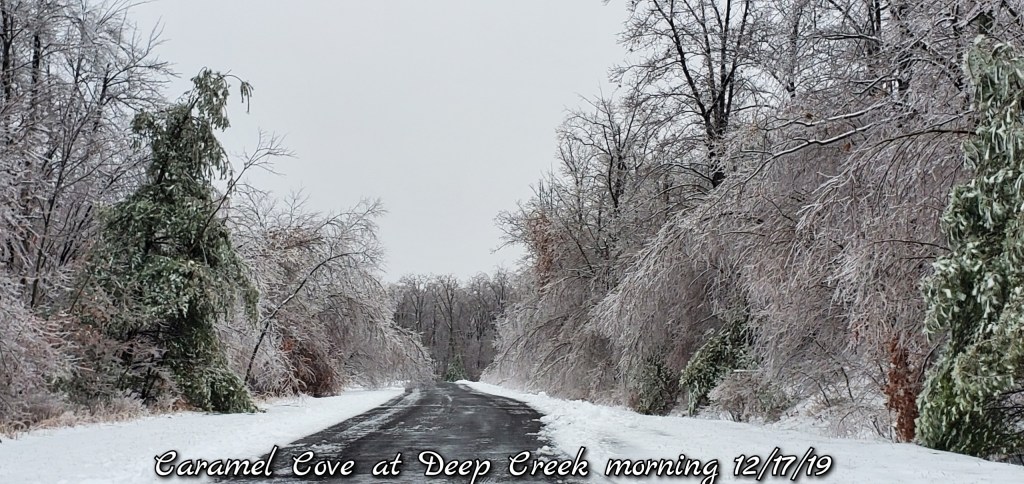
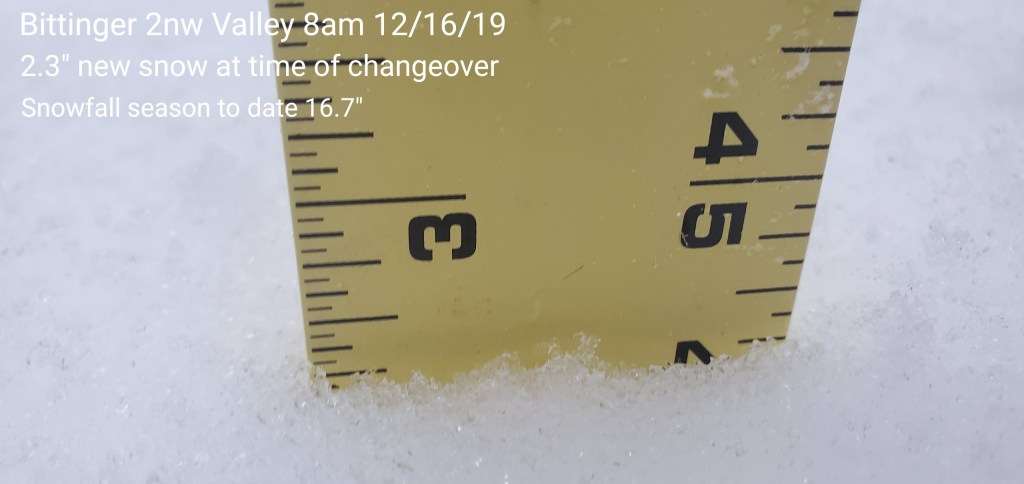
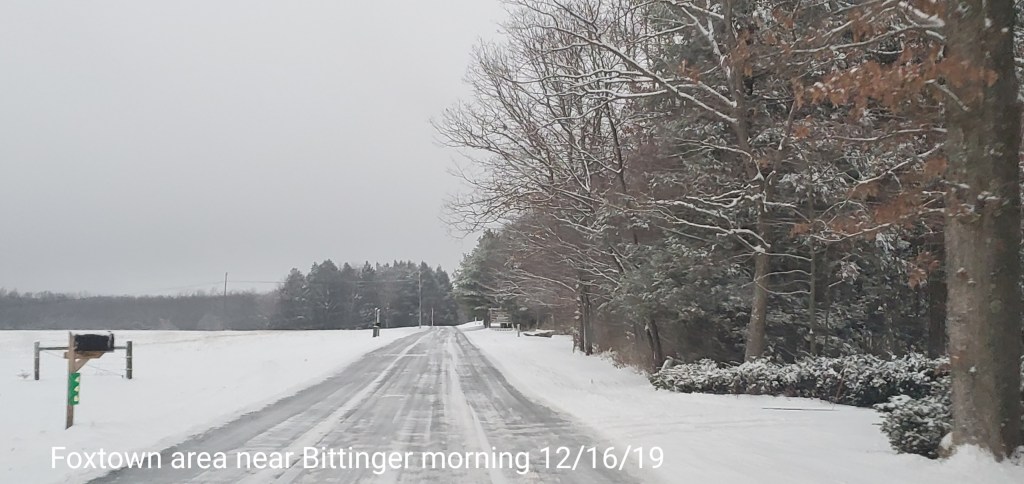
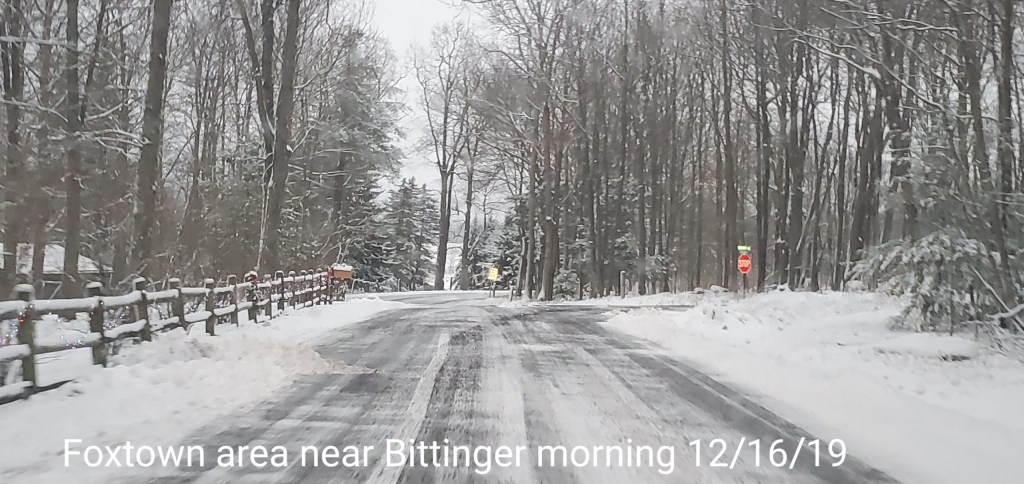
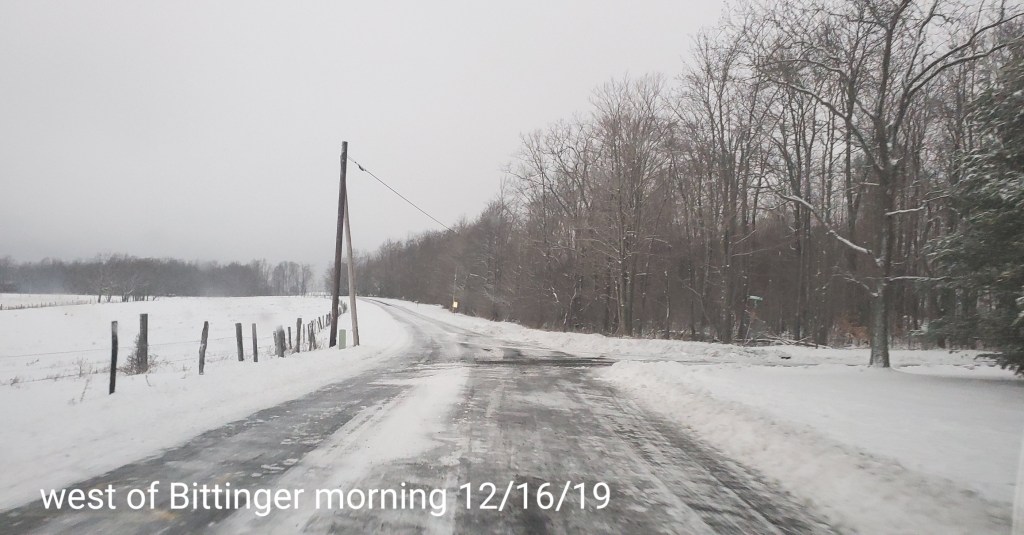
This is an area, that holds cold for the east flow ice events, and west enough to do well on upslope events. Also a sheltered valley that holds cold well. Evident by the temps and remaining snow(lots of pics below)that gave a white Christmas to this area. At 9am, a 3″ hardpack remained.
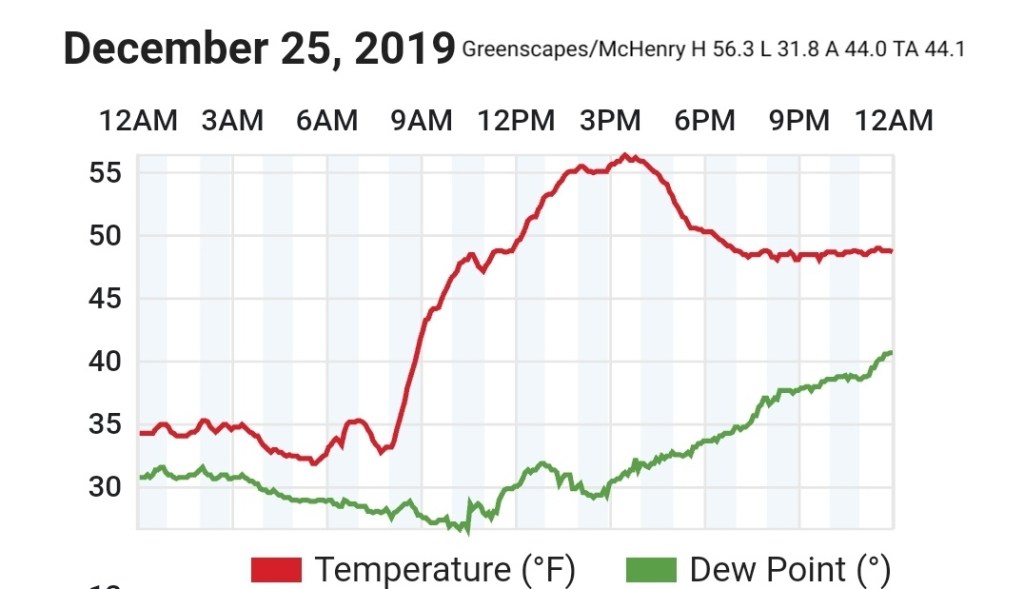
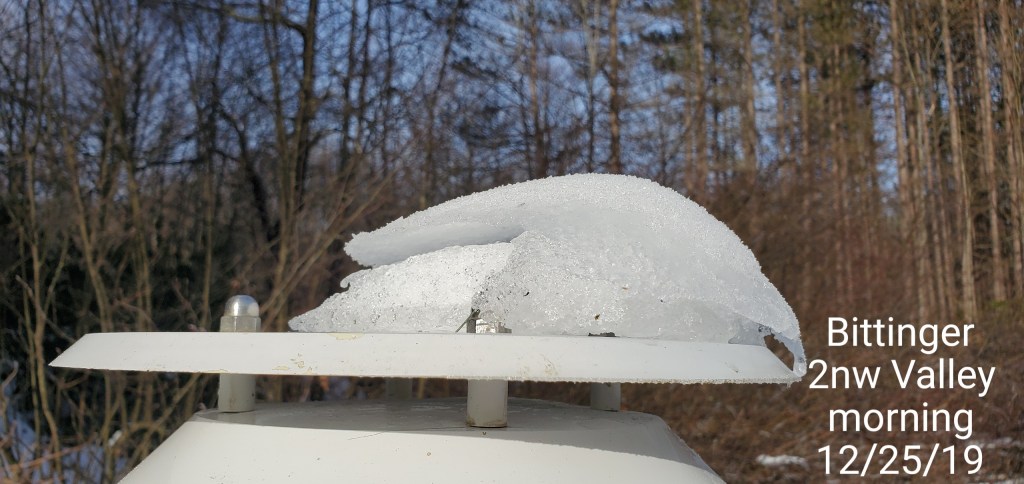
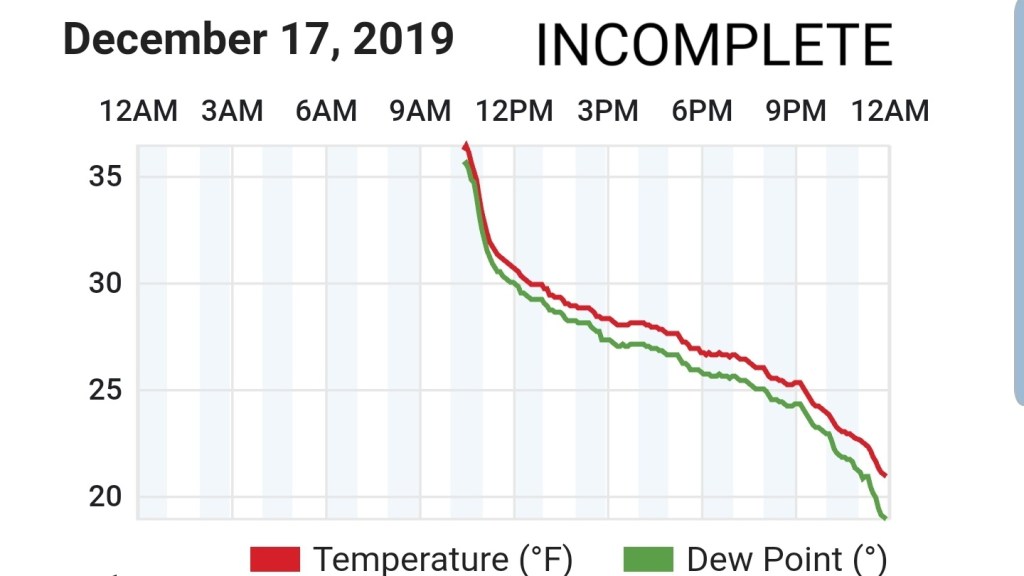
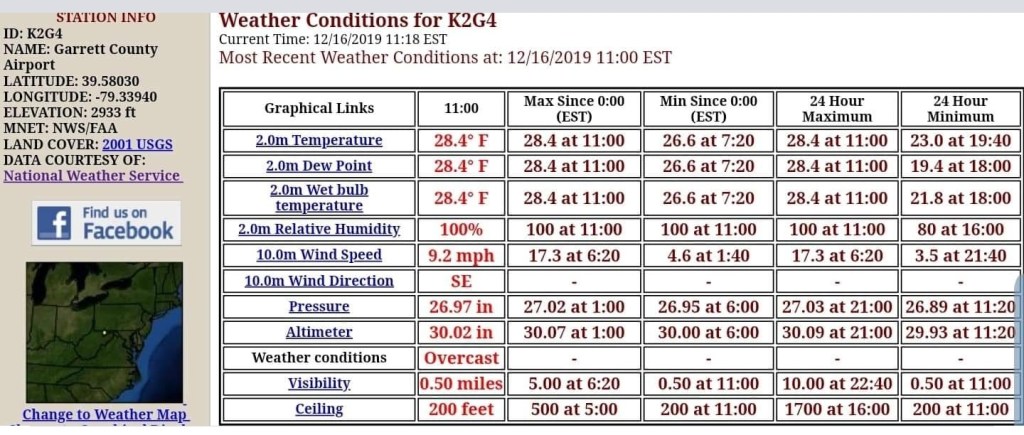
Station is down and offline. With the holiday season upon us, it may be down for a little bit. Will substitute the nearby Greenscapes station. It is a rooftop station. Not fond of rooftop stations. But for a continuation of data from a station close, it will be used.
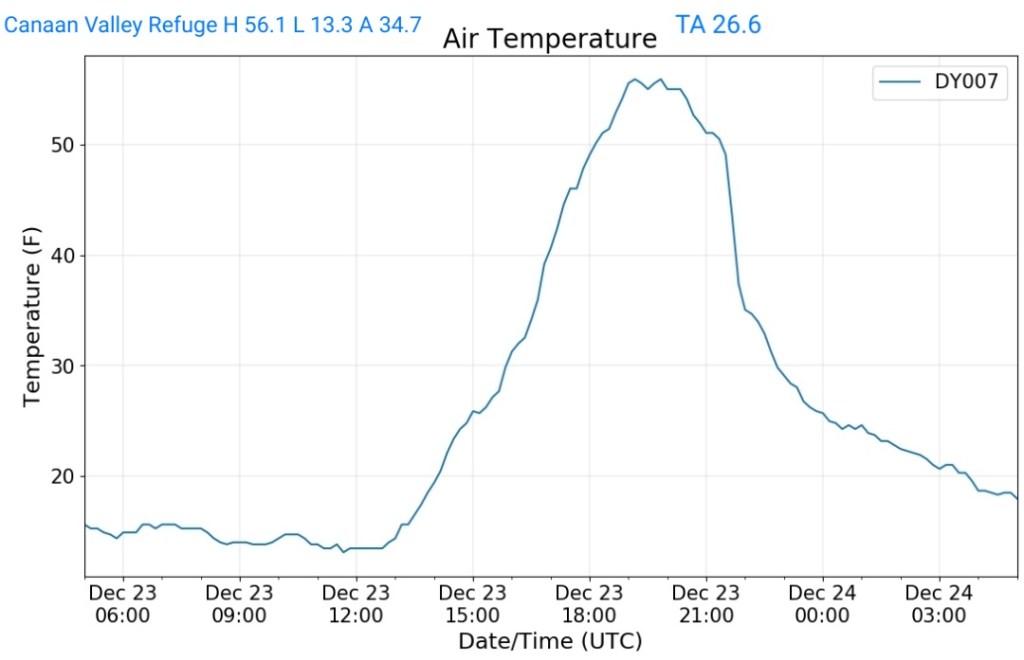
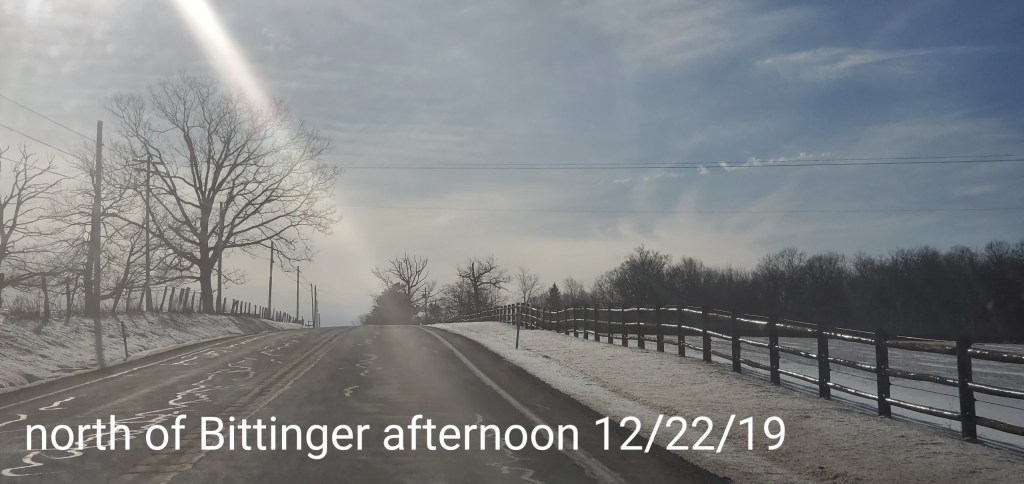
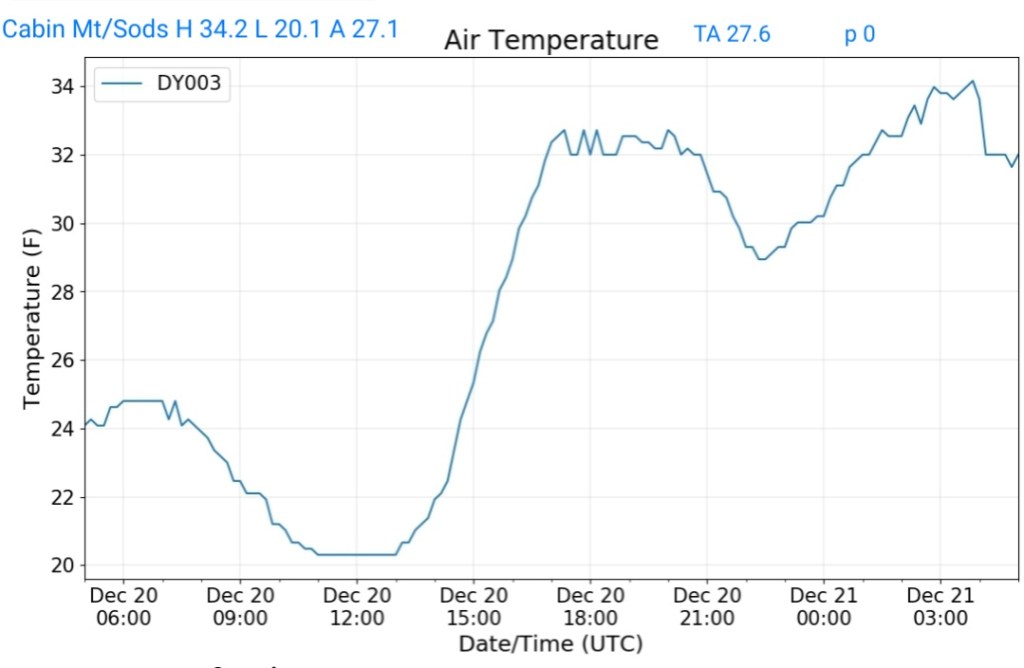
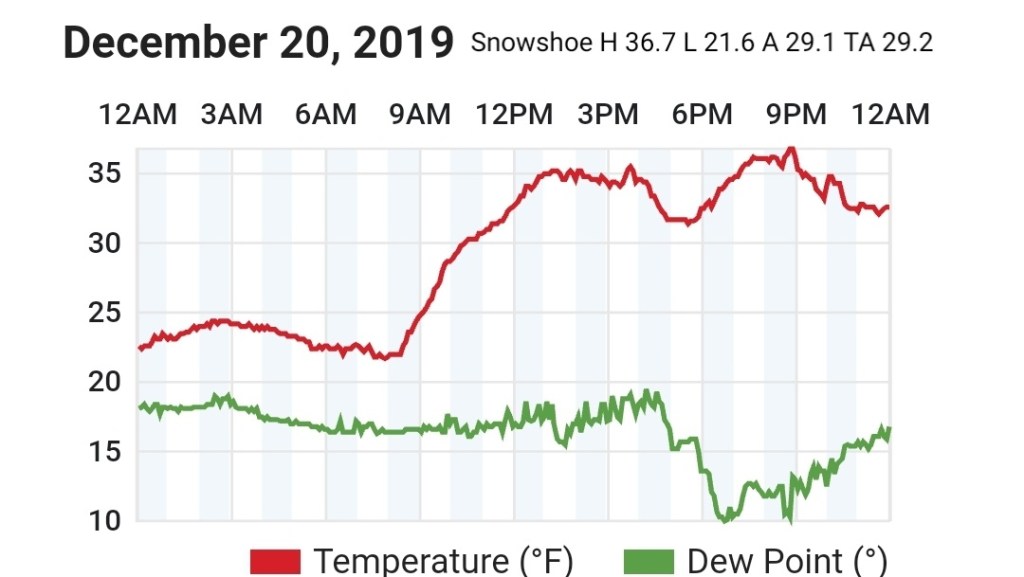
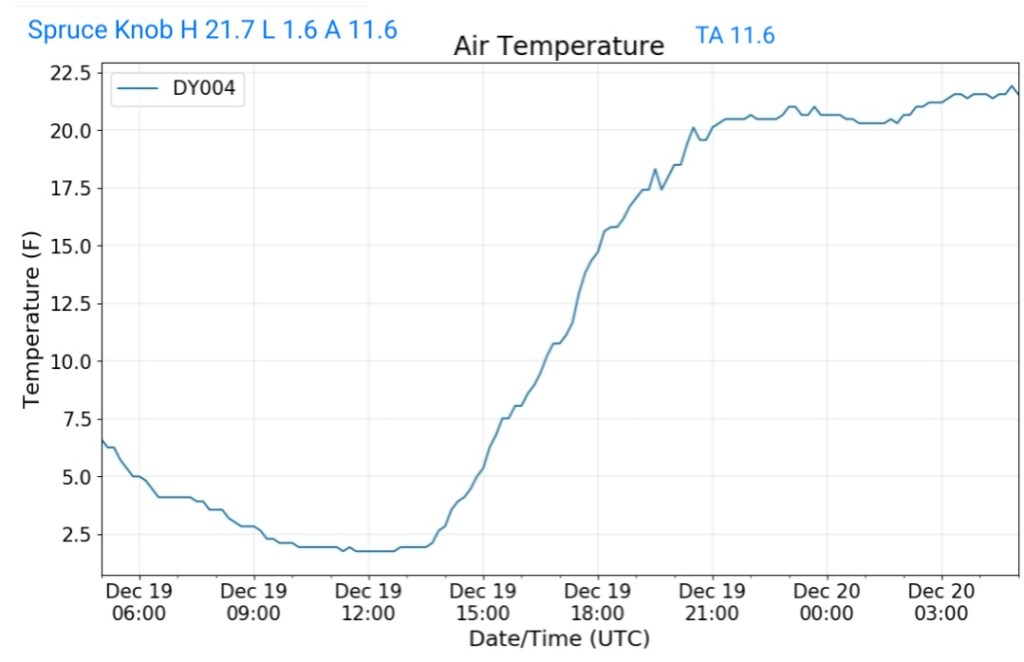
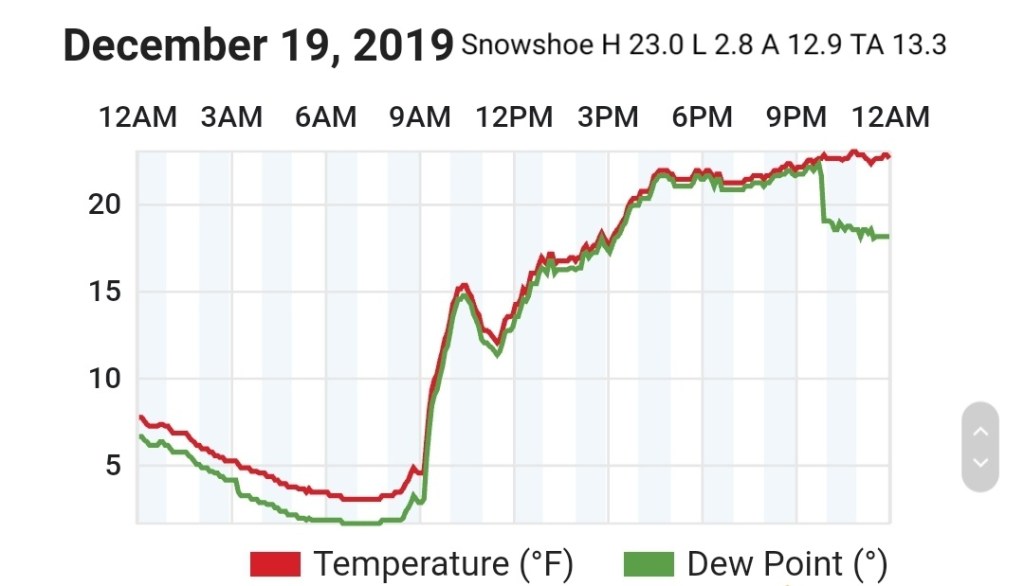
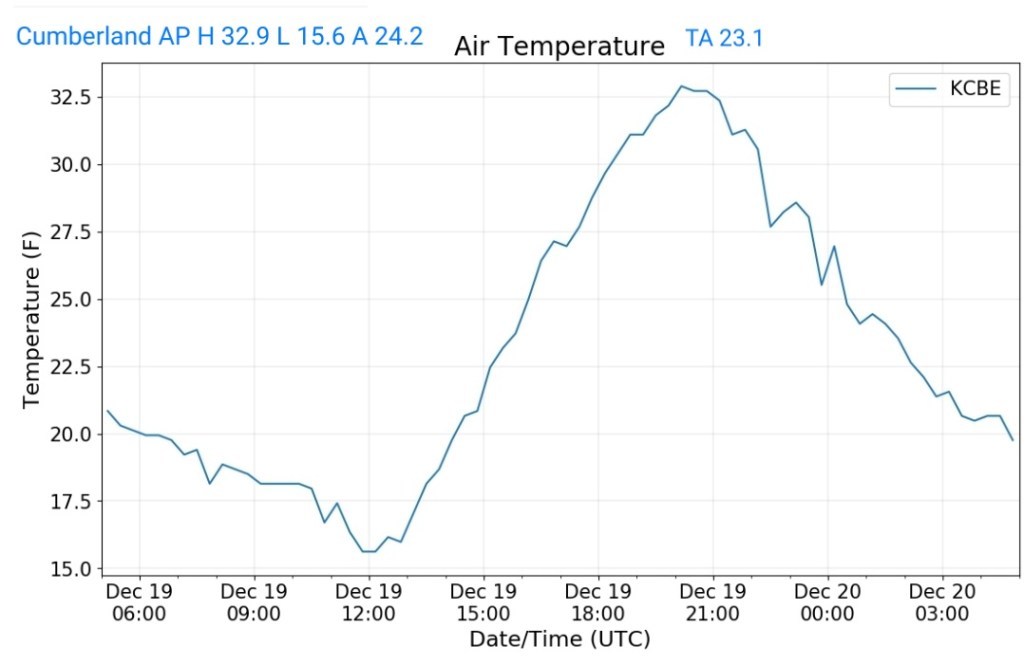
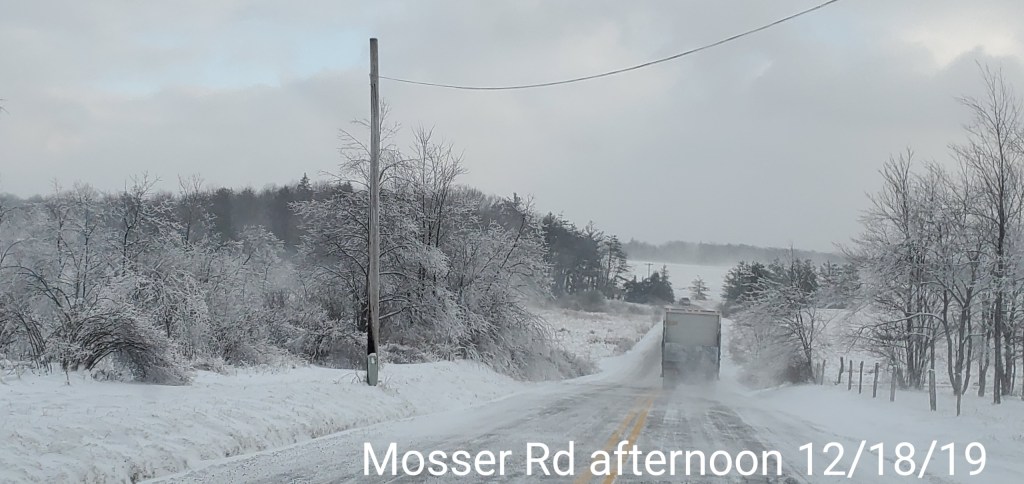
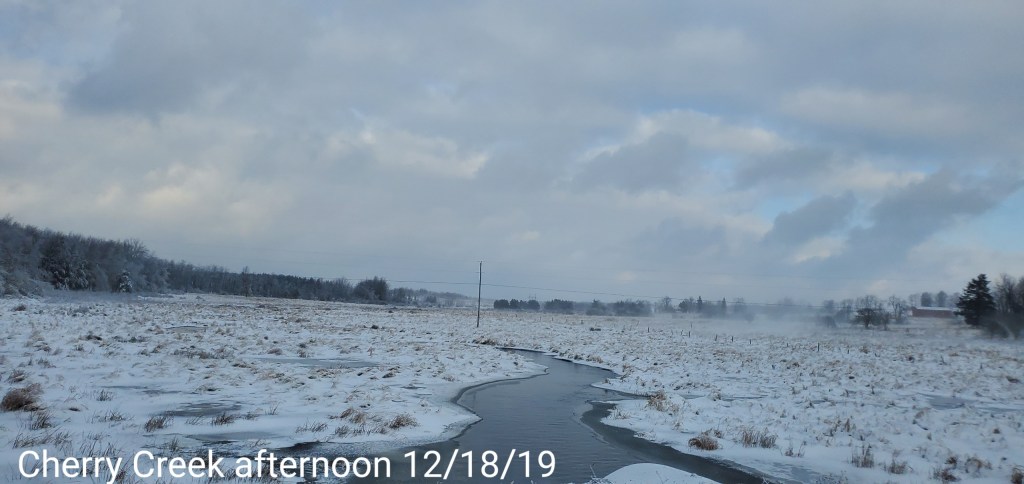
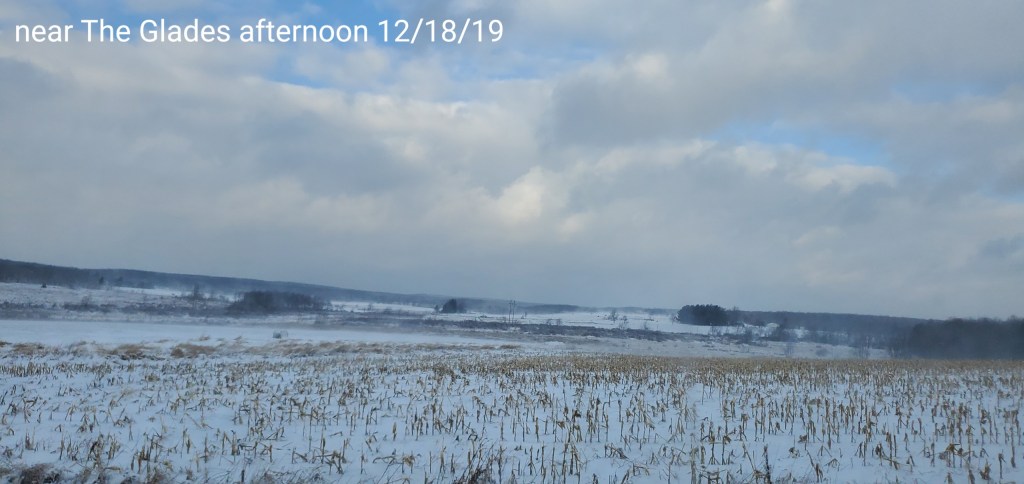
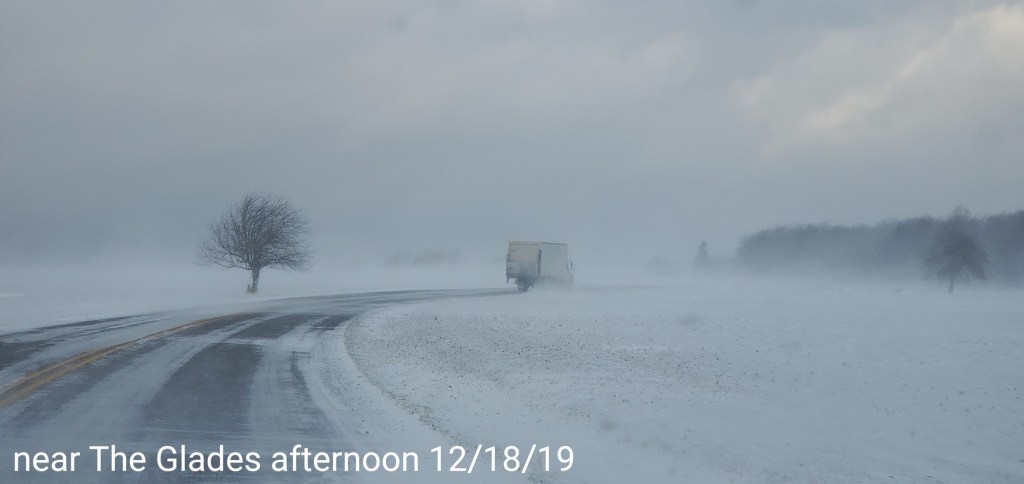
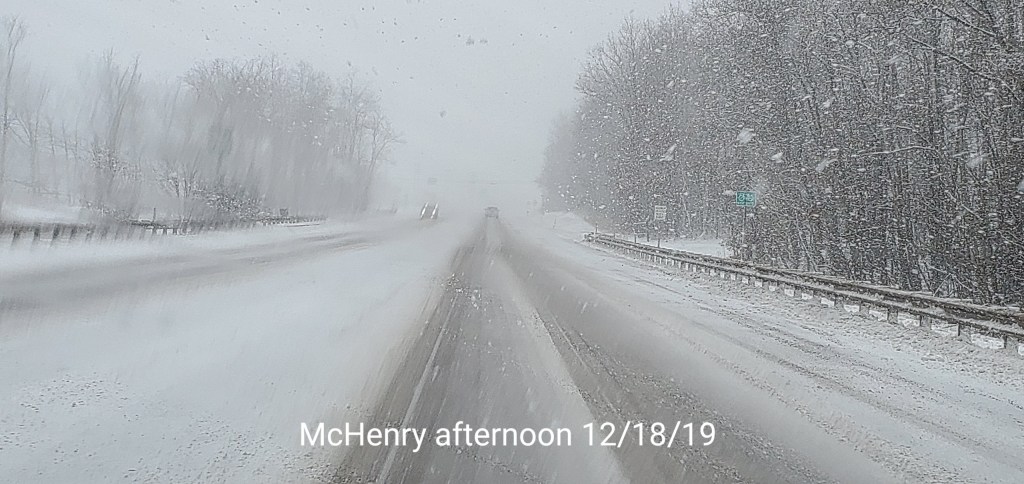
Repeat. Stagnant, boring pattern. The only excitement is the unique local climatology. Mainly the valleys that decouple and drop off low overnight, to the more sheltered colder valleys that hold cold like a supermarket cooler in the daytime. Mostly in the areas with snow cover. While some areas run 50s, these areas hold 3ps under the calm conditions.
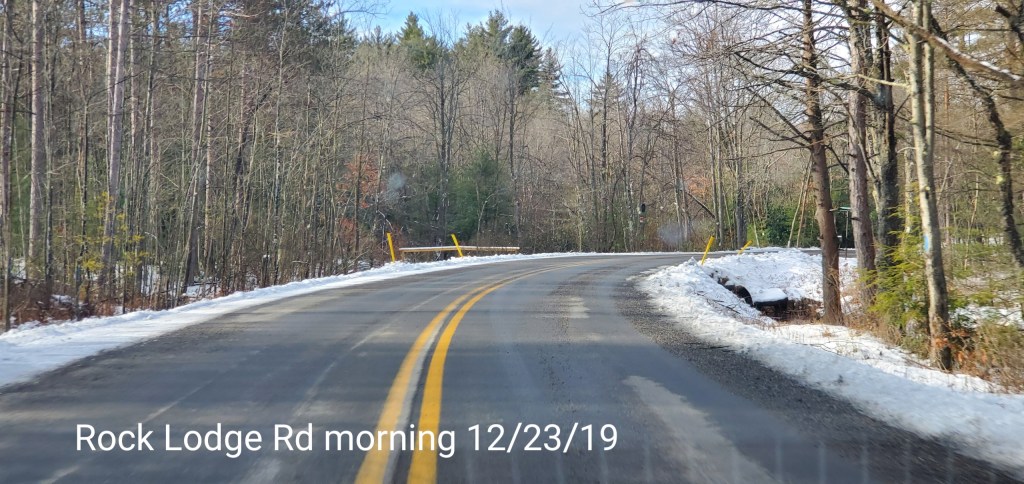
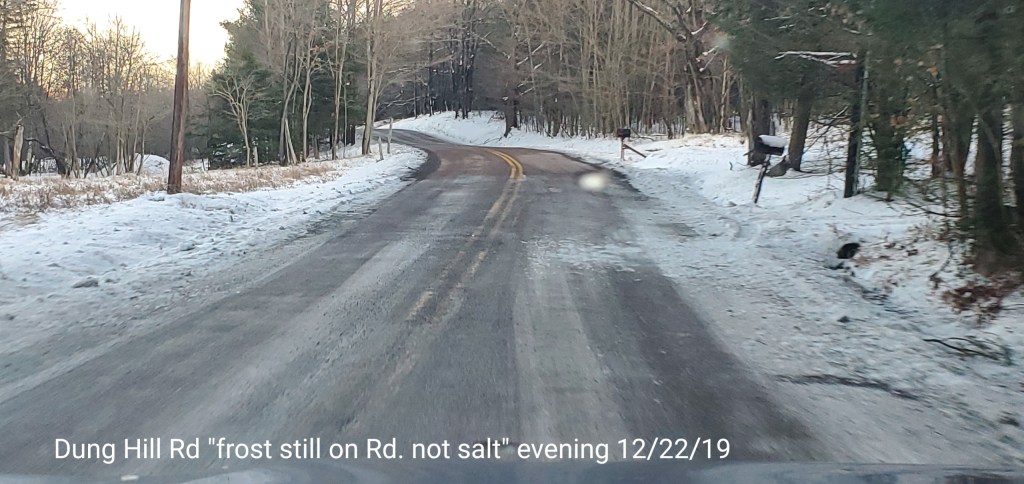
Also to note, patchy black ice in deep valleys this a.m
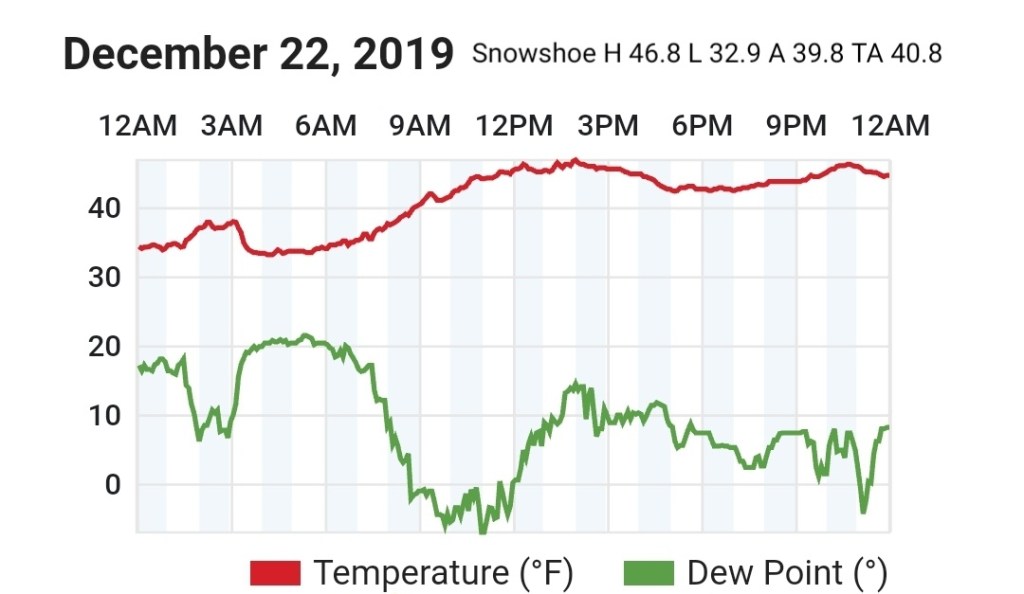
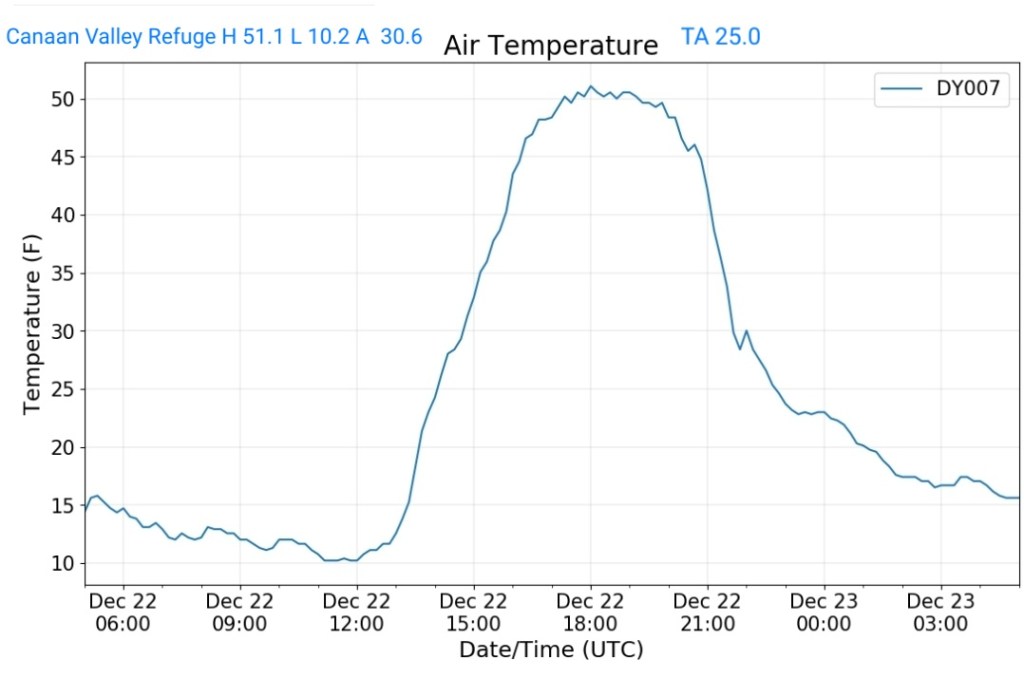
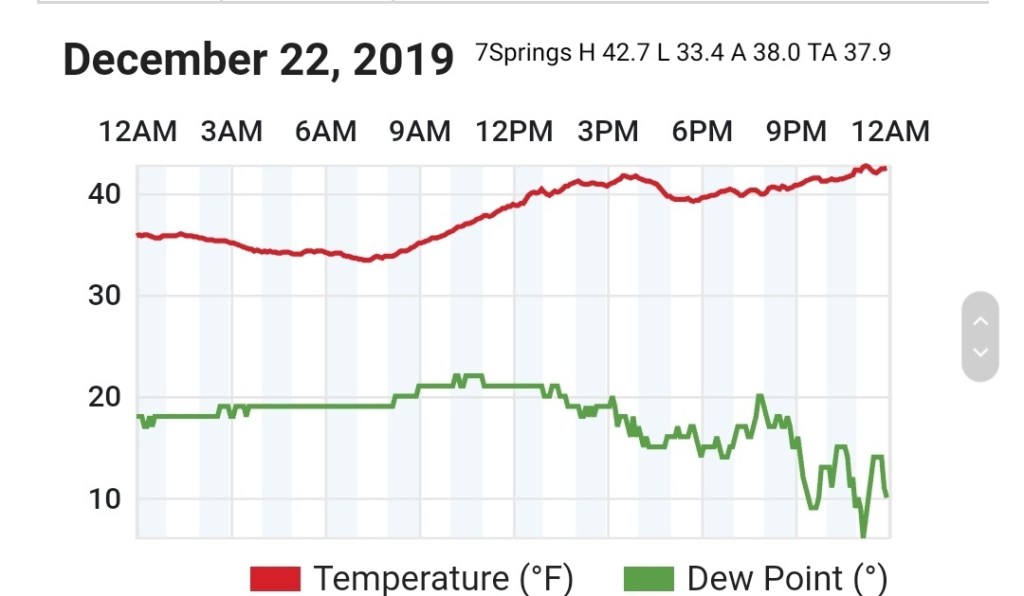
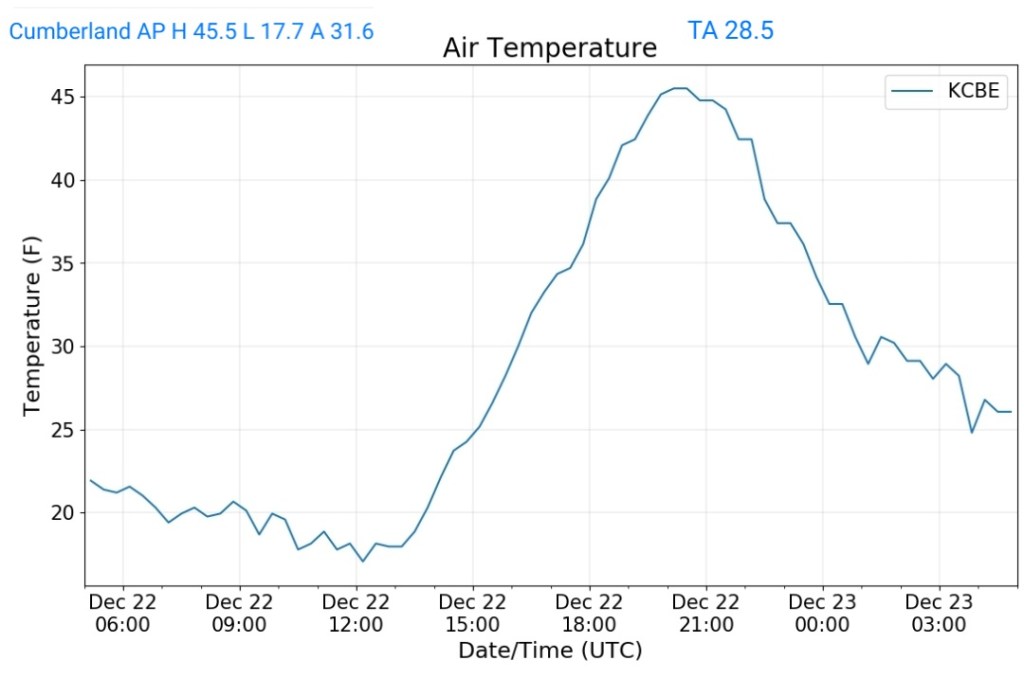
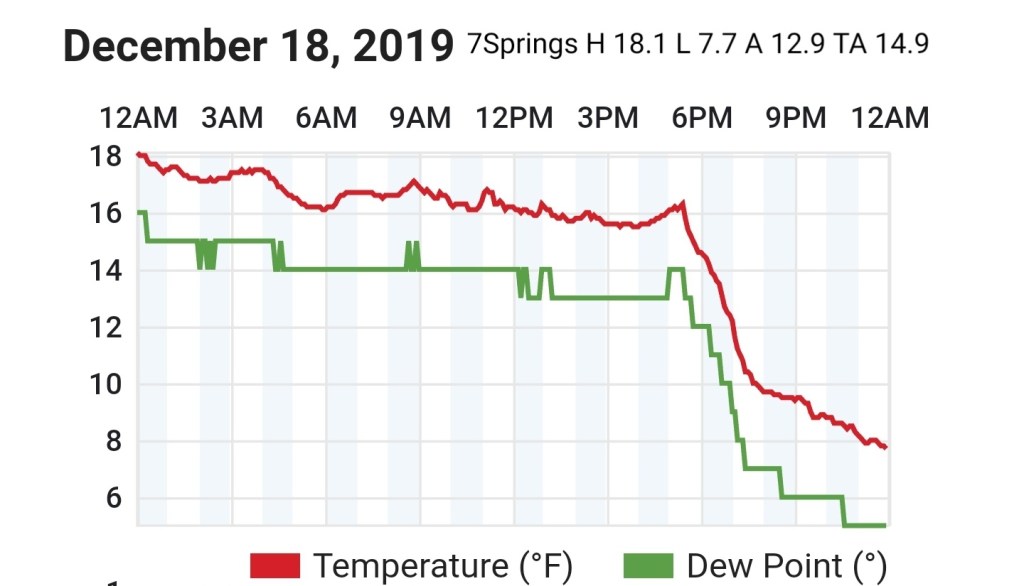
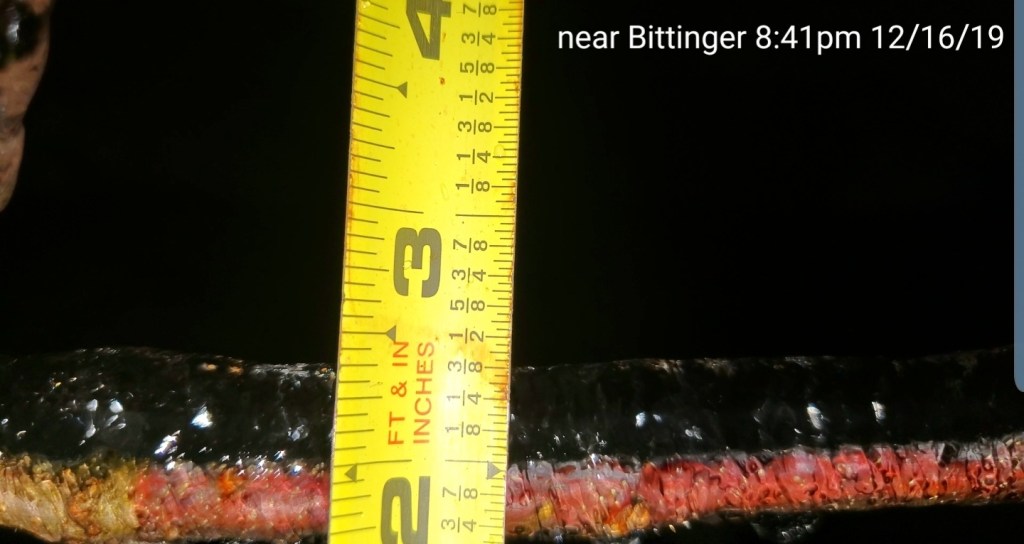
Morning hardpack average depth at slightly over 3″
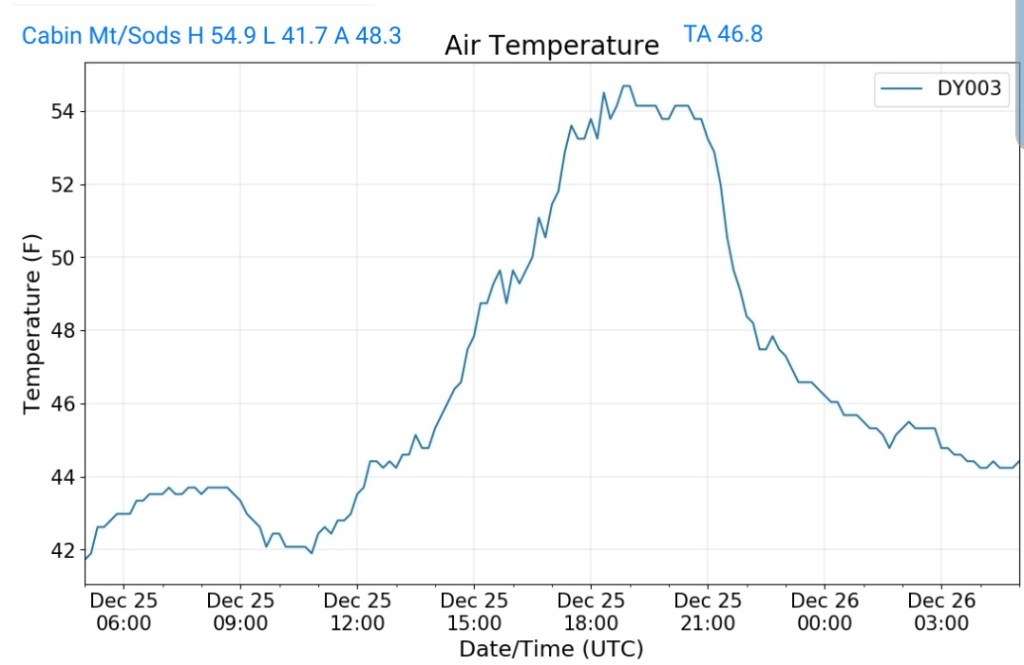
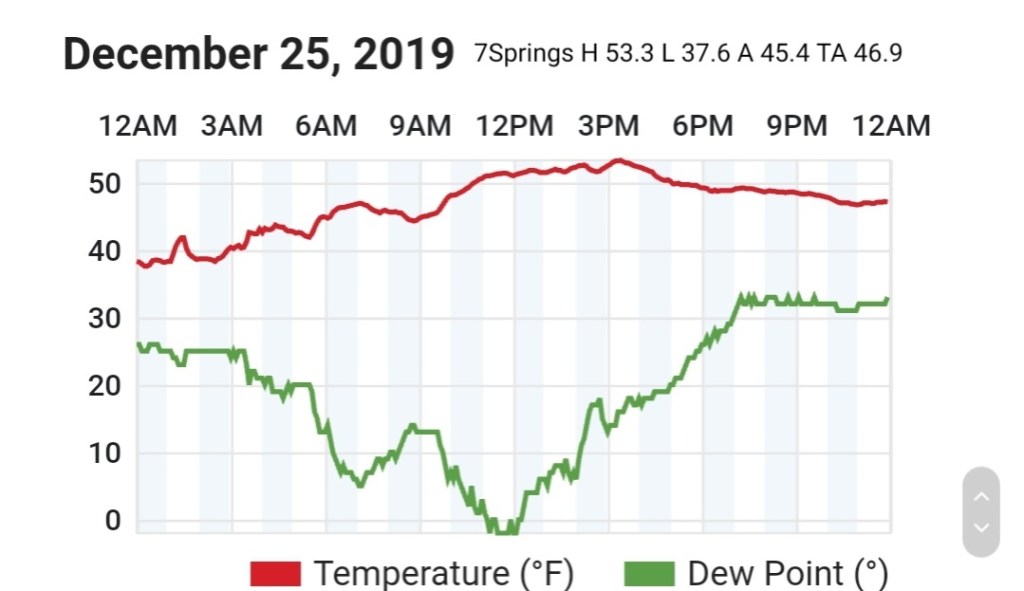
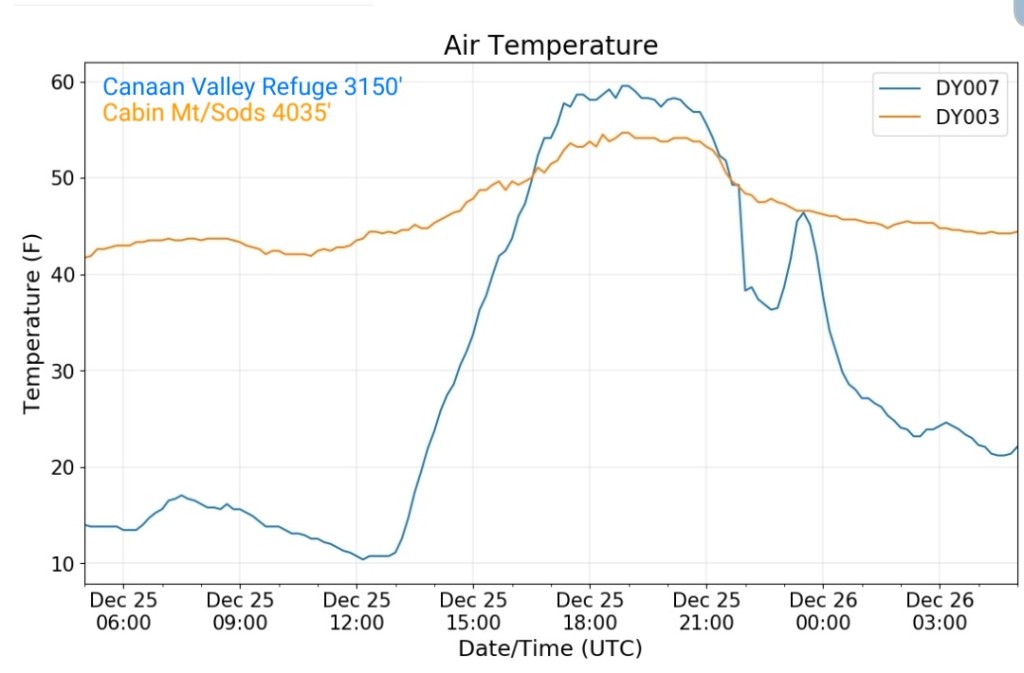
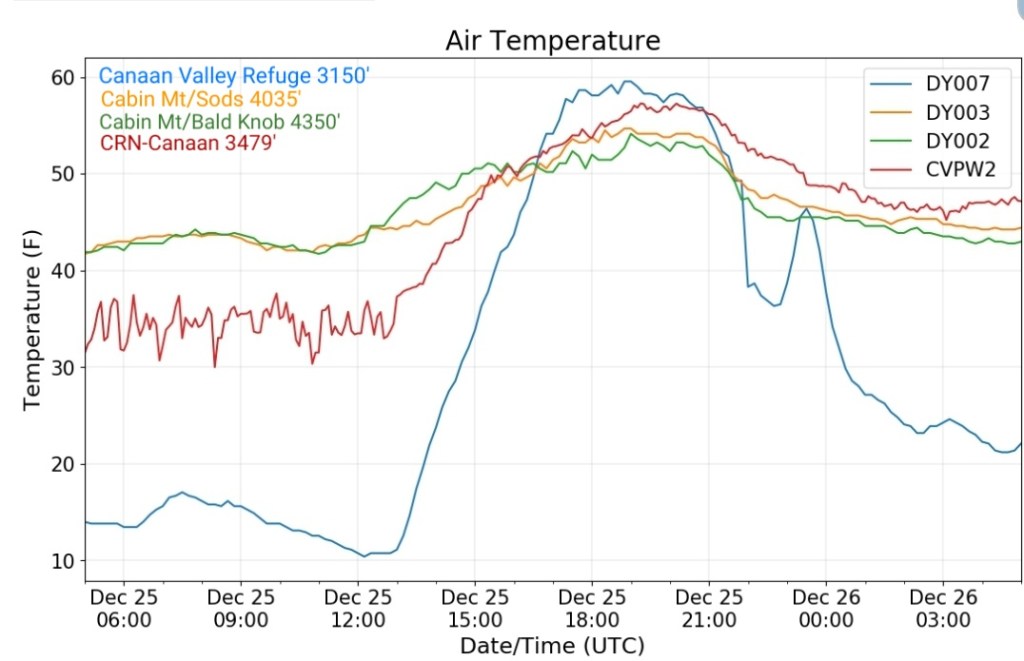
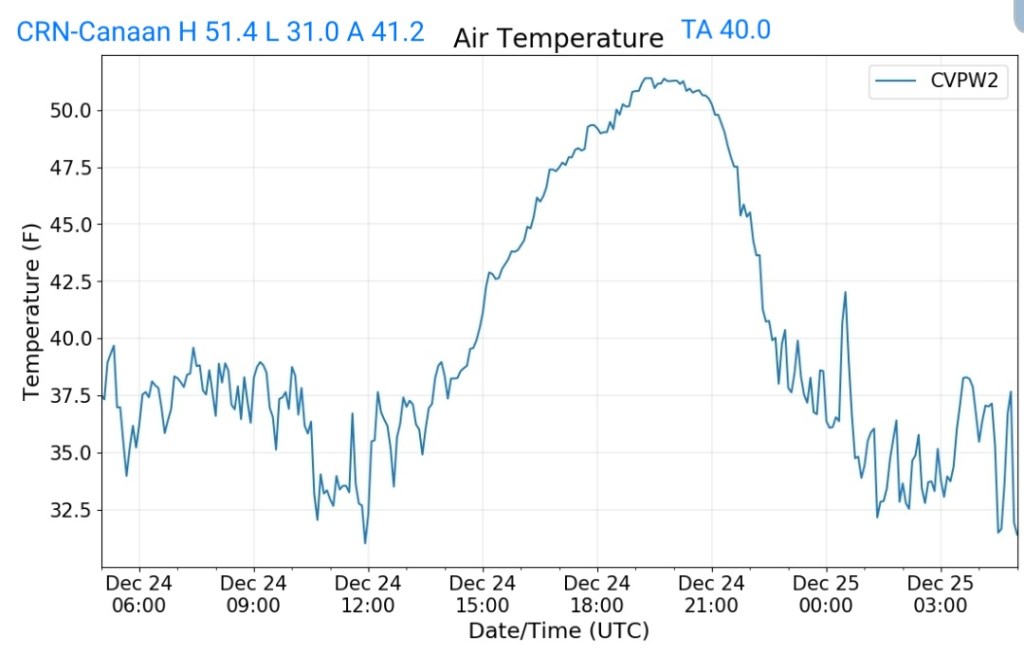
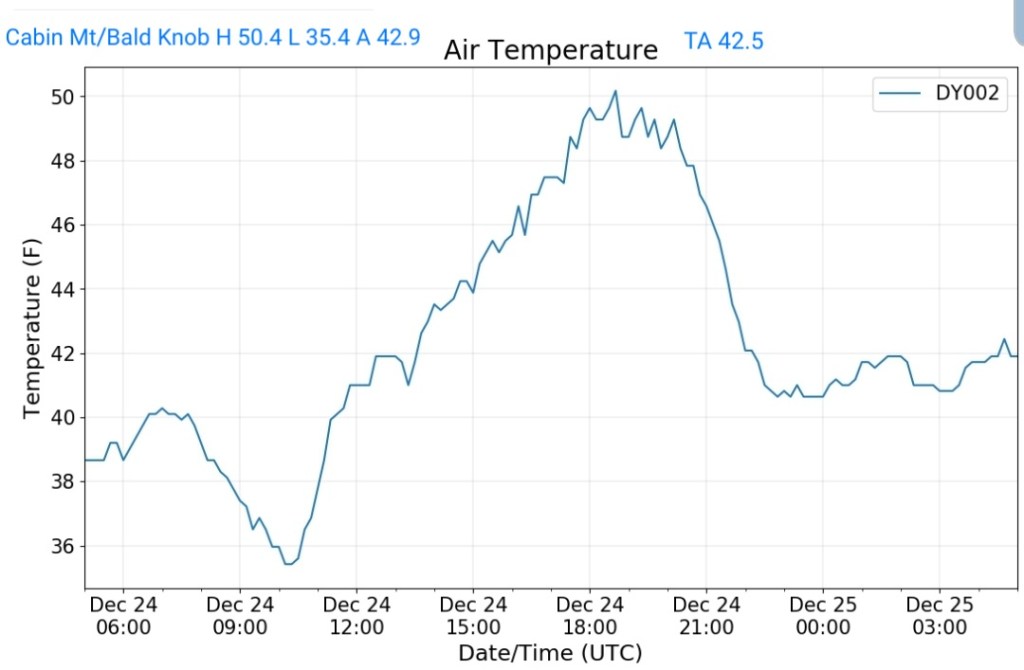
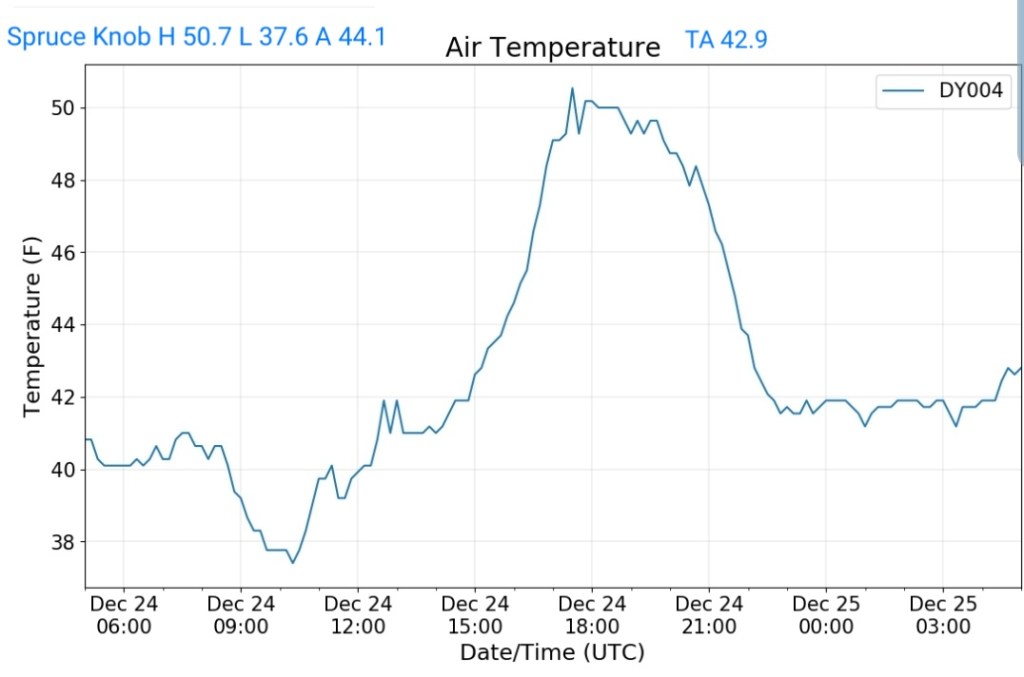
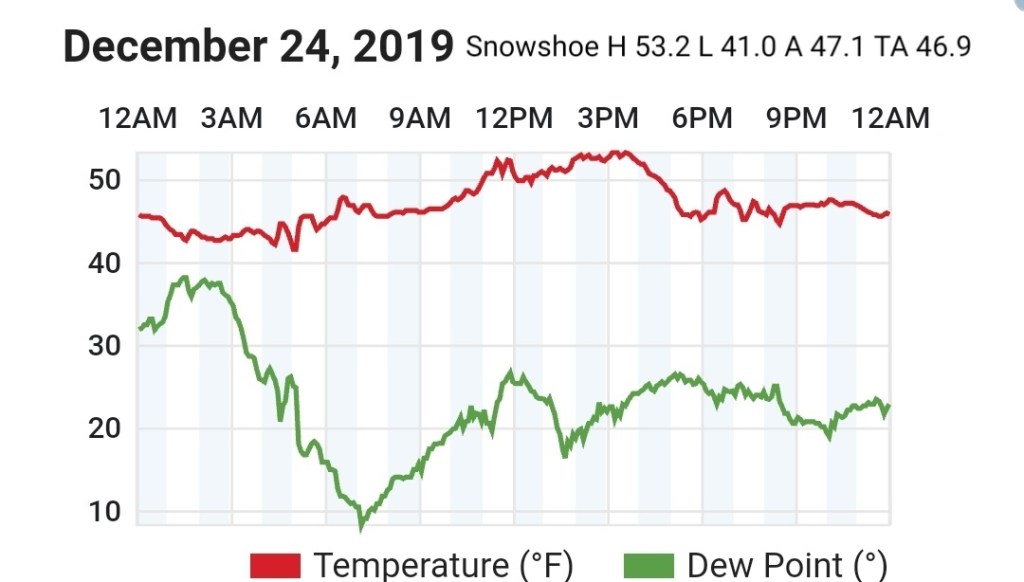
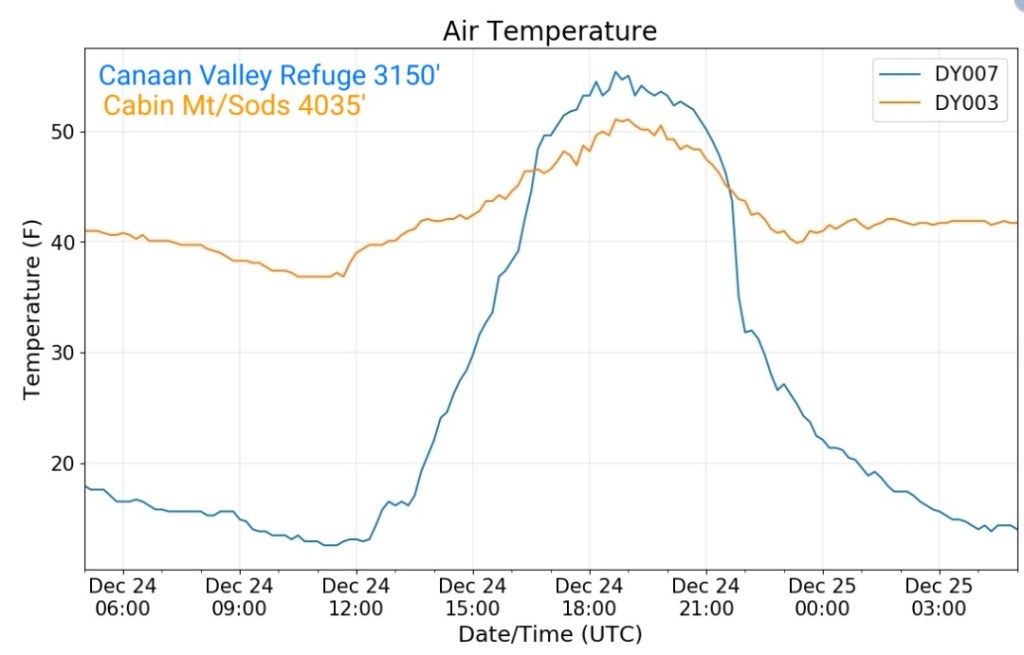
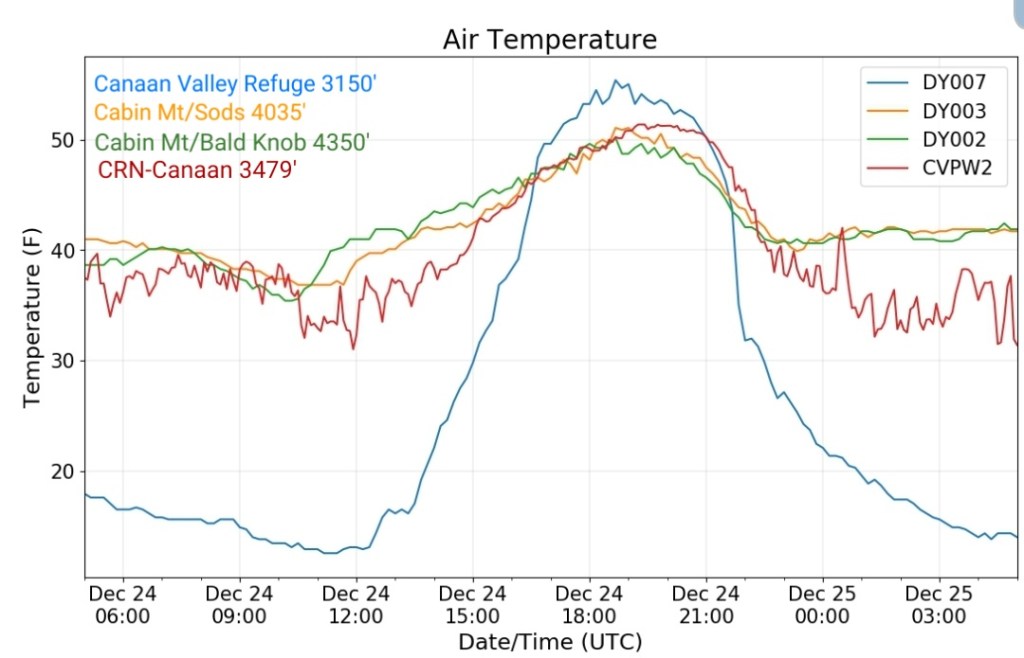
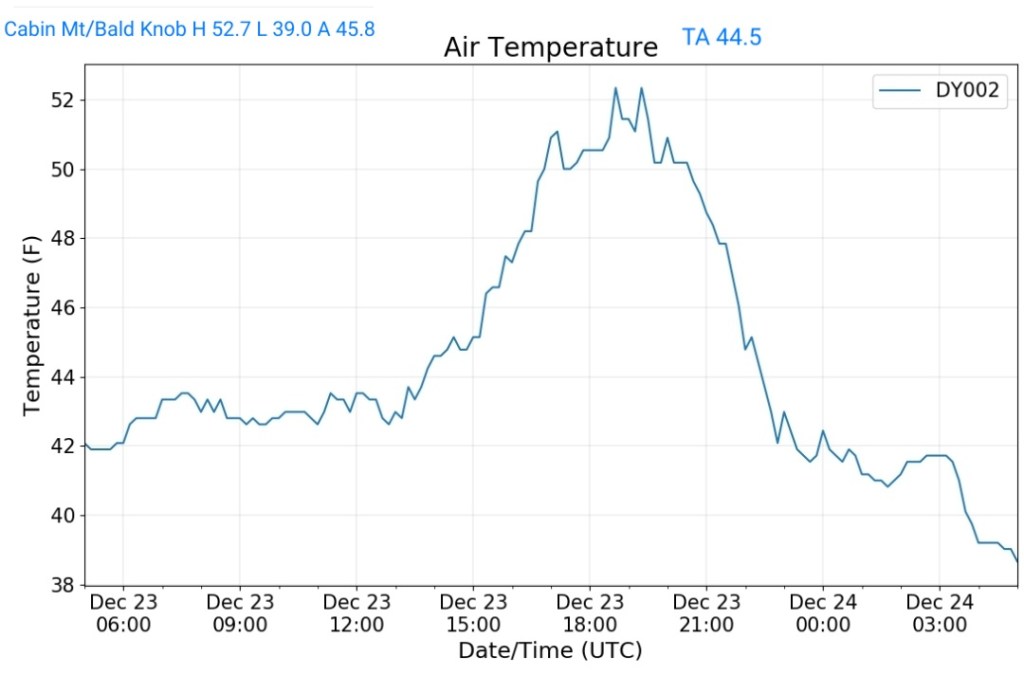
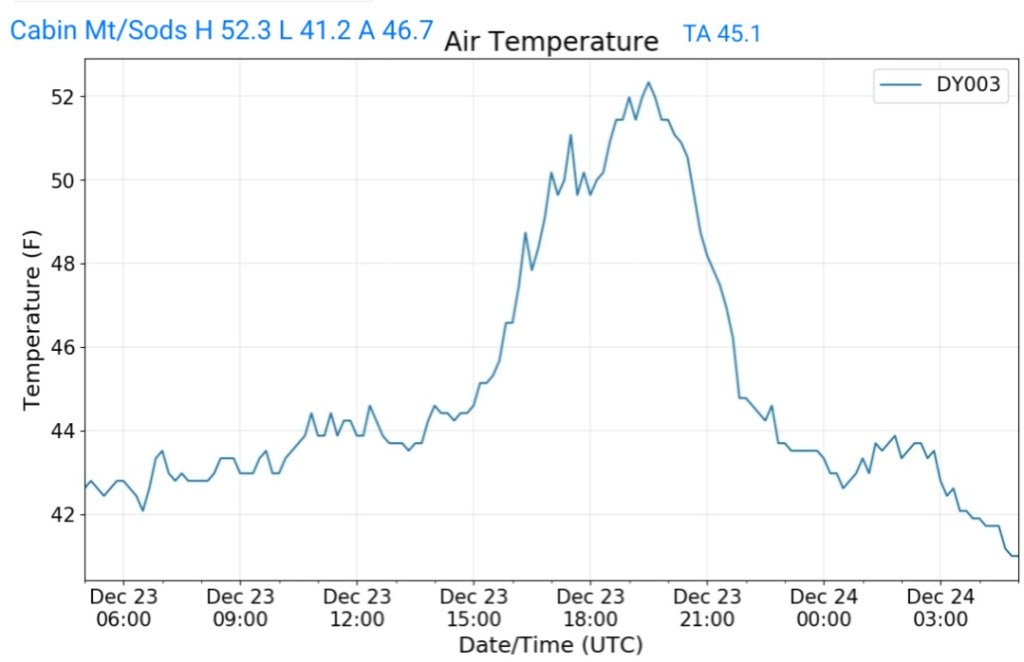
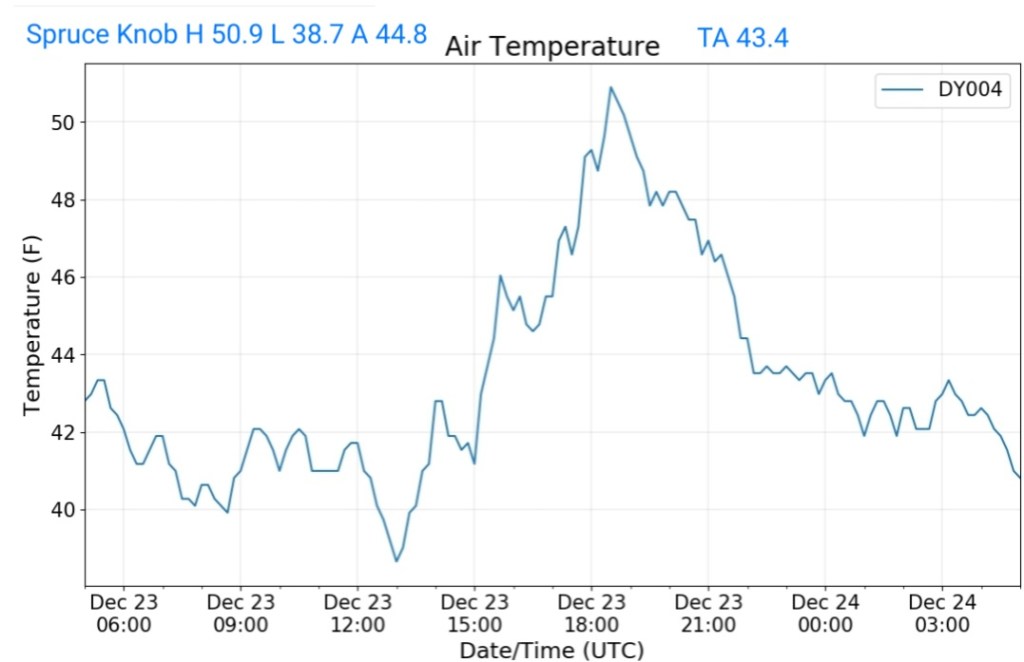
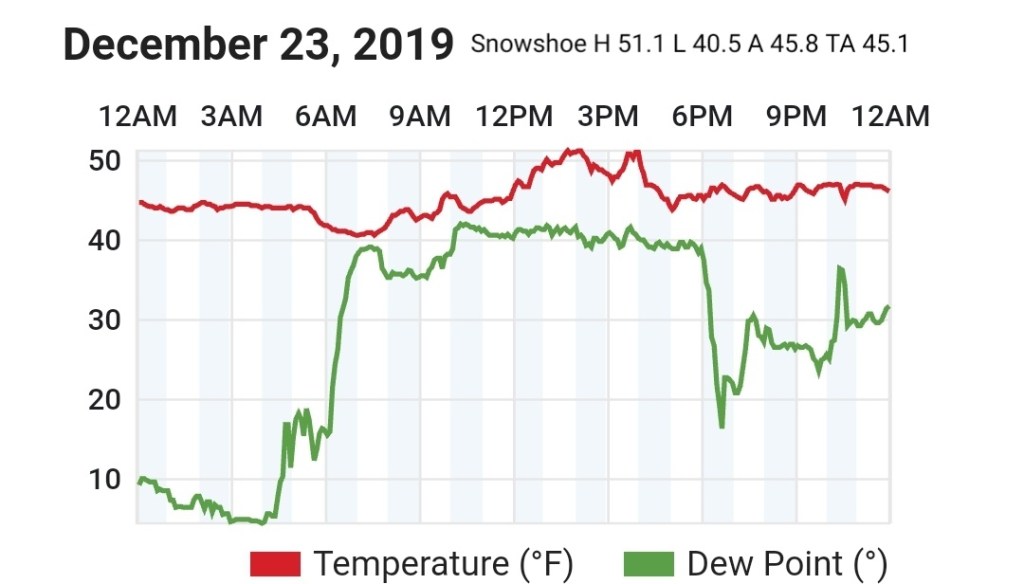
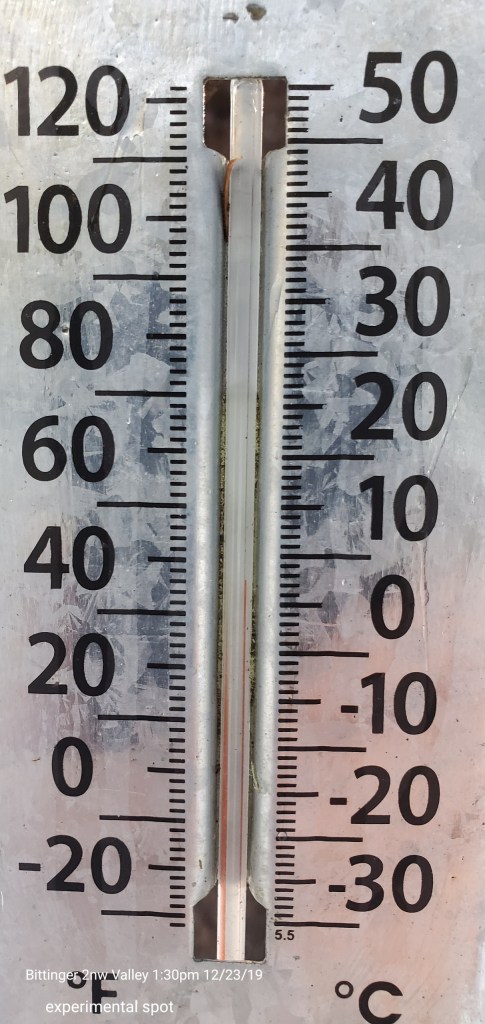
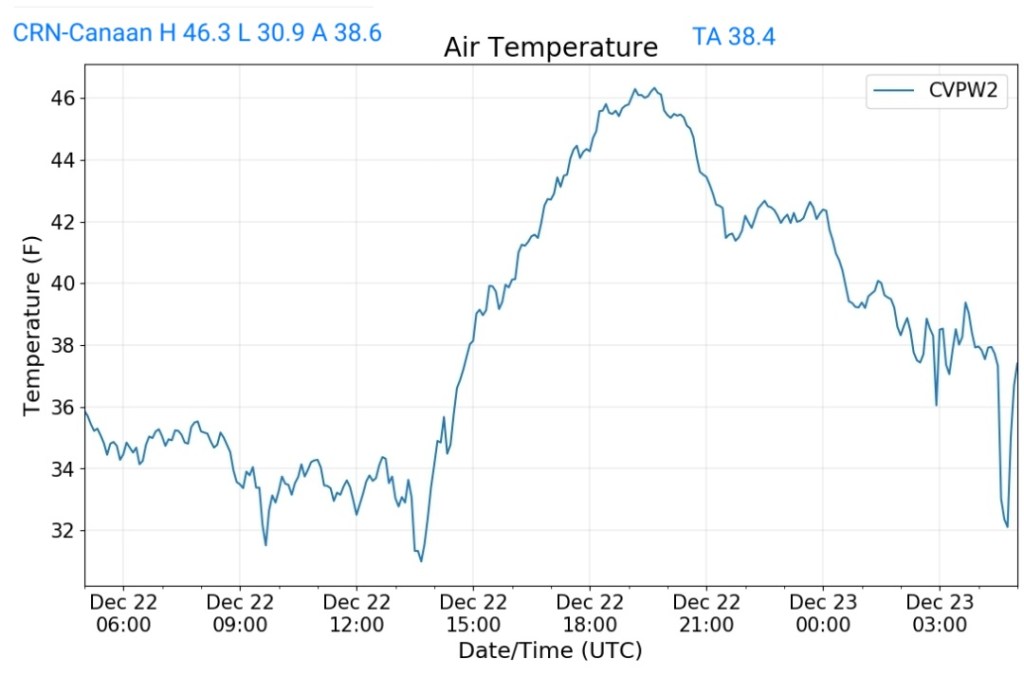
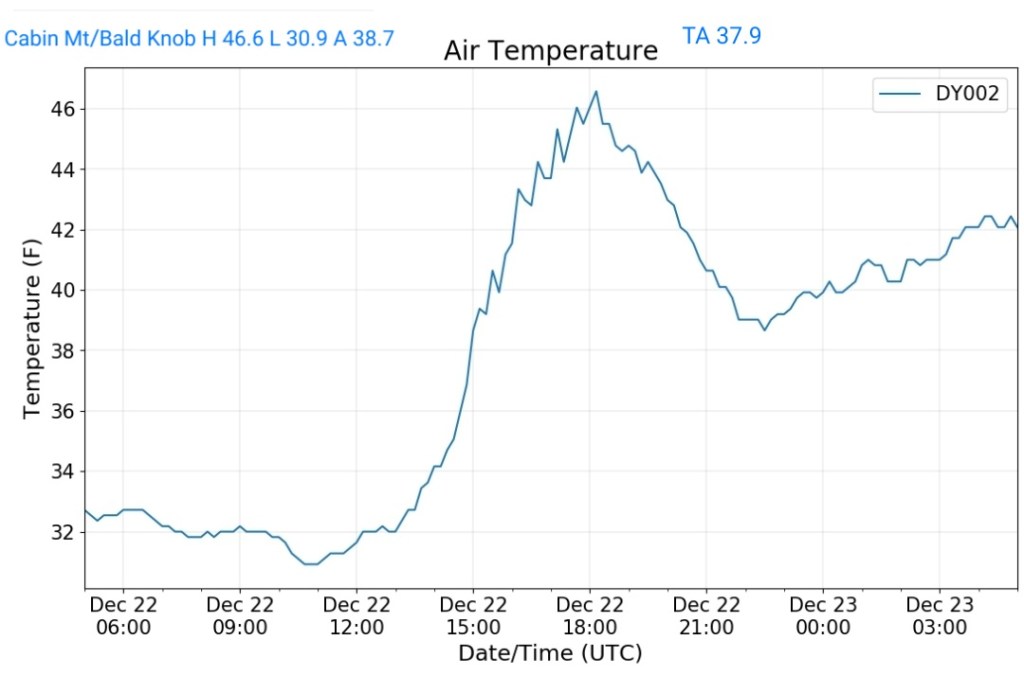
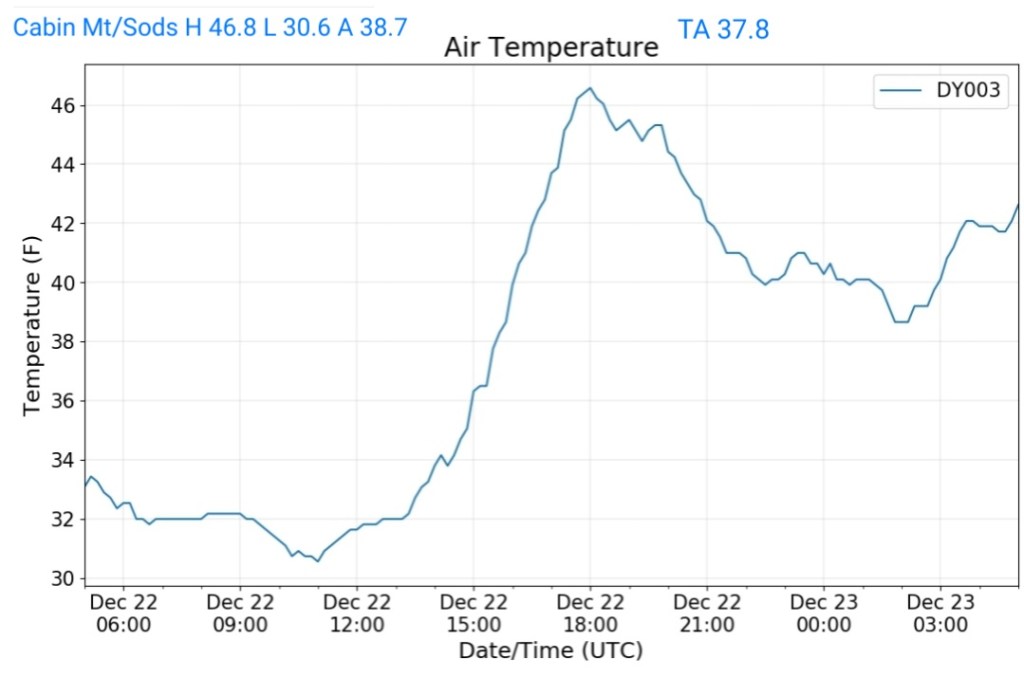
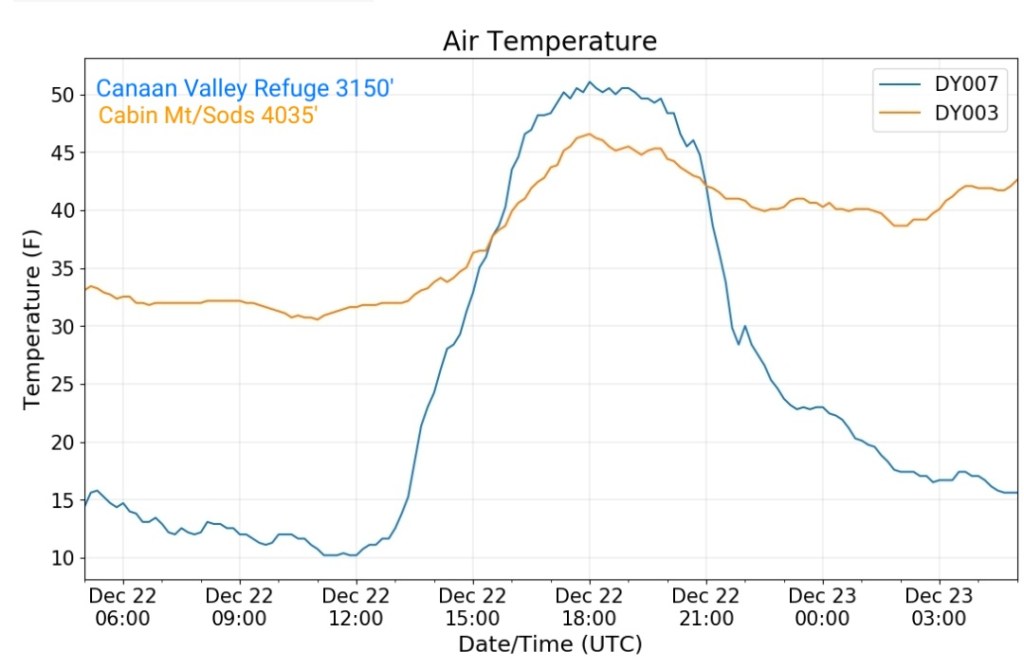
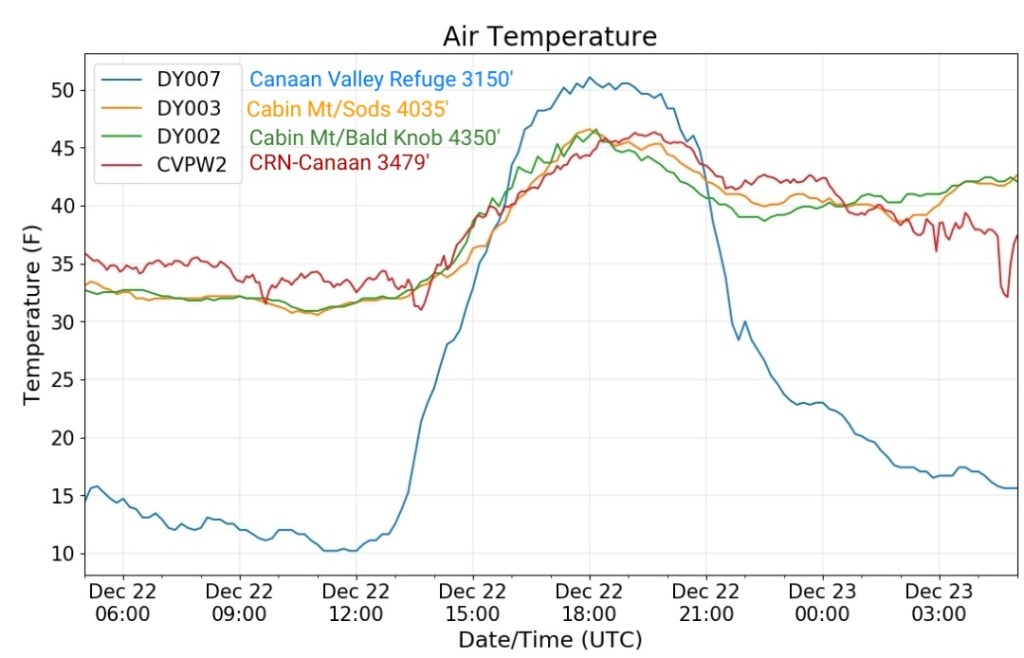
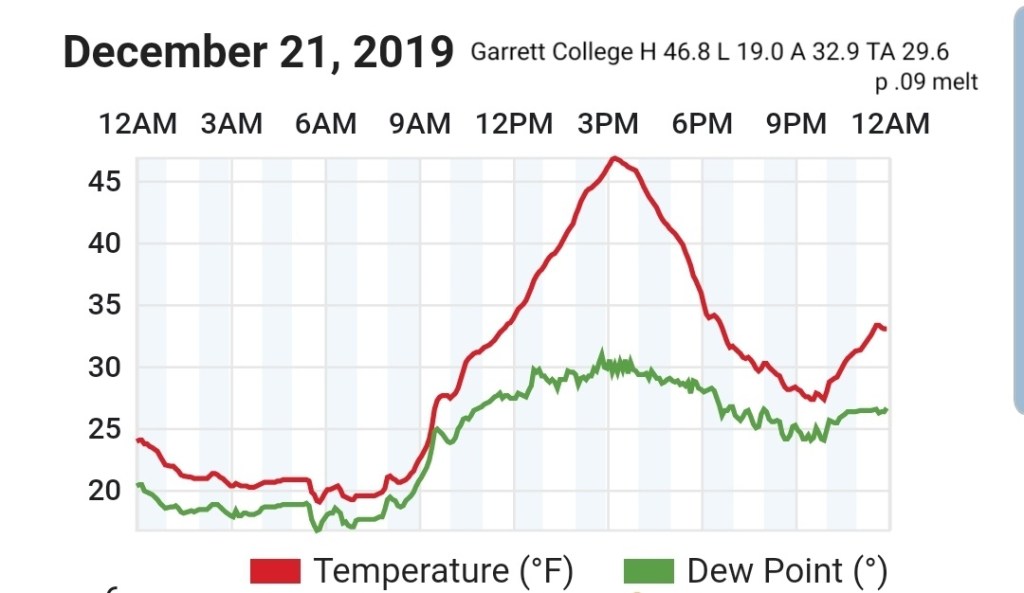
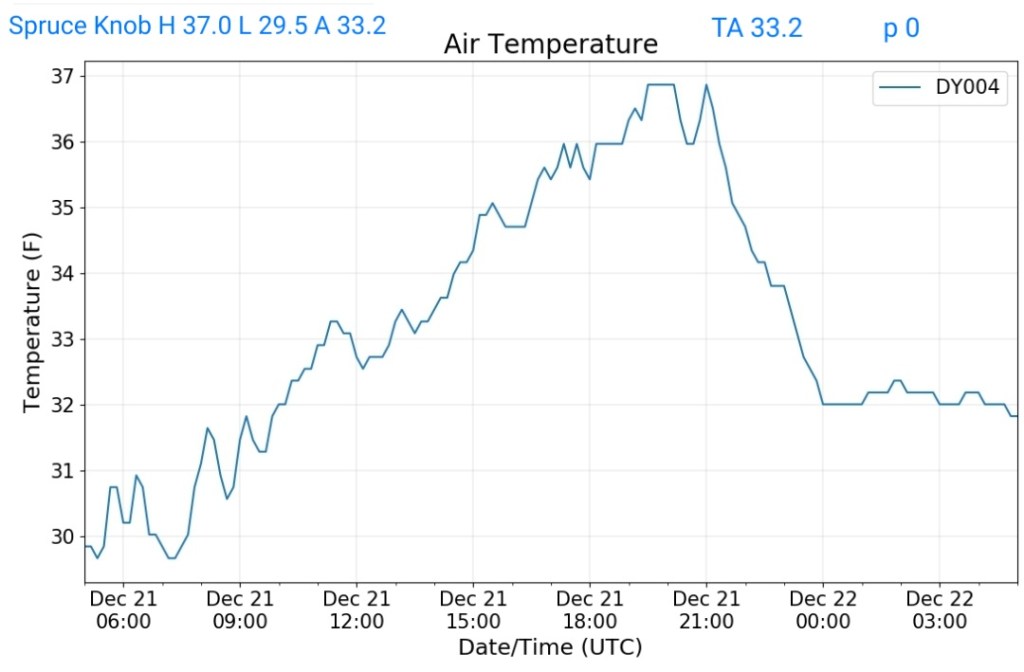
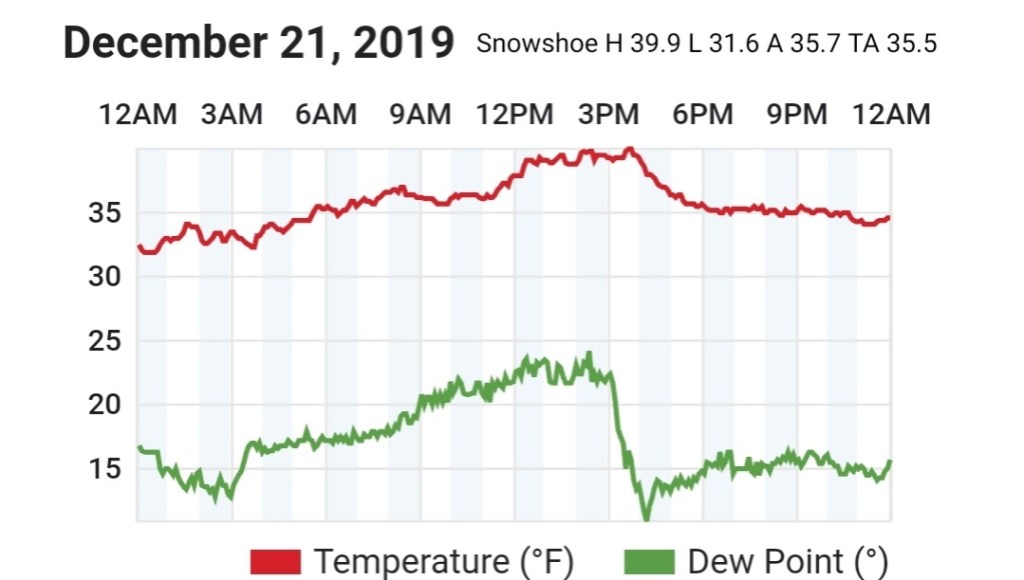
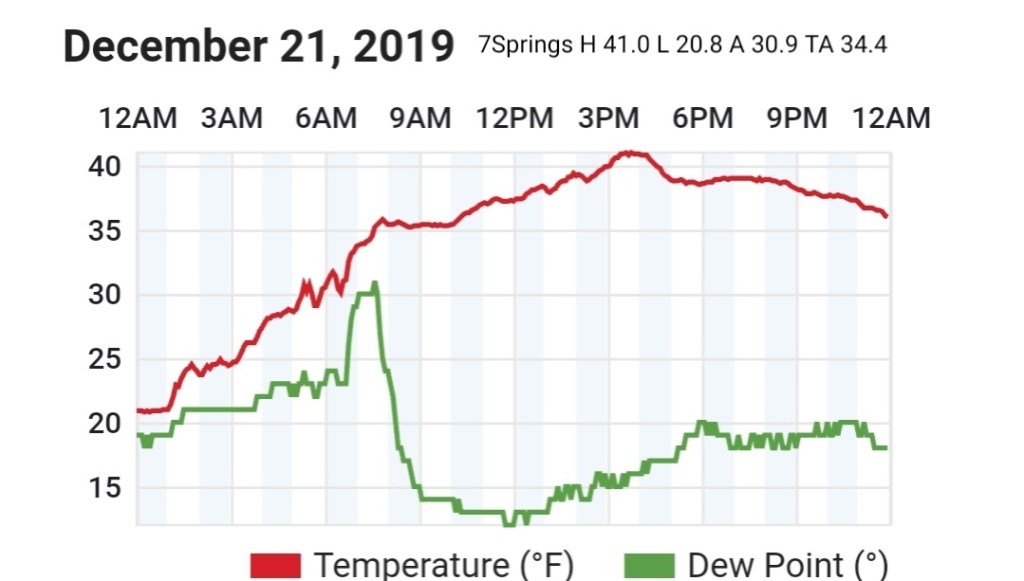
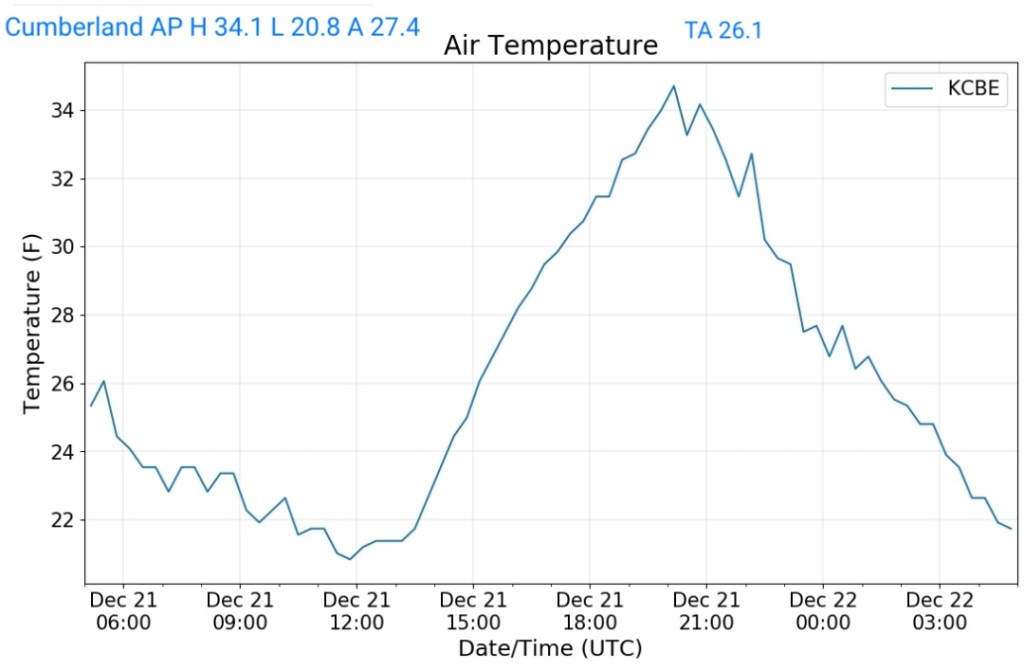
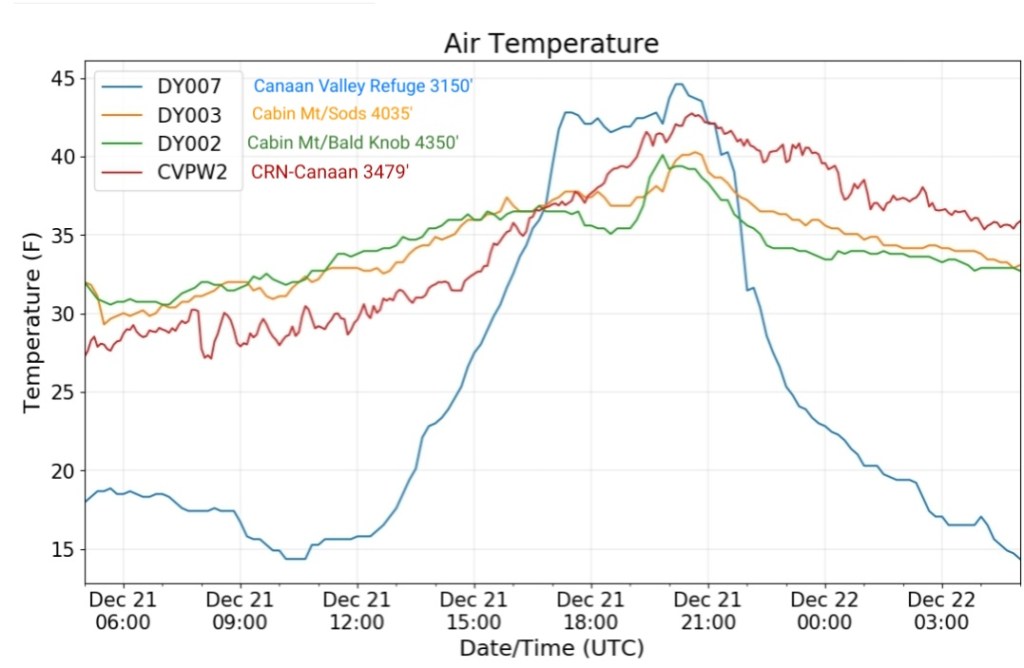
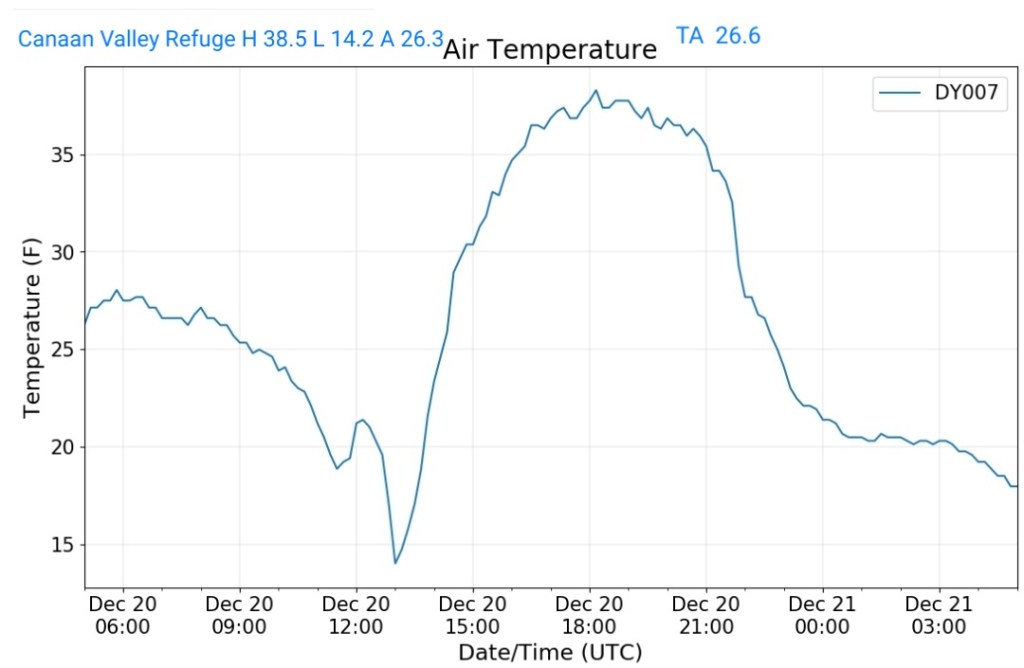
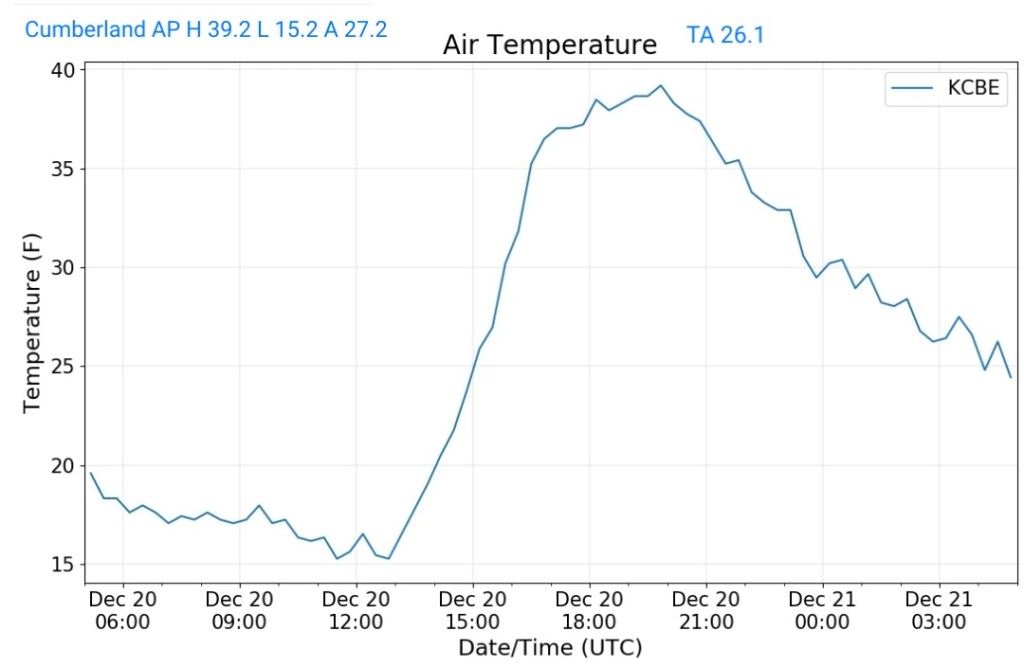
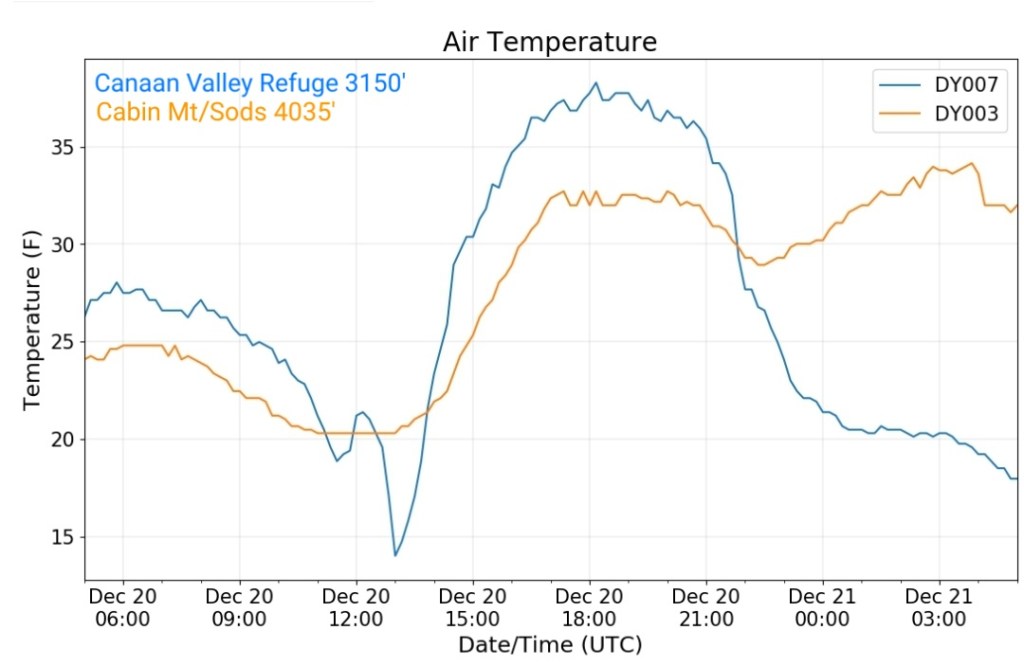
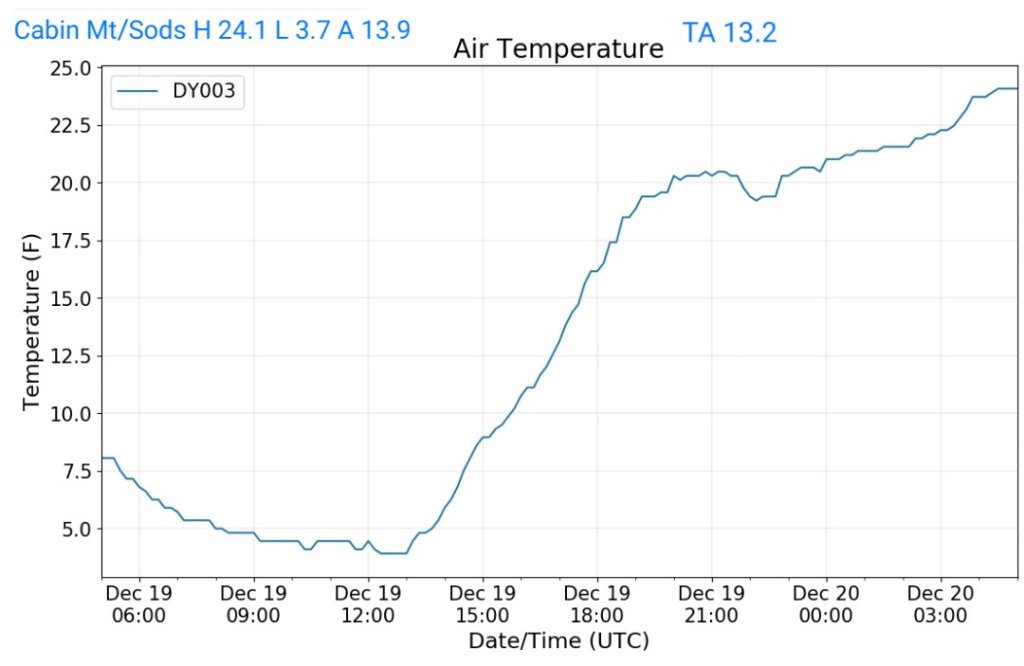
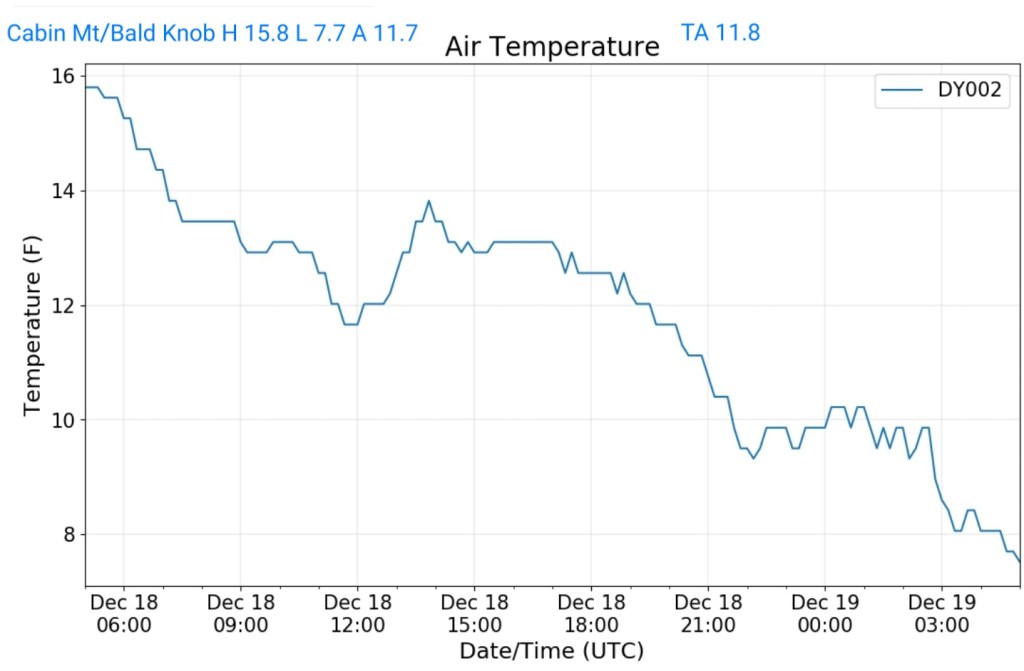
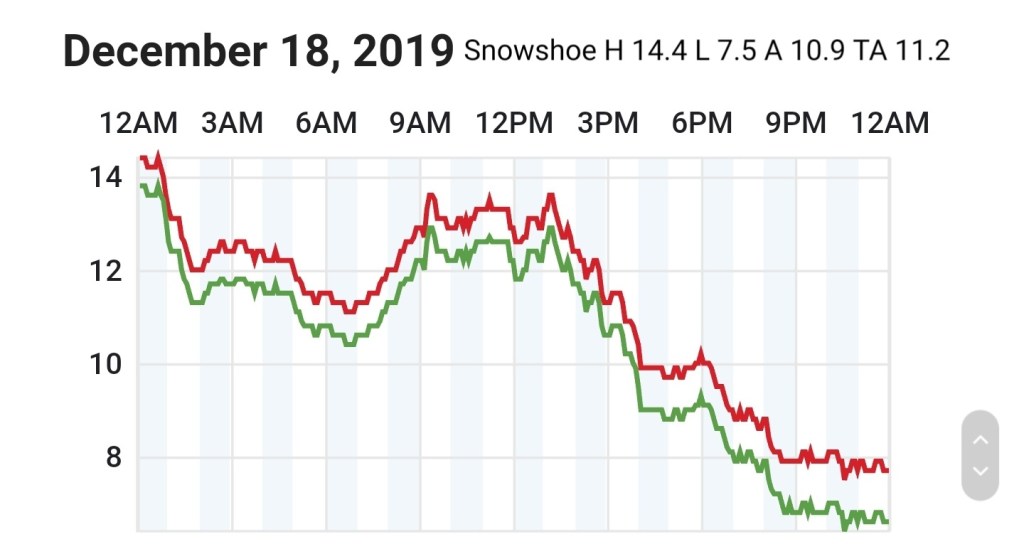
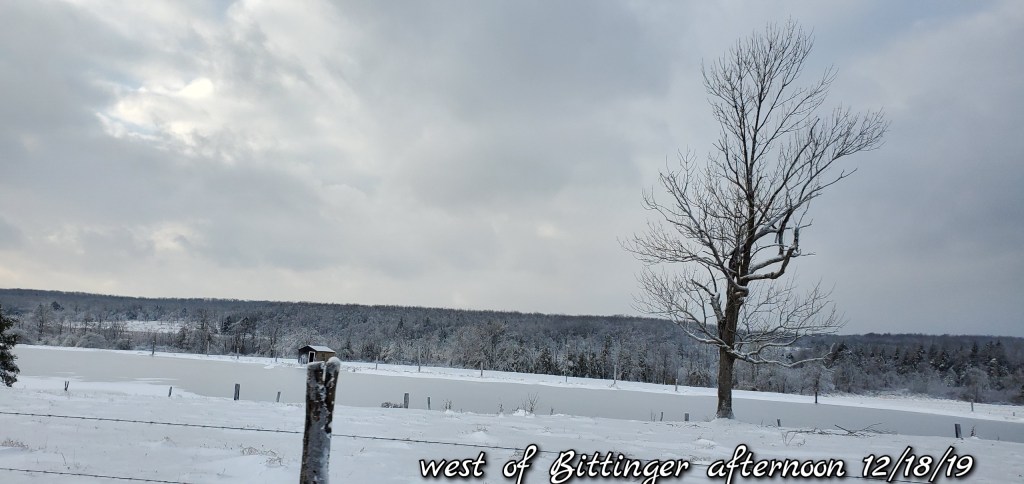
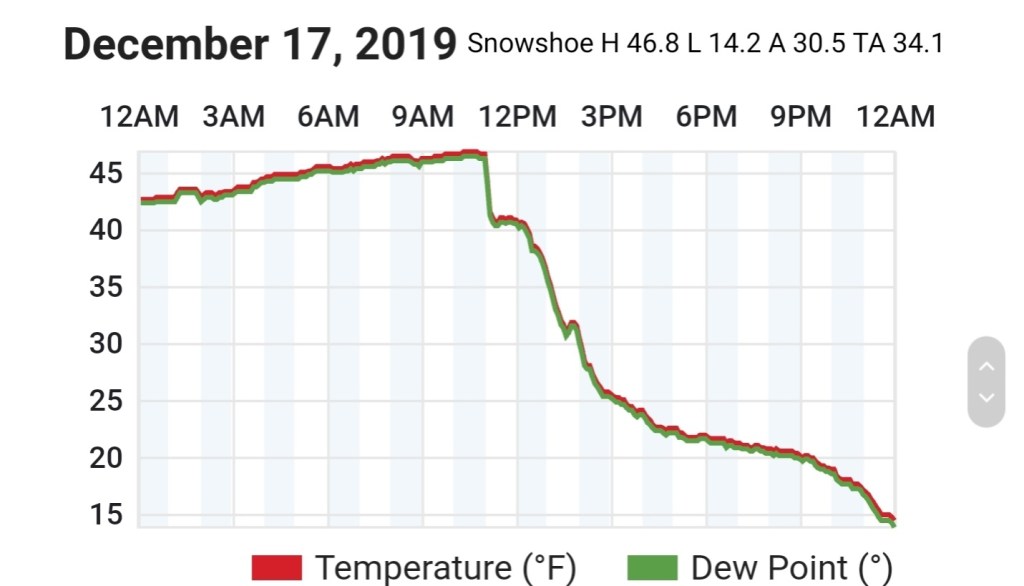
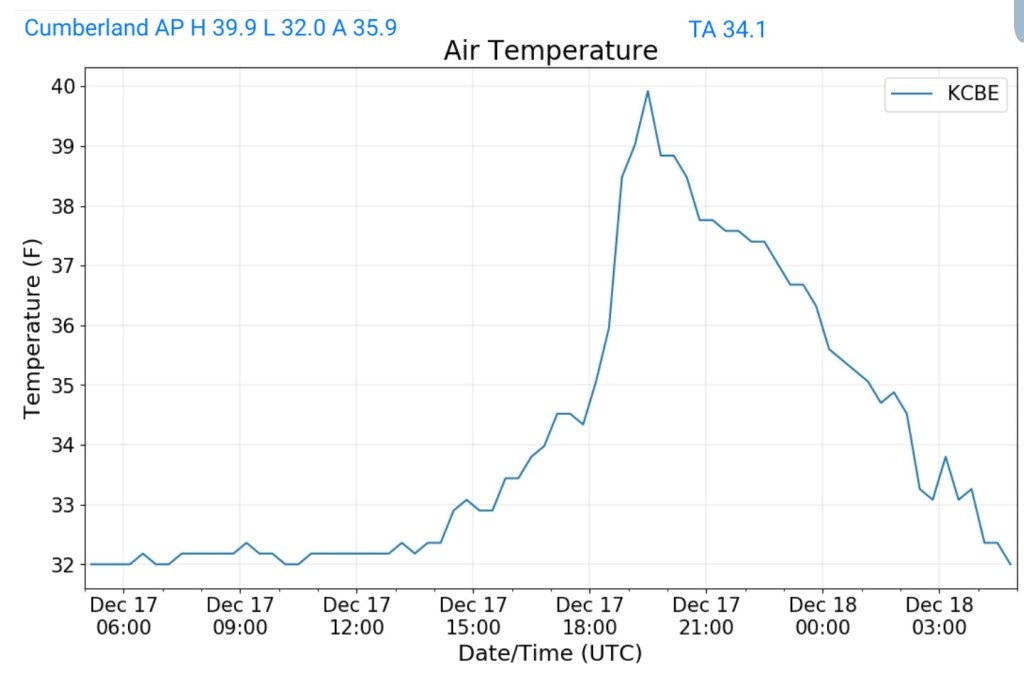
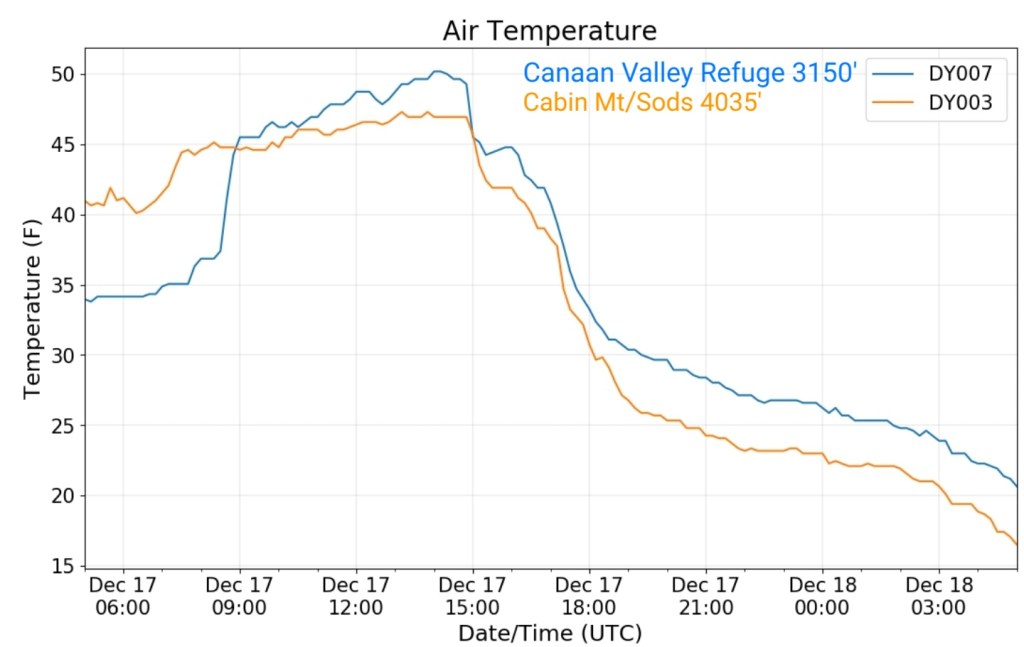
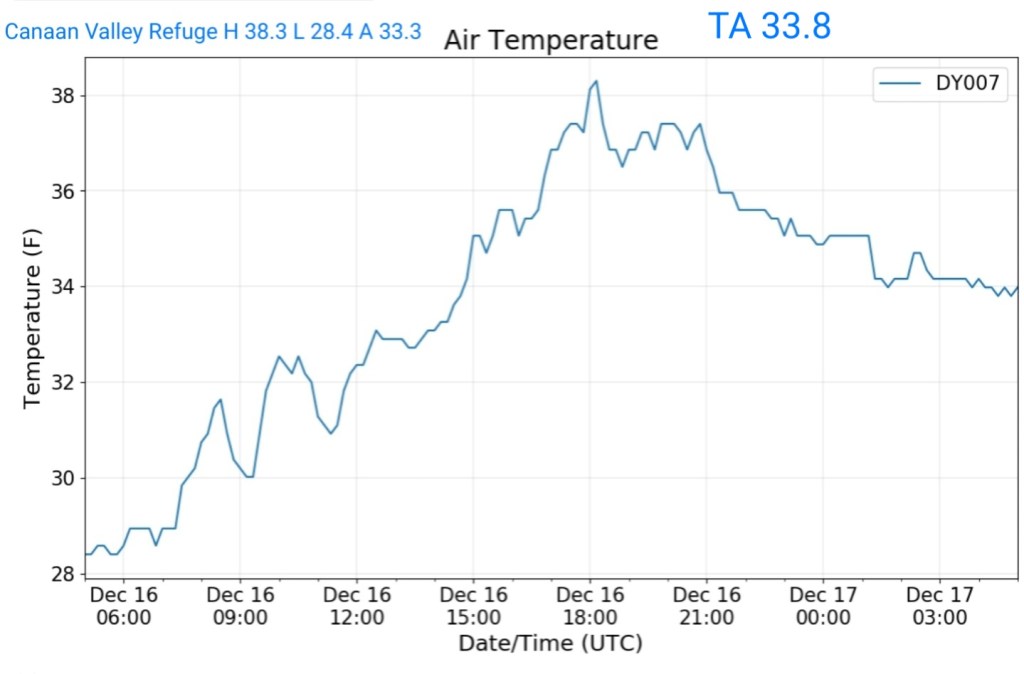
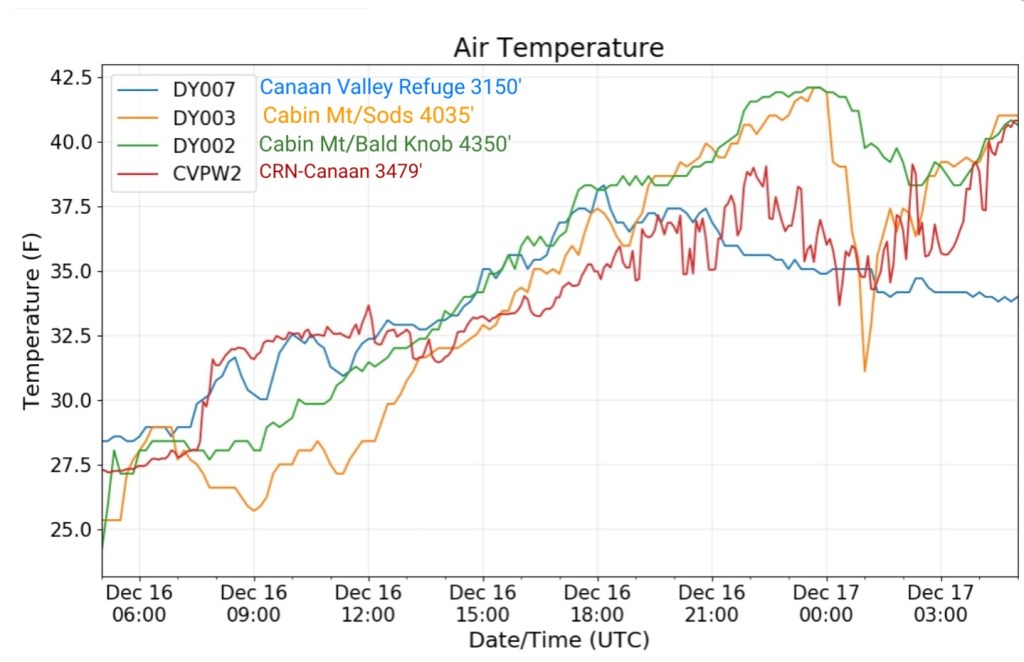
An example of afternoon temps in a more sheltered low area that really works like the supermarket coolers/freezers. This is while most areas were in the 50s
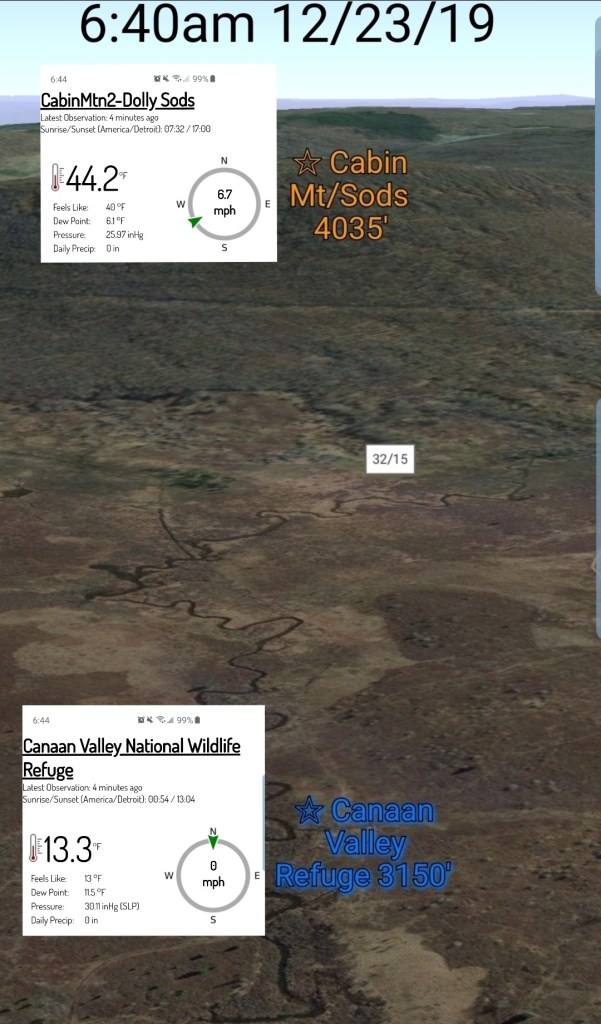
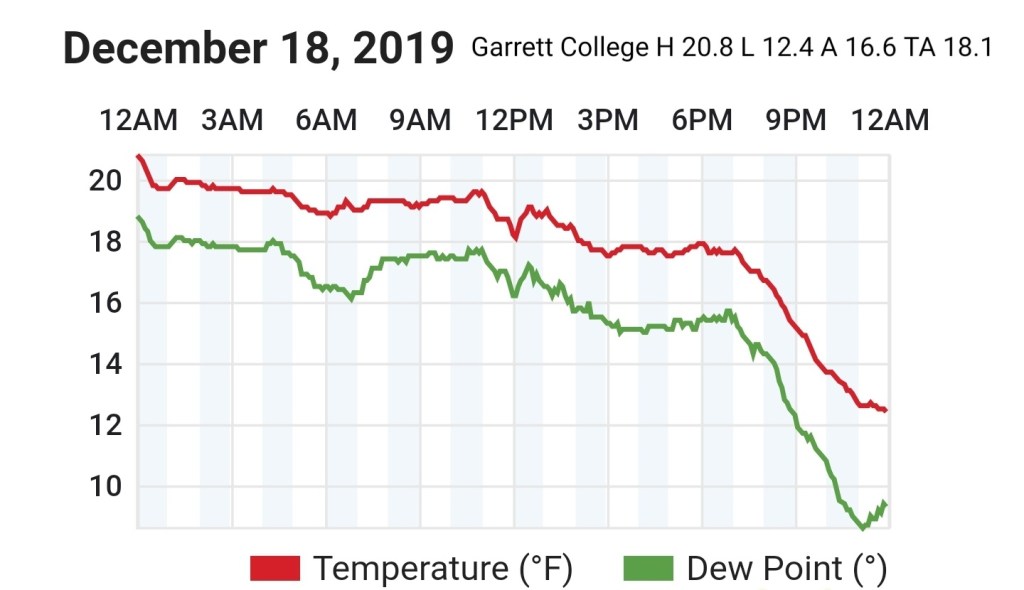
Clear cold night in the valleys, milder high ground. That theme continued today with the deep and or sheltered valleys holding chillier than surrounding areas.
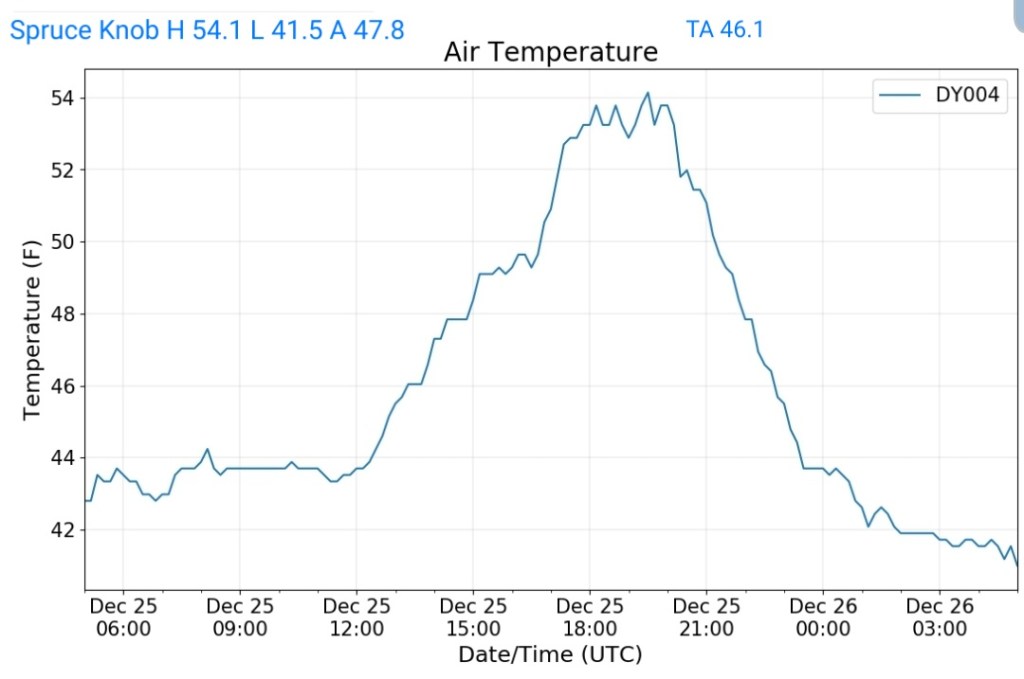
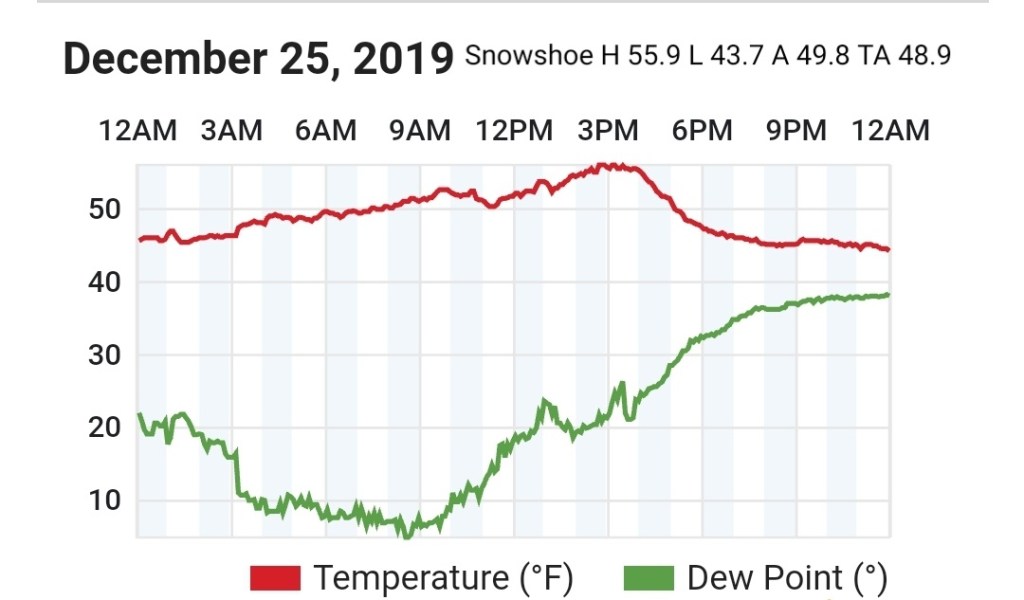
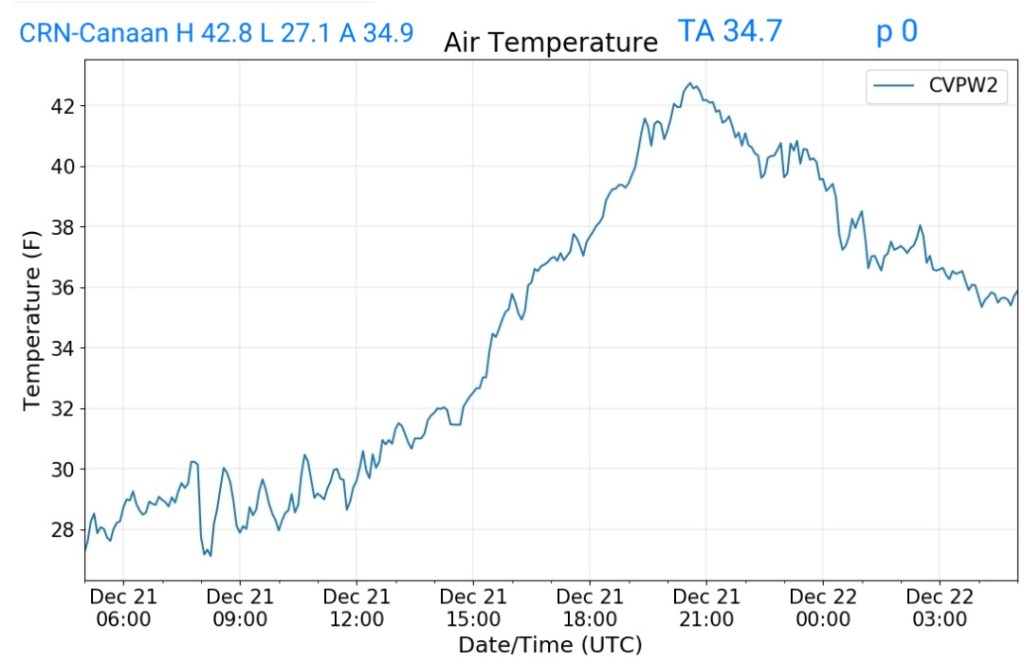
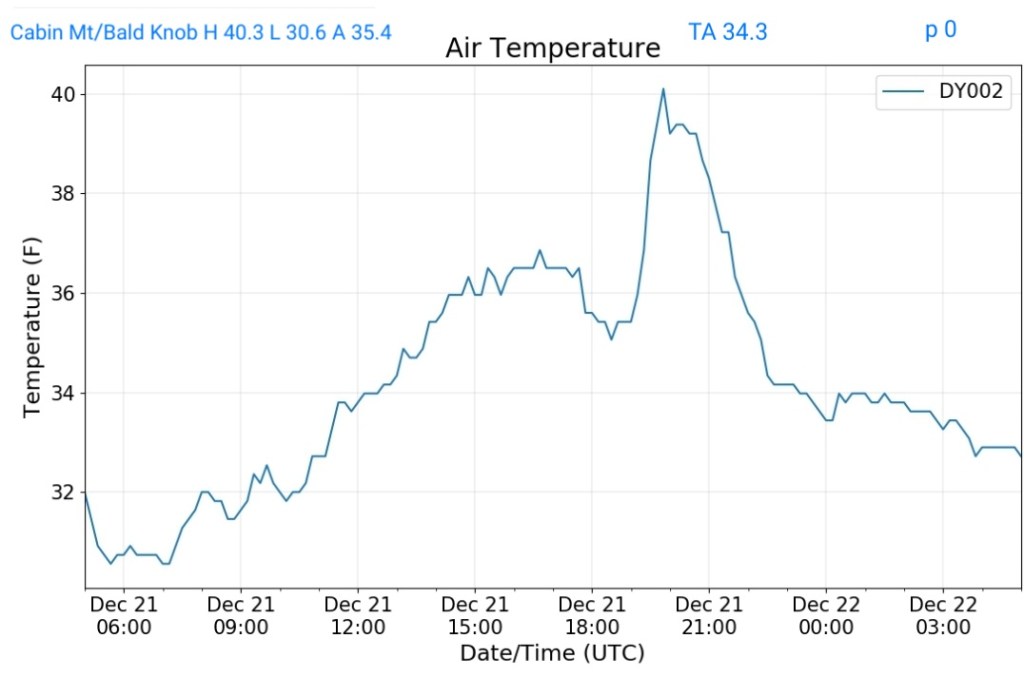
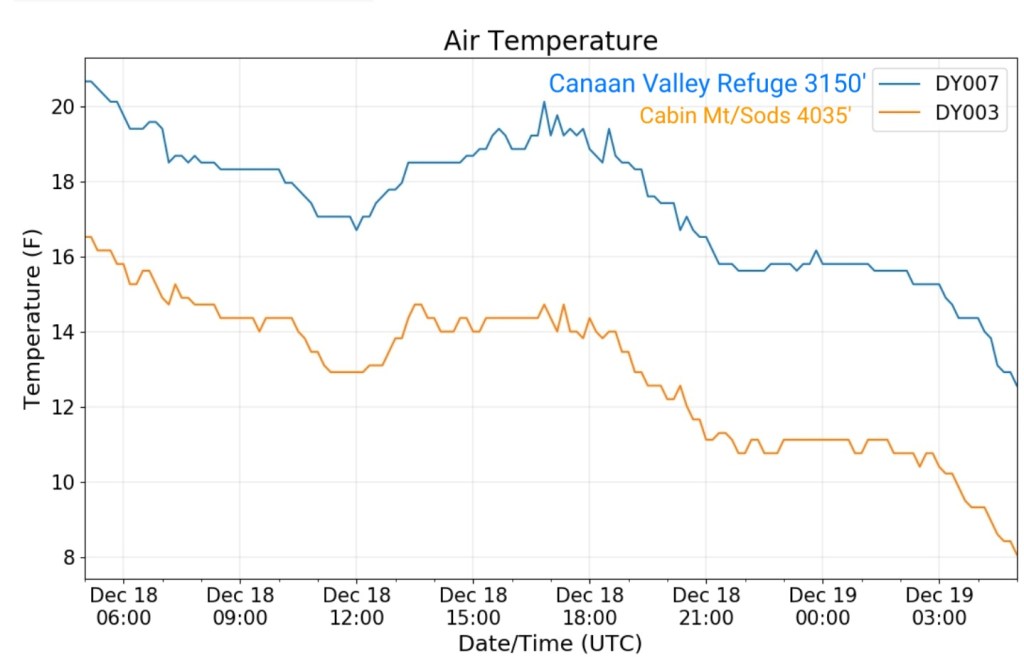
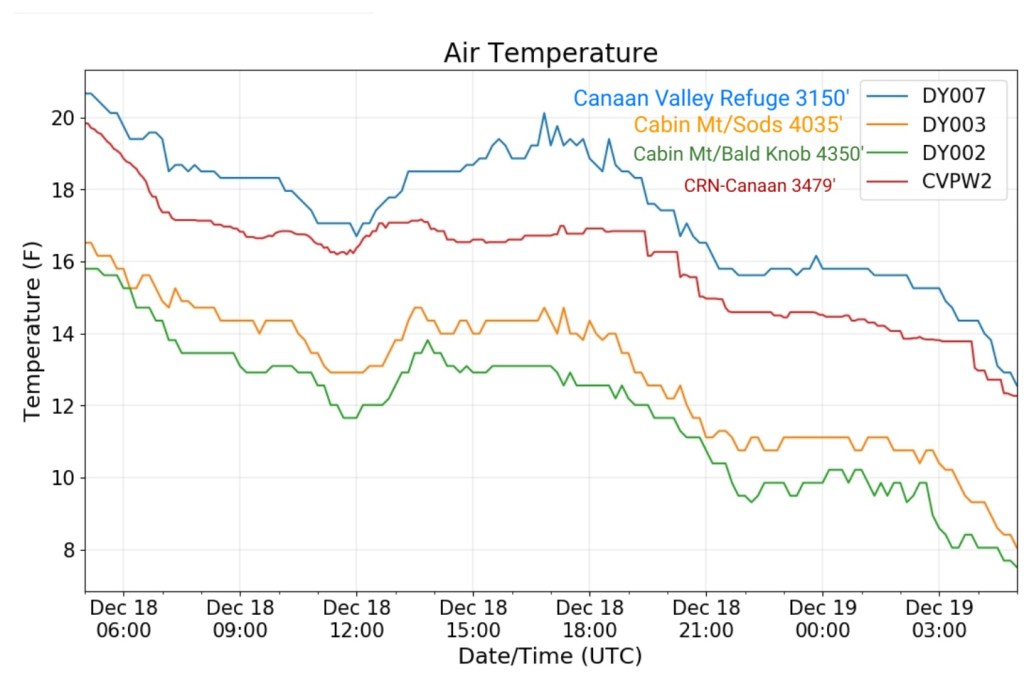
Really to illustrate the variation in a calm, still dry airmass with snowcover. The sheltered valleys really hold much chillier than elsewhere during the day and all valleys much colder at night.
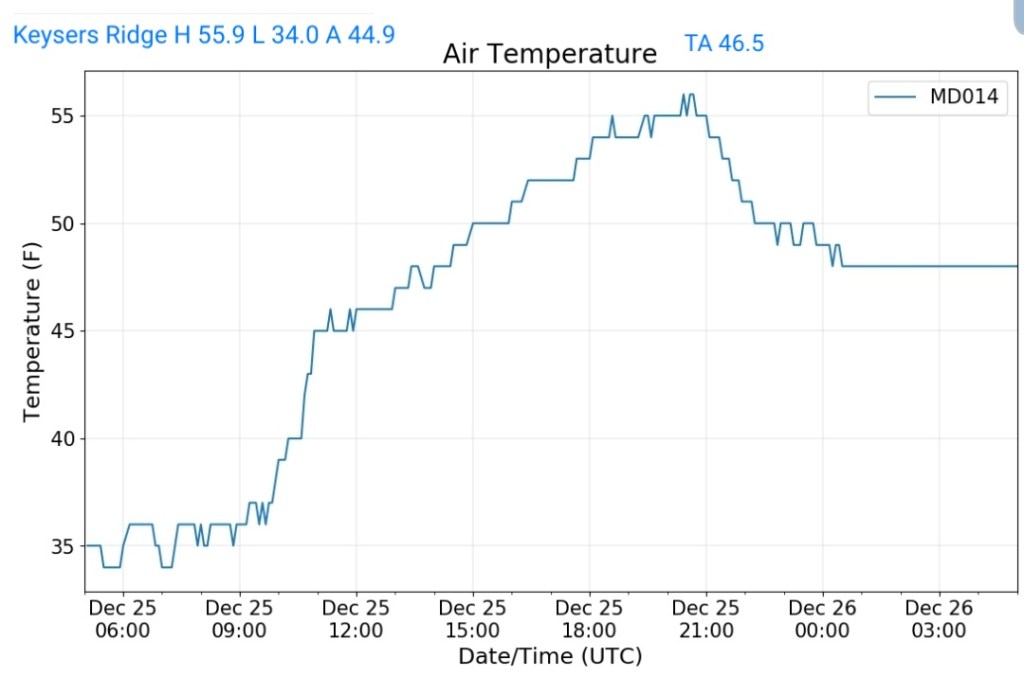
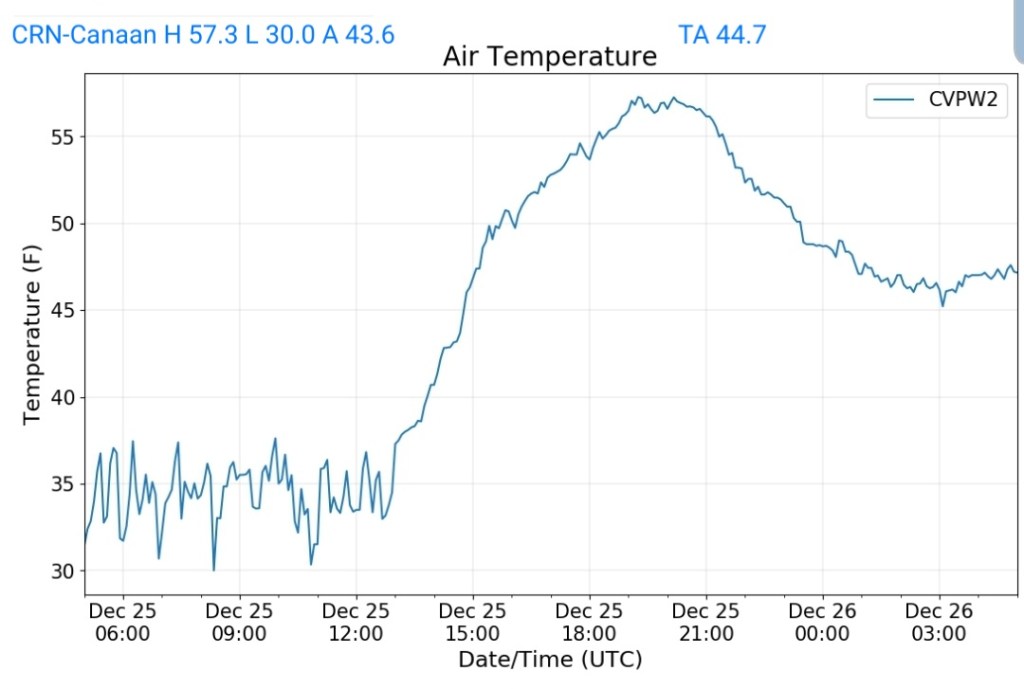
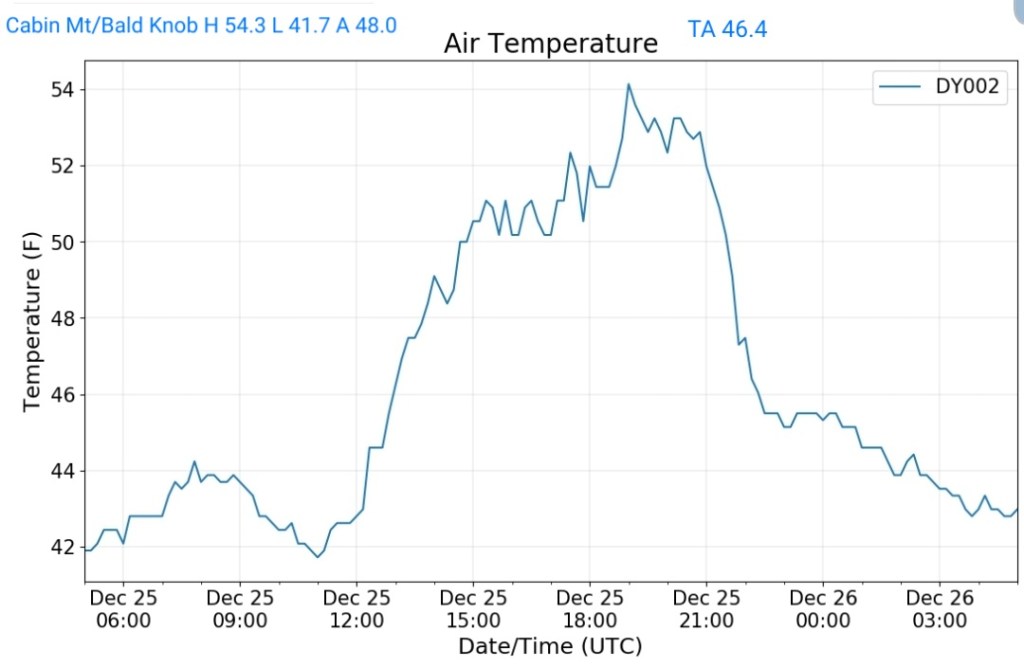
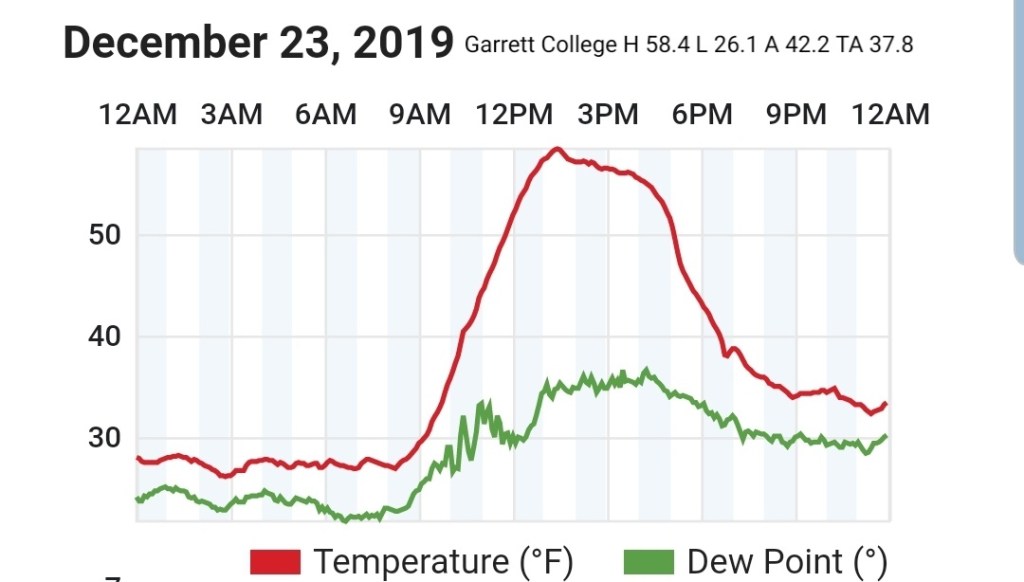
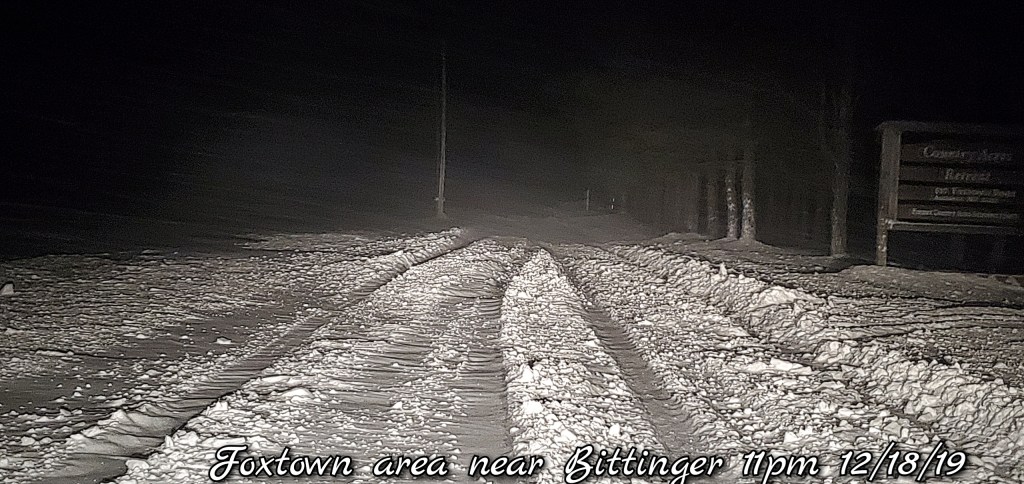
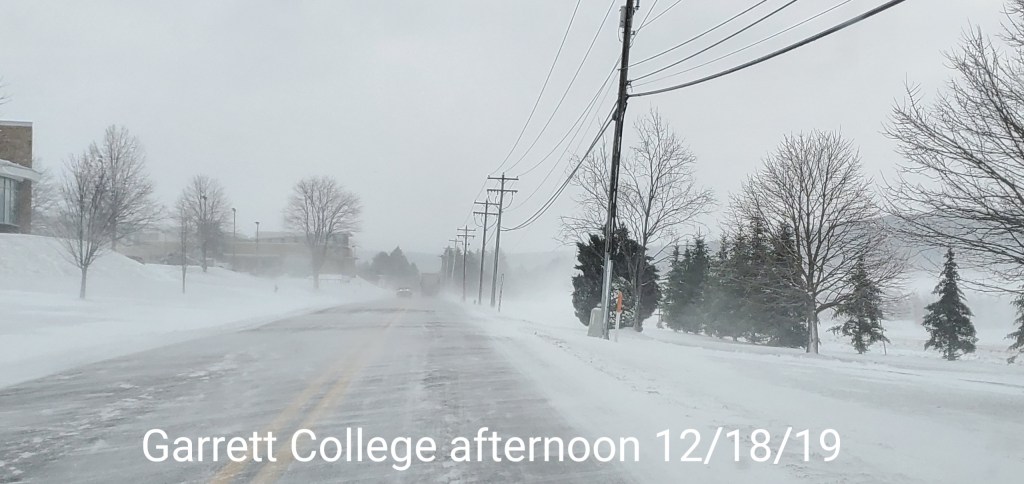
Few more from Garrett
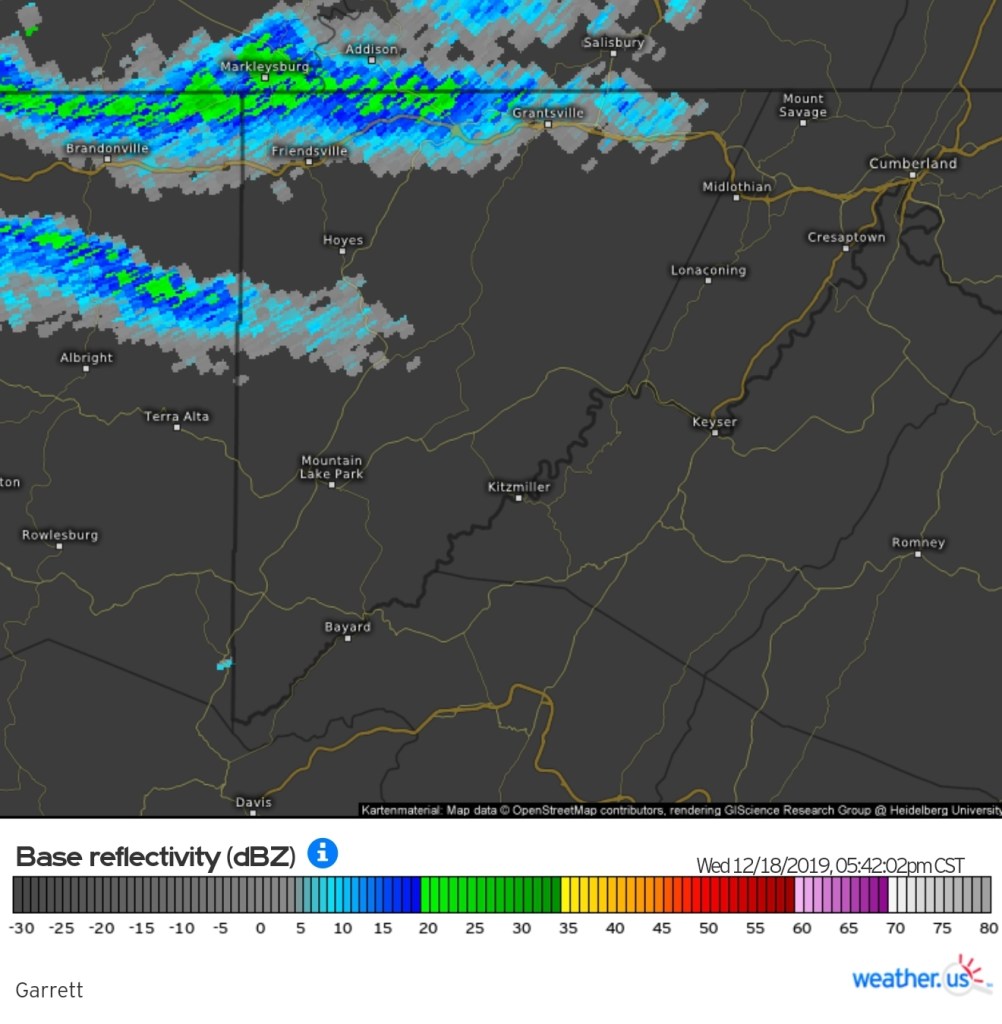
RTMA
Radar
Void today
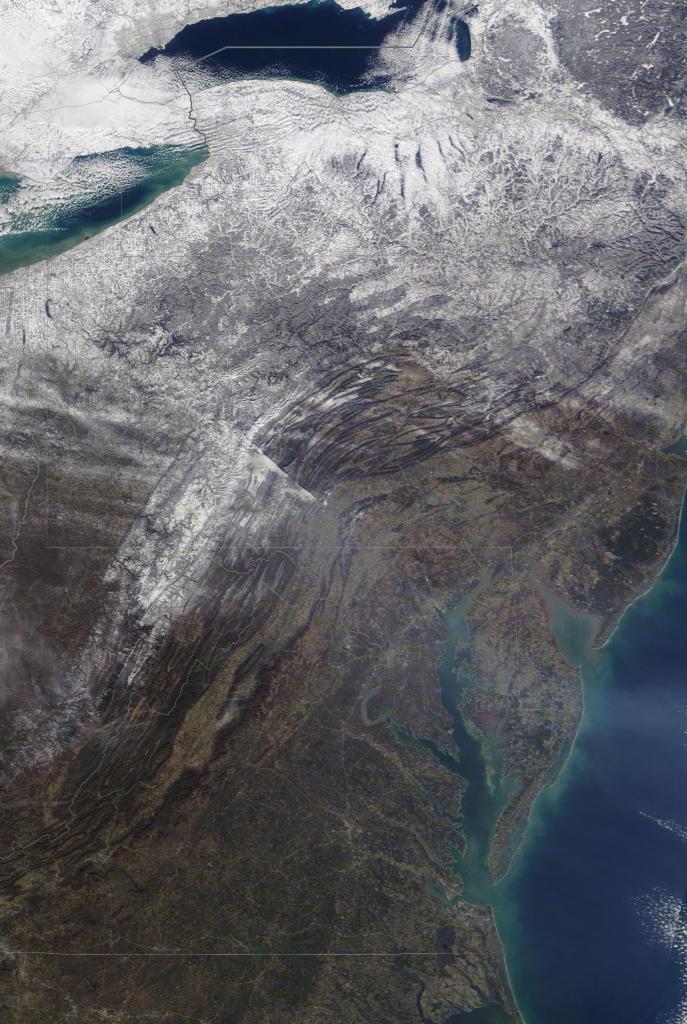
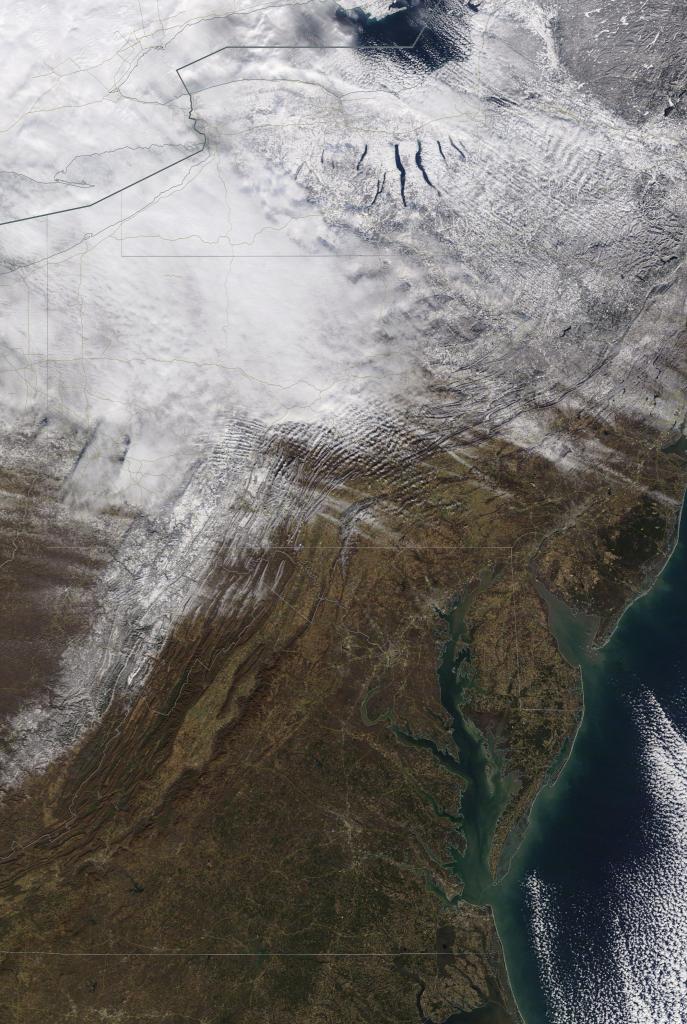
Satellite
Flow
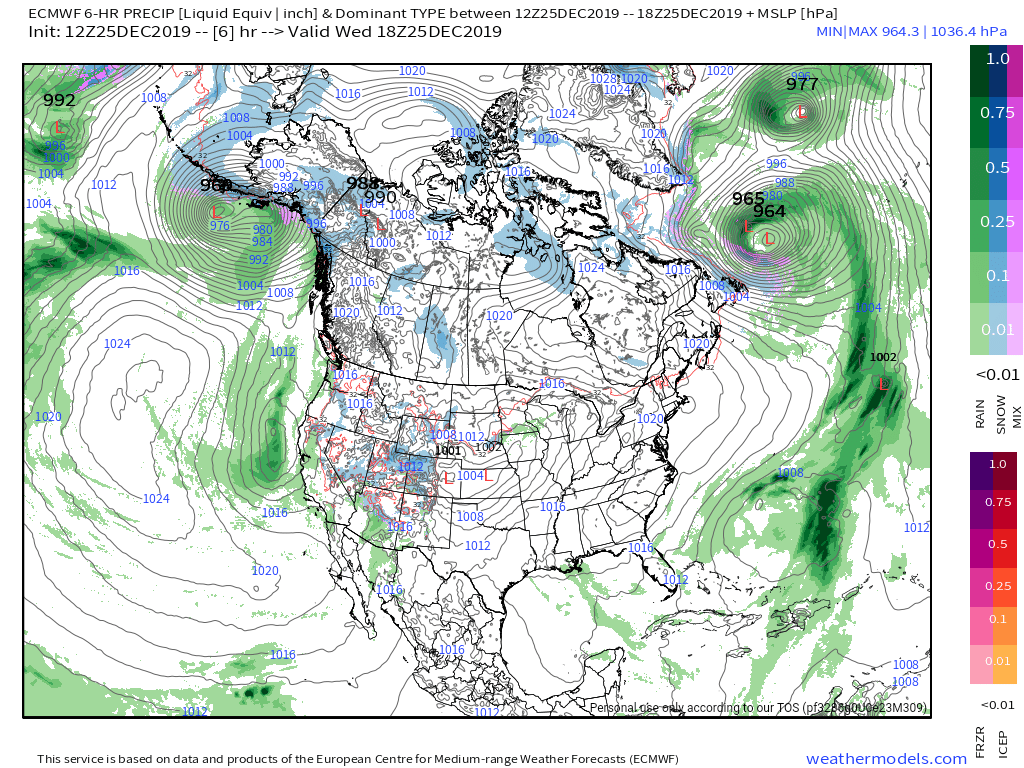
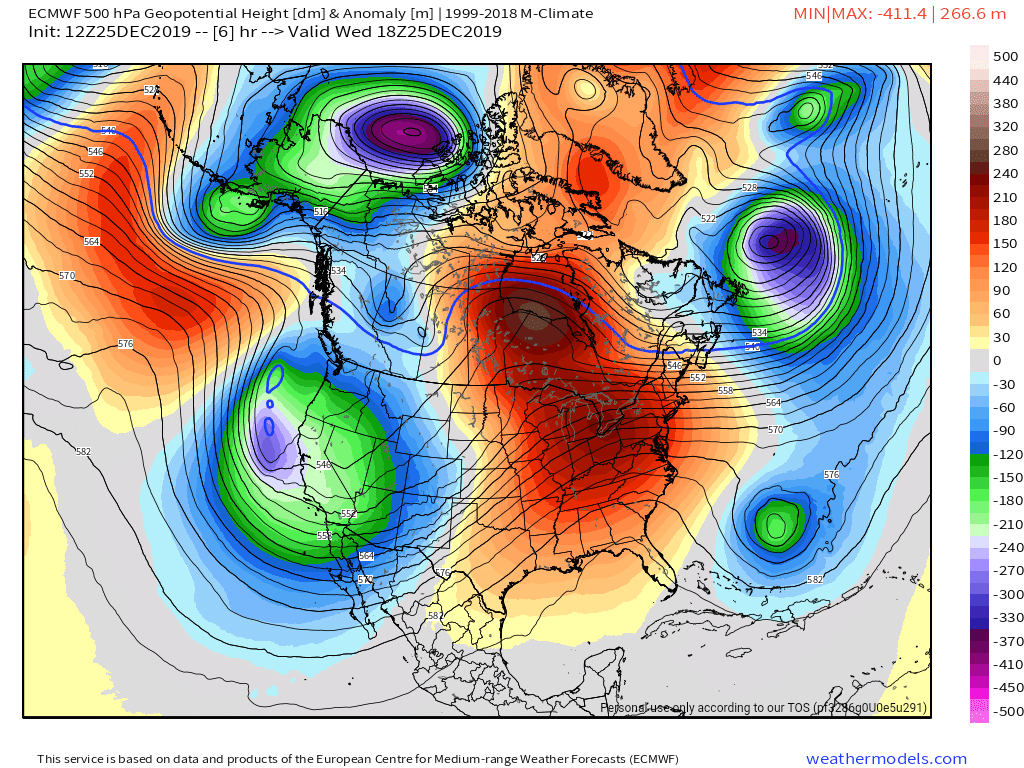
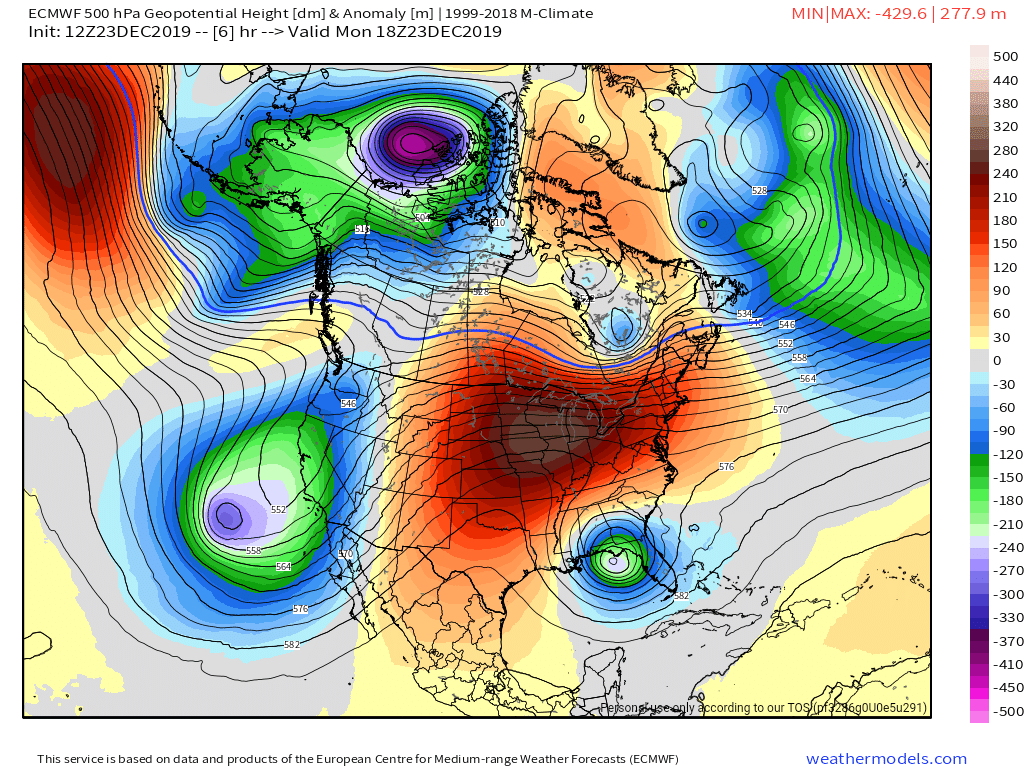
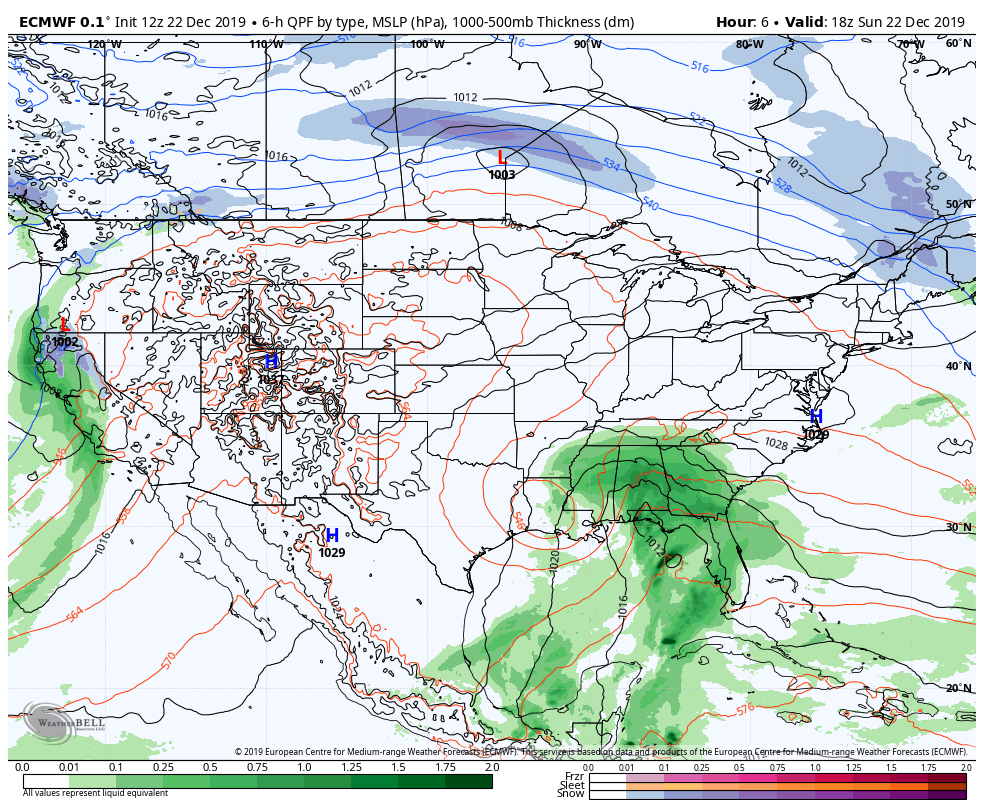
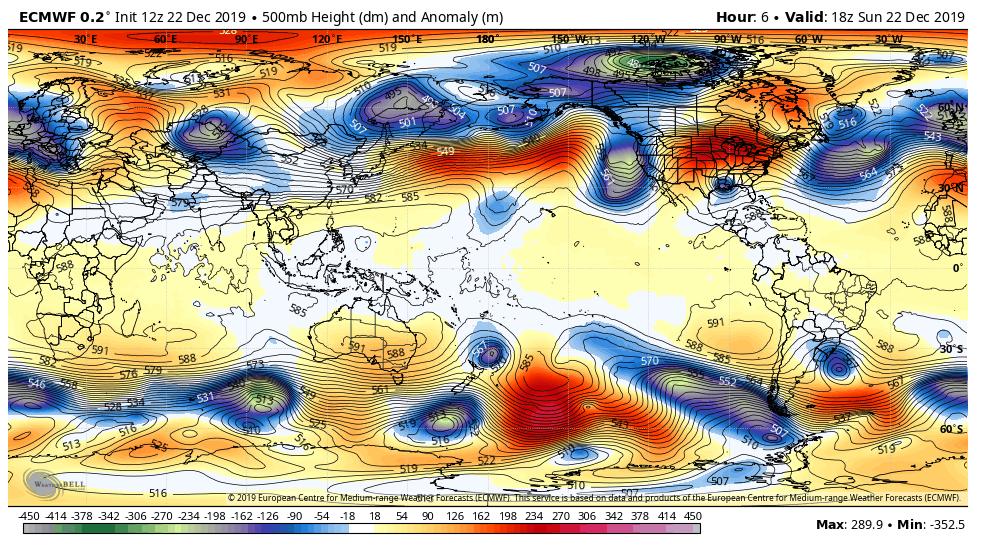
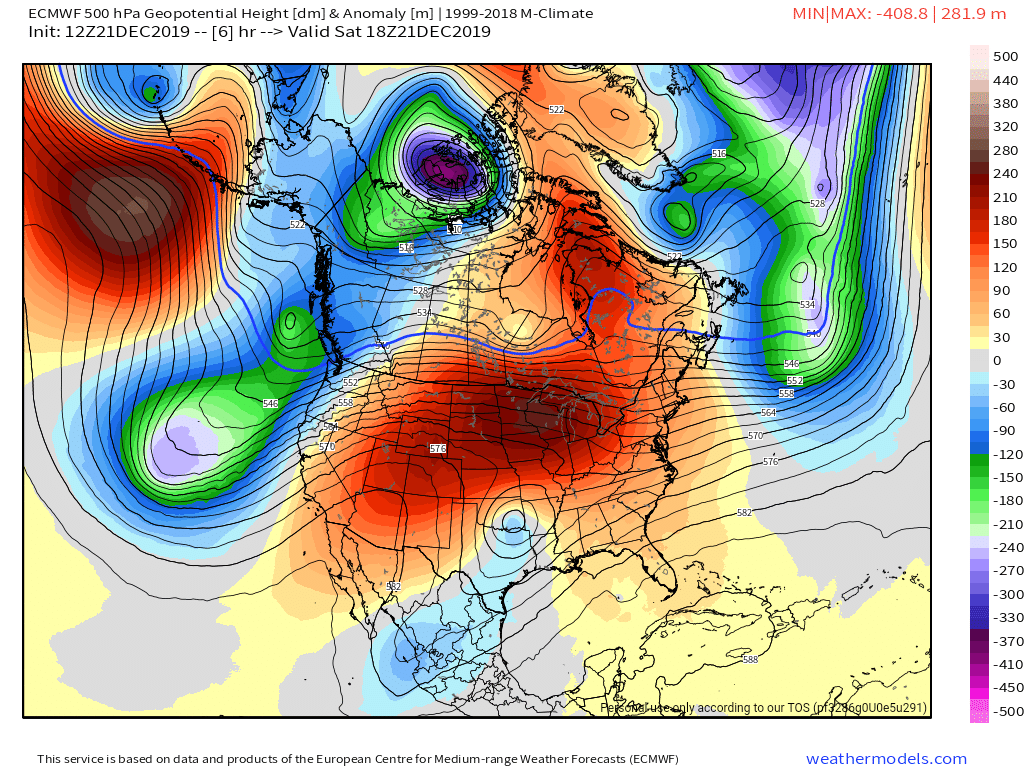
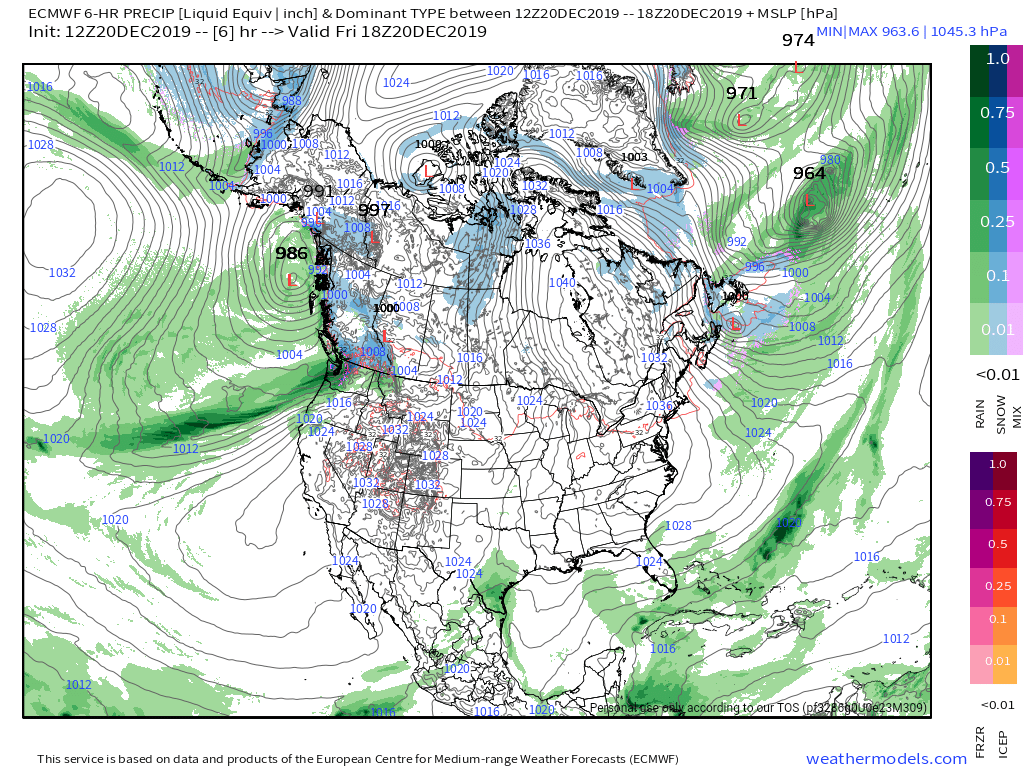
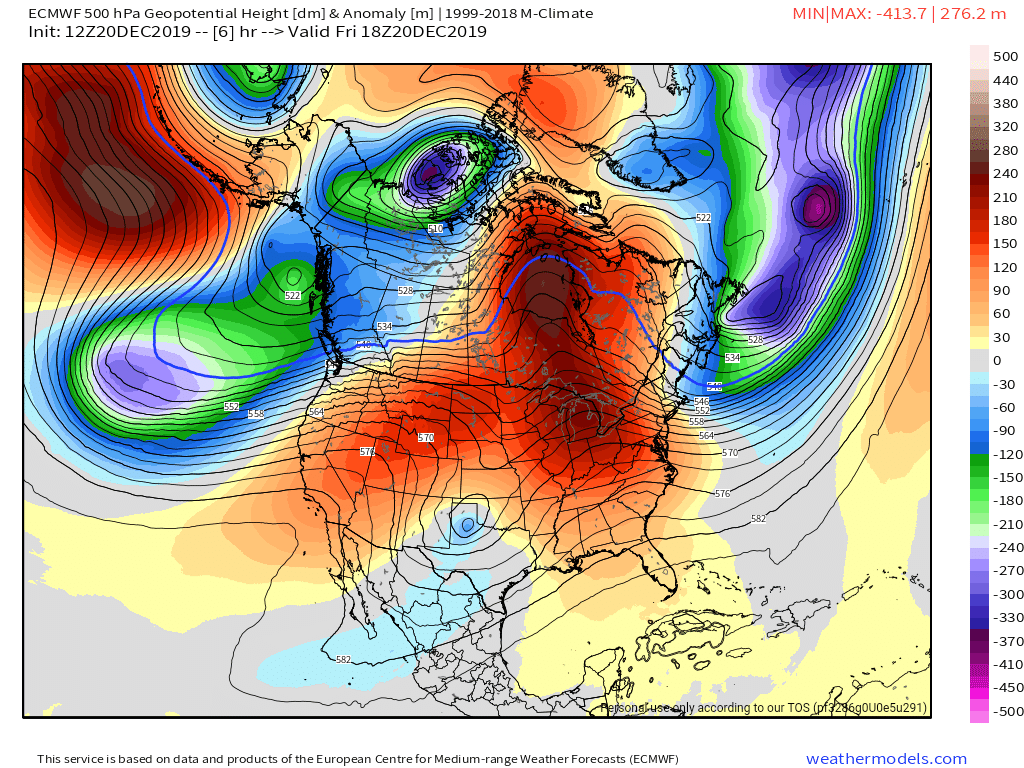
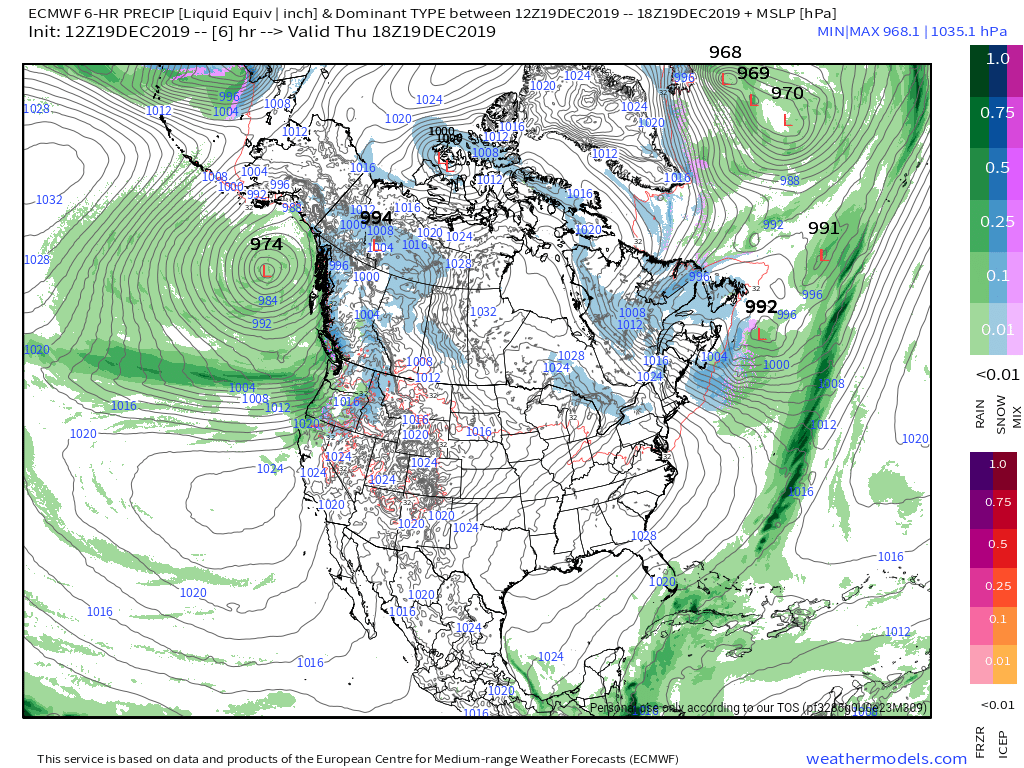
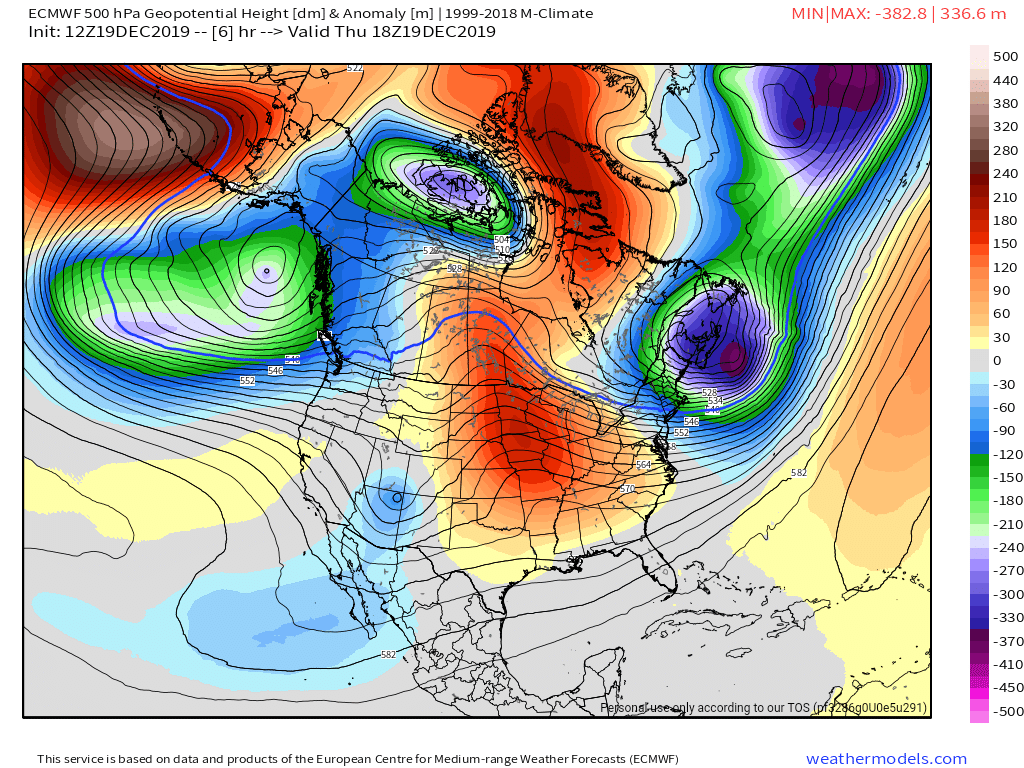
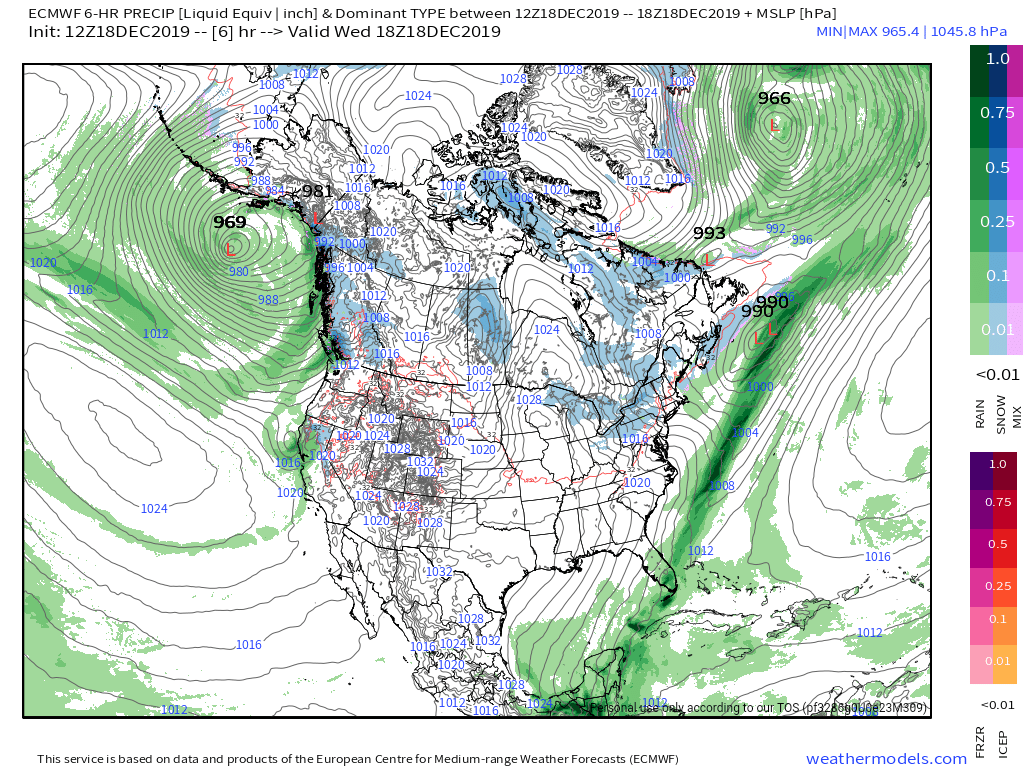
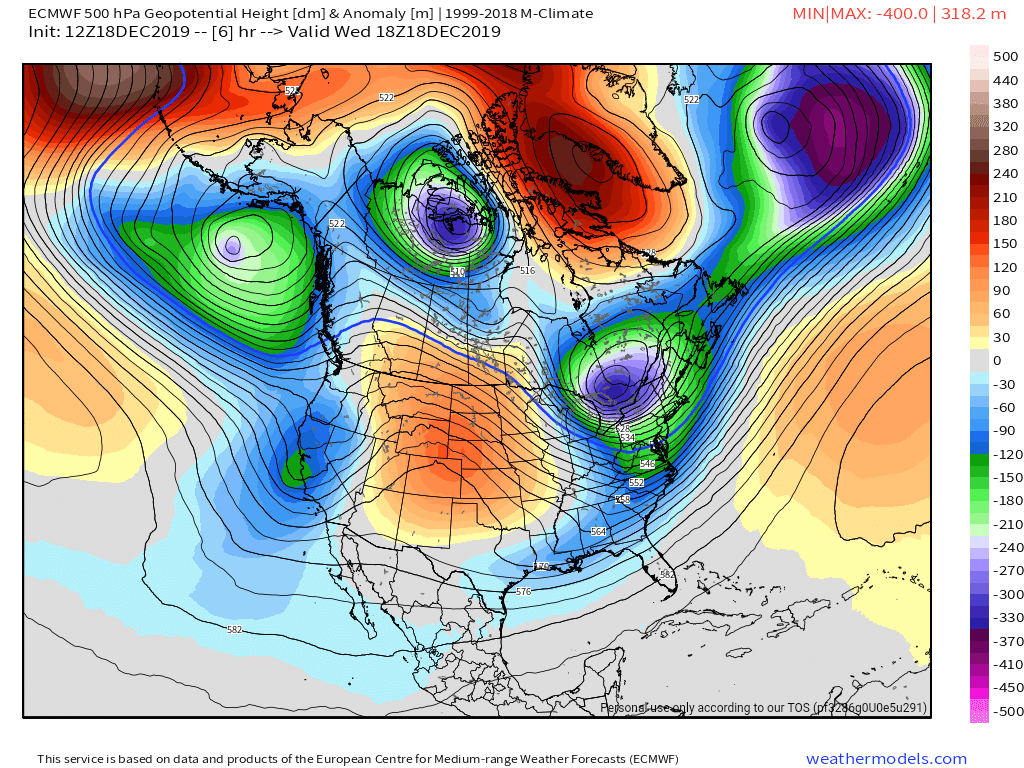
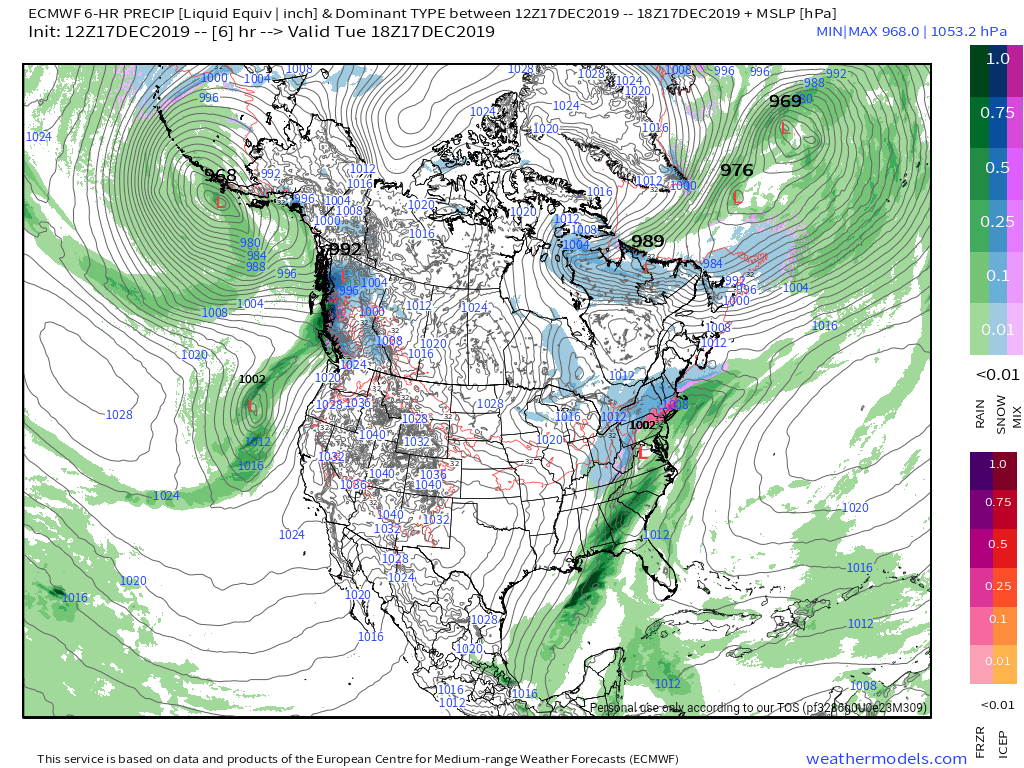
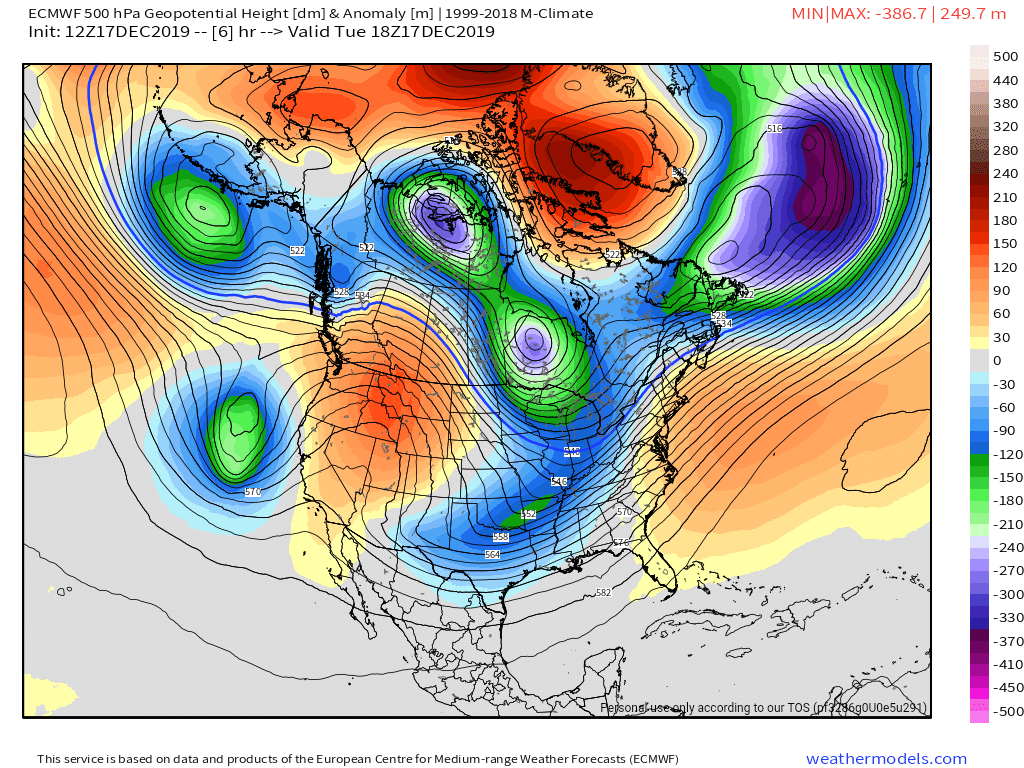
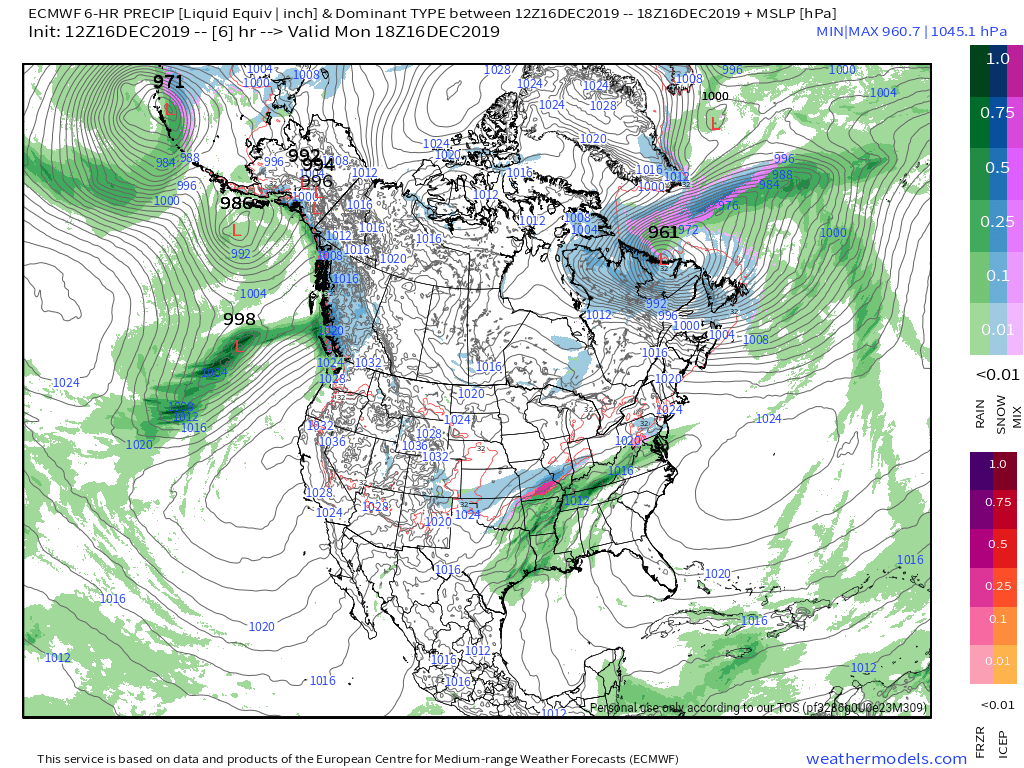
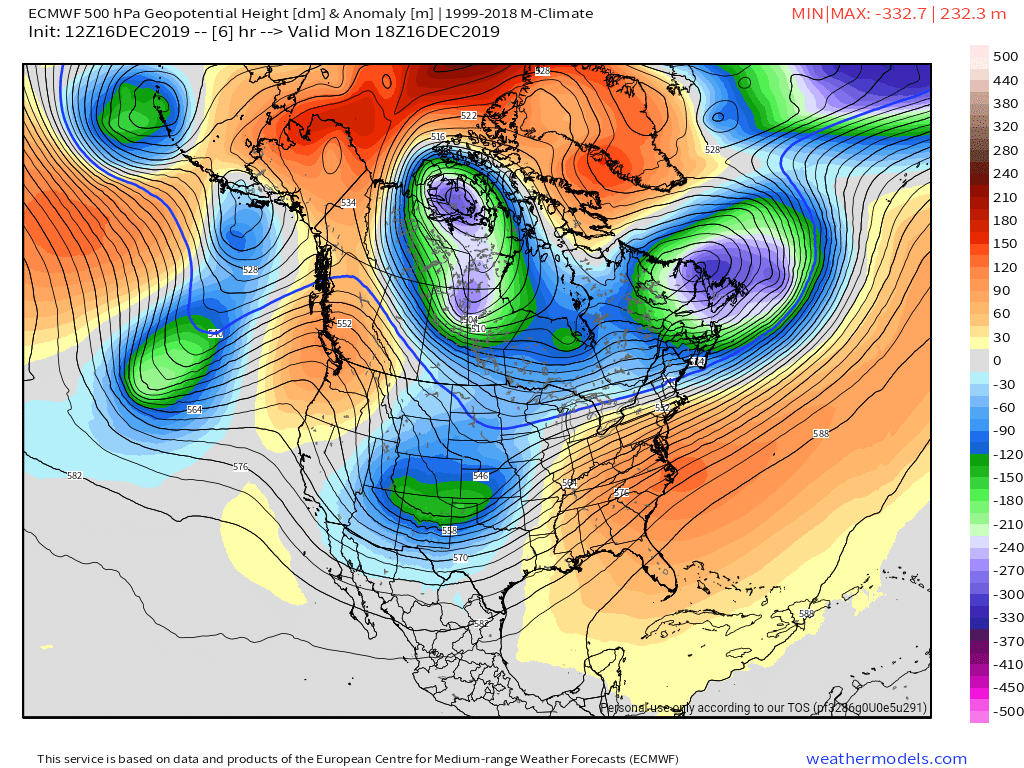
Surface features and 500mb height anomalies and flow
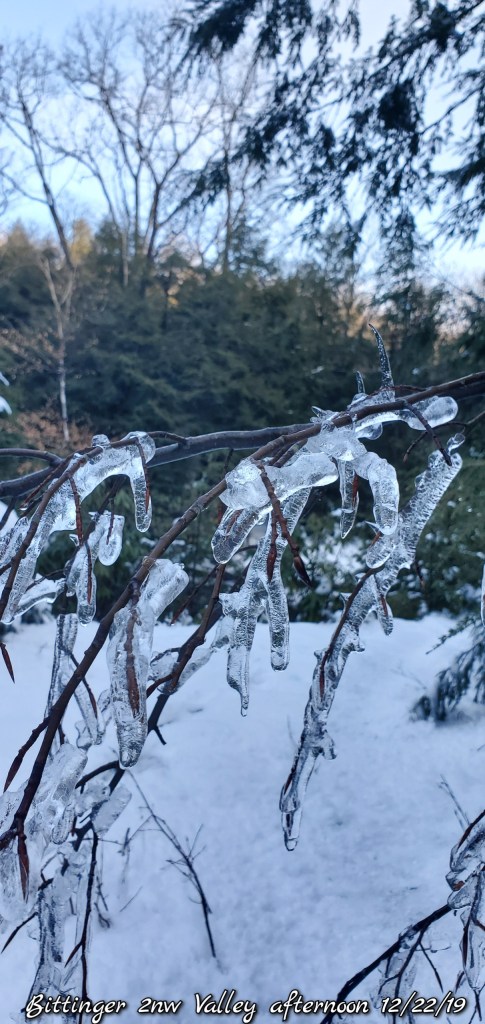
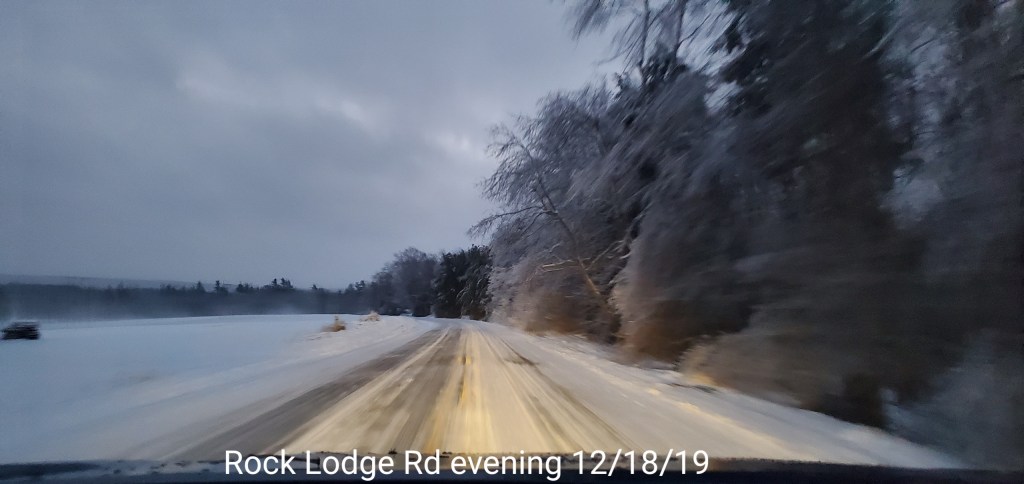
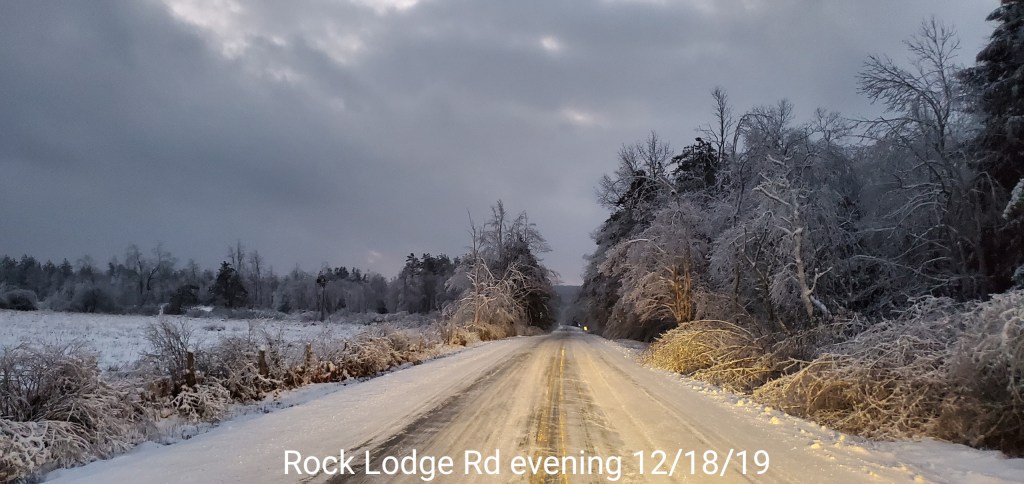
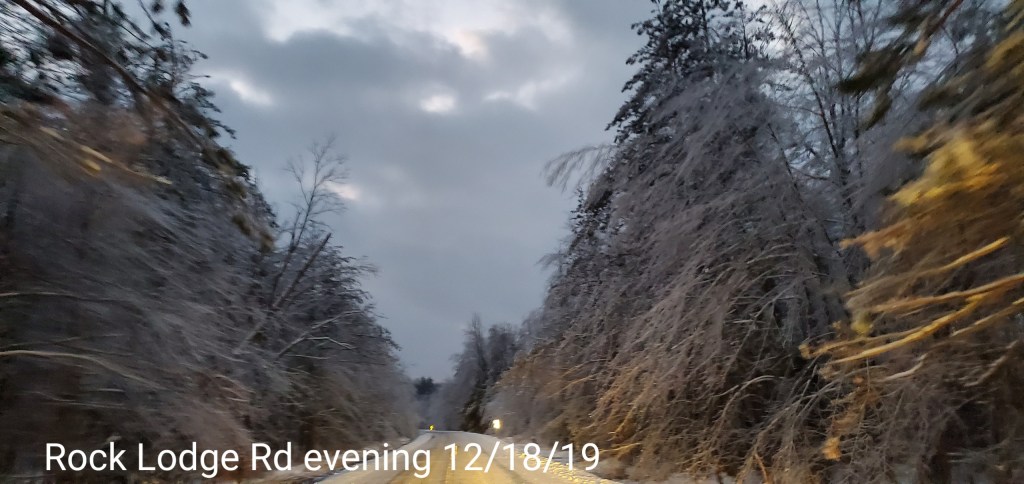
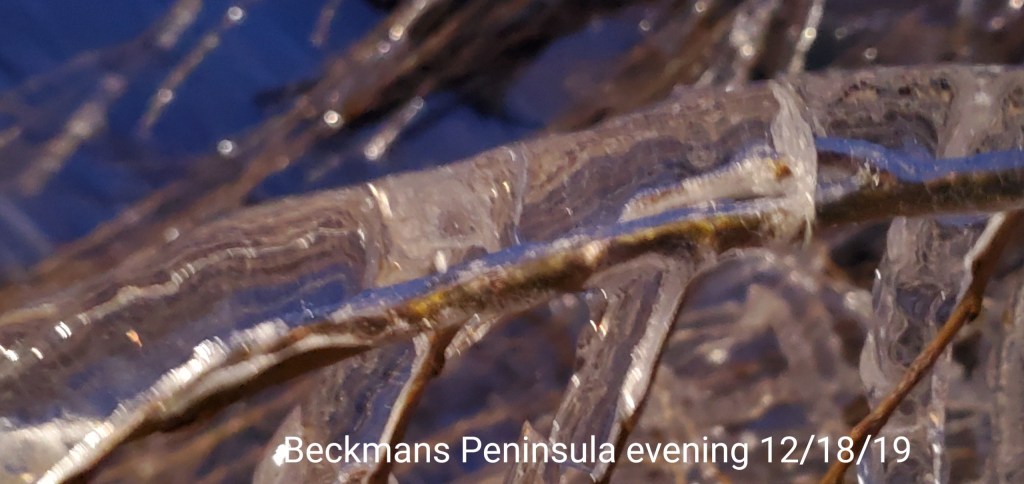
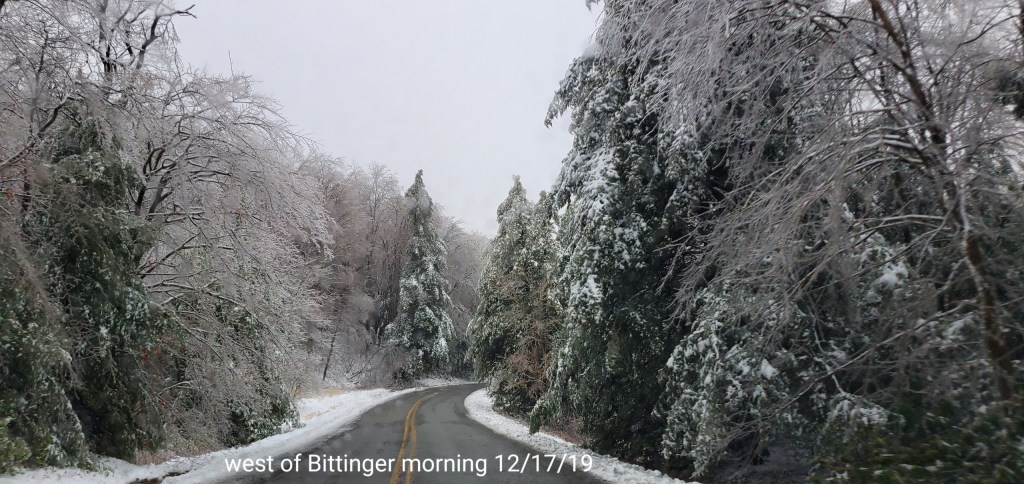
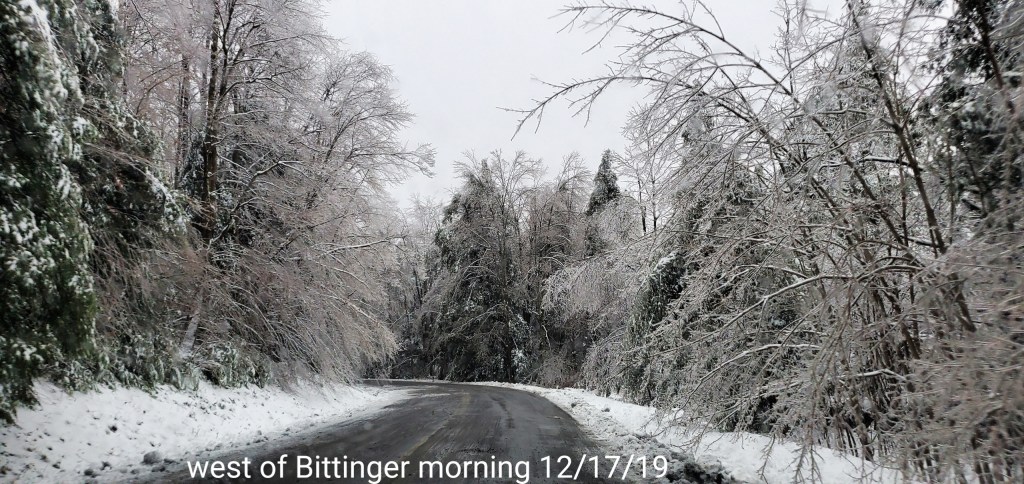
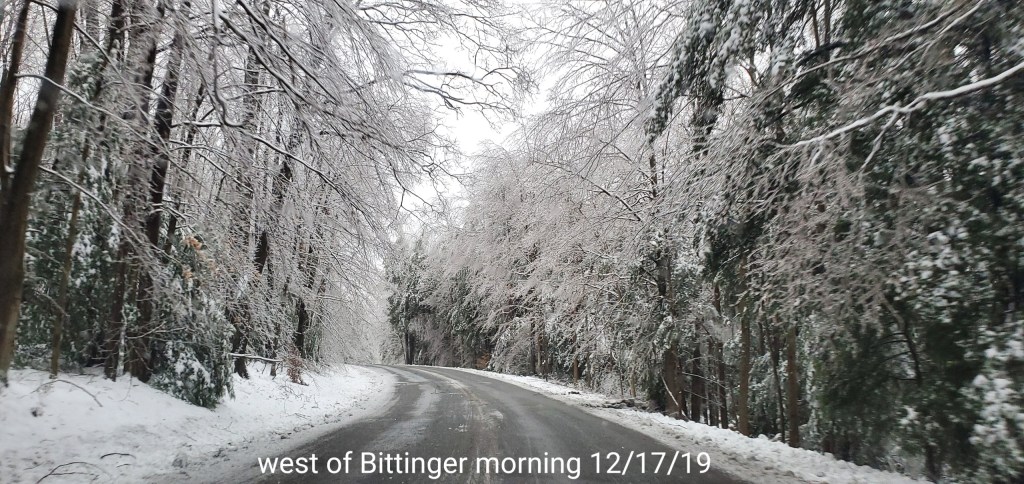
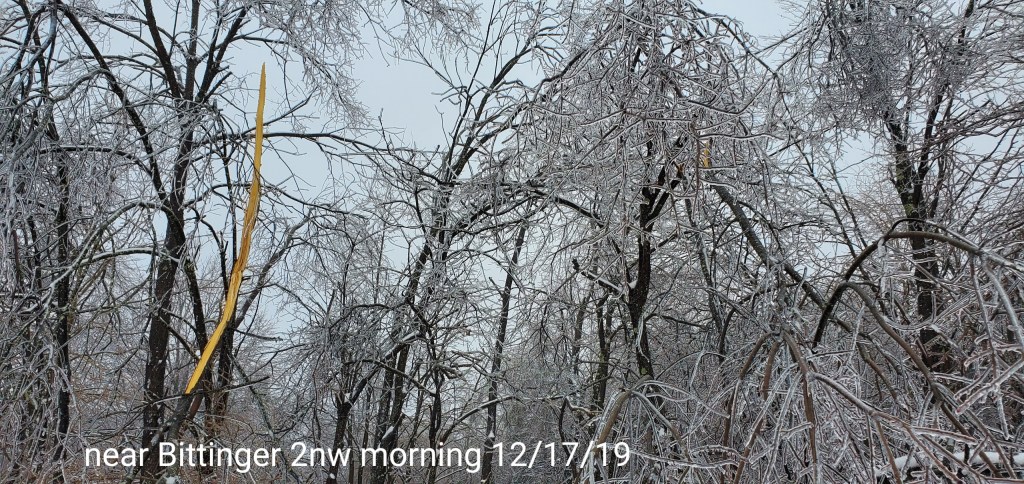
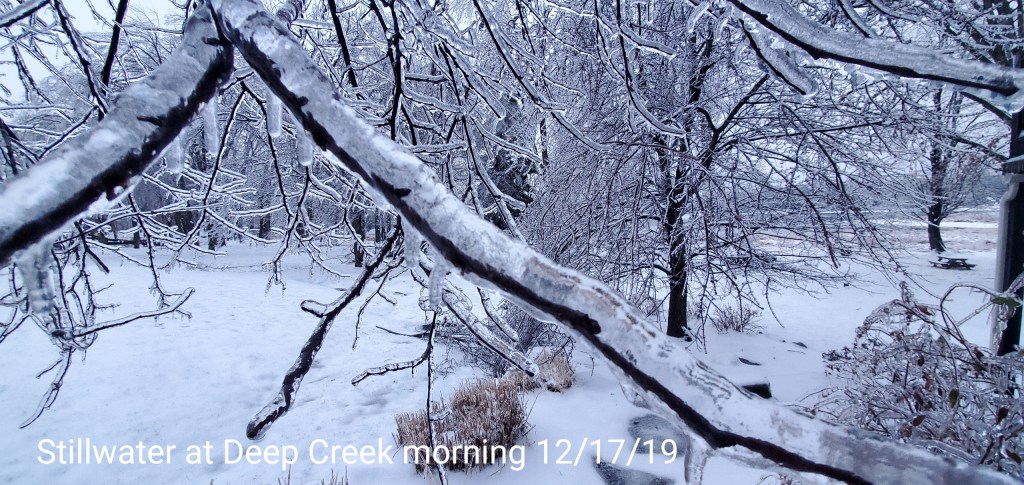
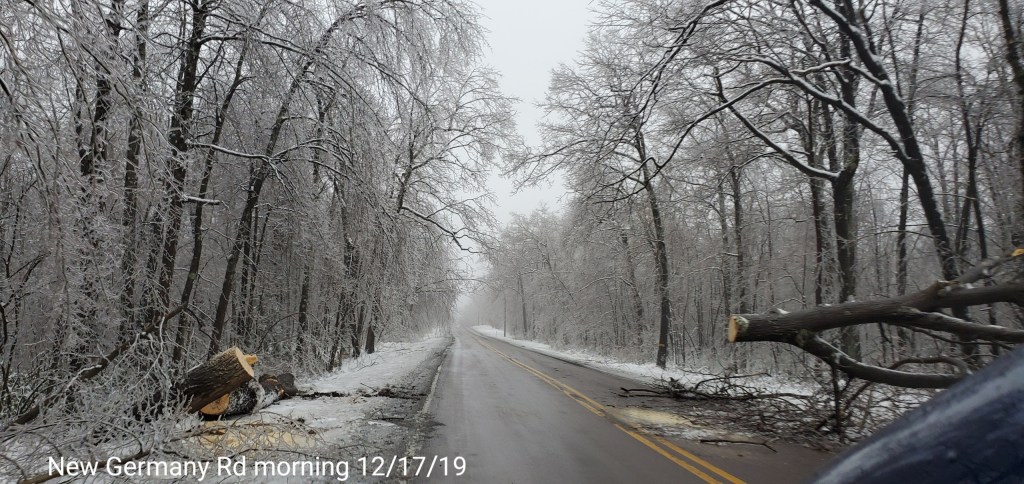
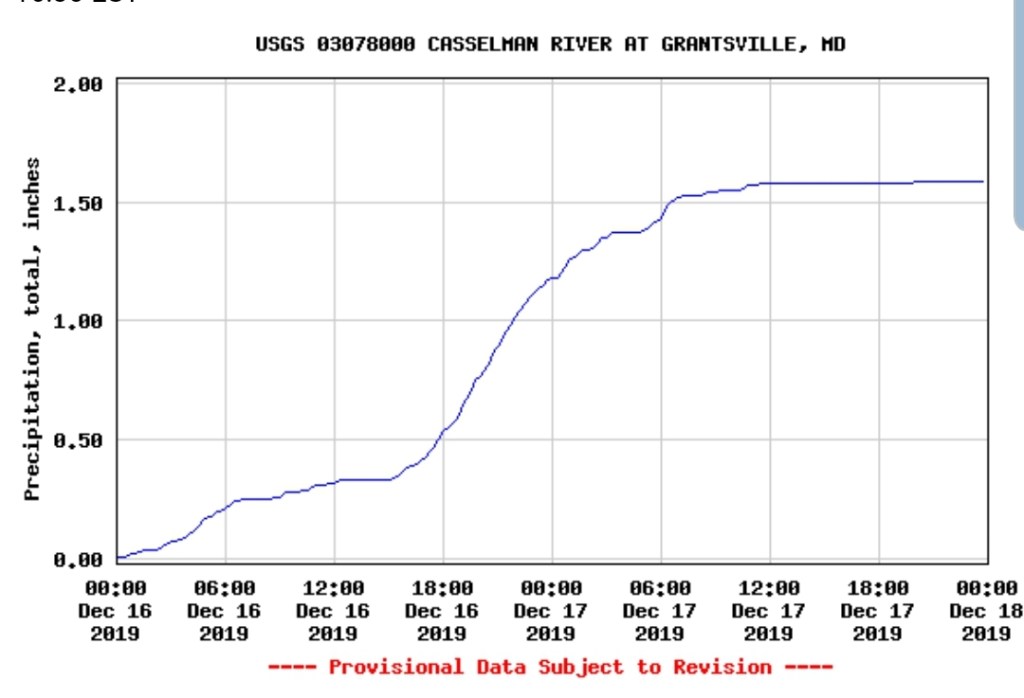
Early am snow showers remained, but quickly cleared out. Leaving behind blue skies and ice covered trees in what was about as beautiful as a winter gets. 9.5 out of 10. Snow depth could be greater and the long range forecast could look much better. That slightly dampened the beauty of today, but not really.
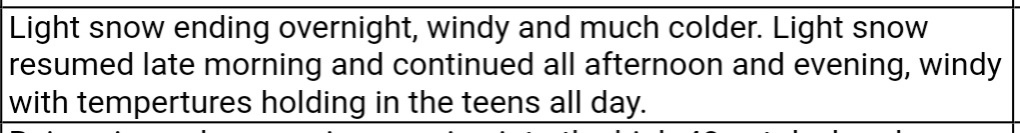
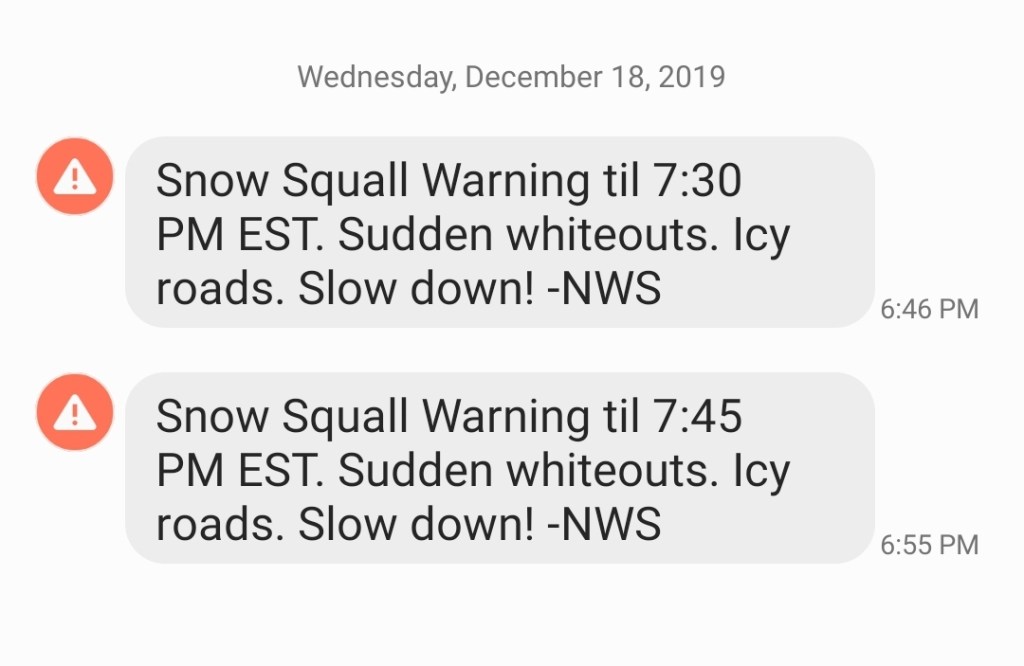
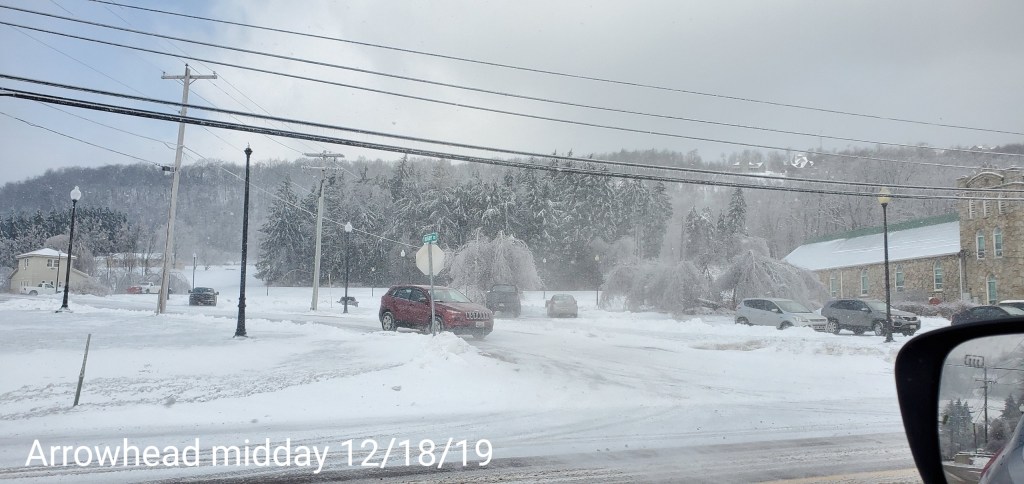
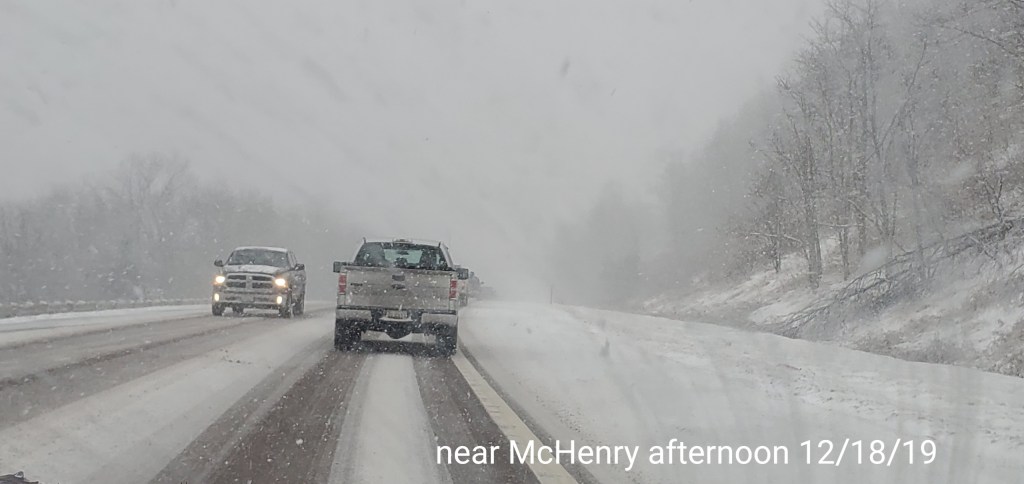
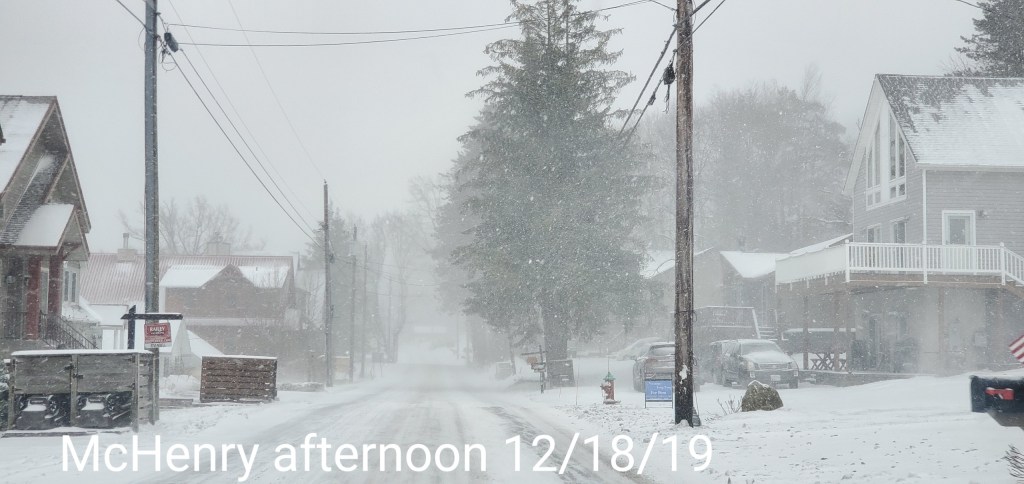
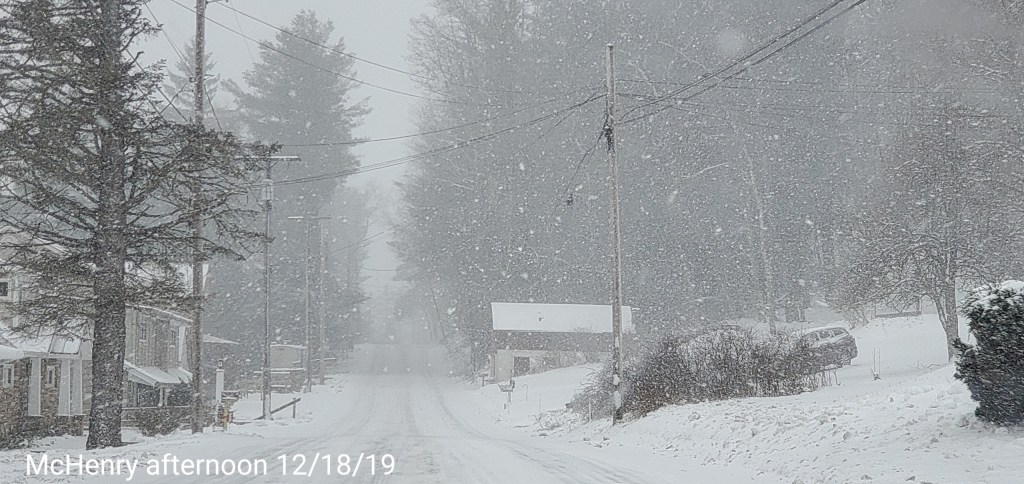
After skies cleared for awhile overnight, snow moved back in early morning(8am), and continued in varied fashion through the day with some heavier squalls at times. A brief very heavy one around 7pm.
Snowfall- .8″ yesterday afternoon through overnight till 6am , no boardsweep done. Through 5pm another 2.3″ from snowshowers and squalls today for an event total of 3.1″
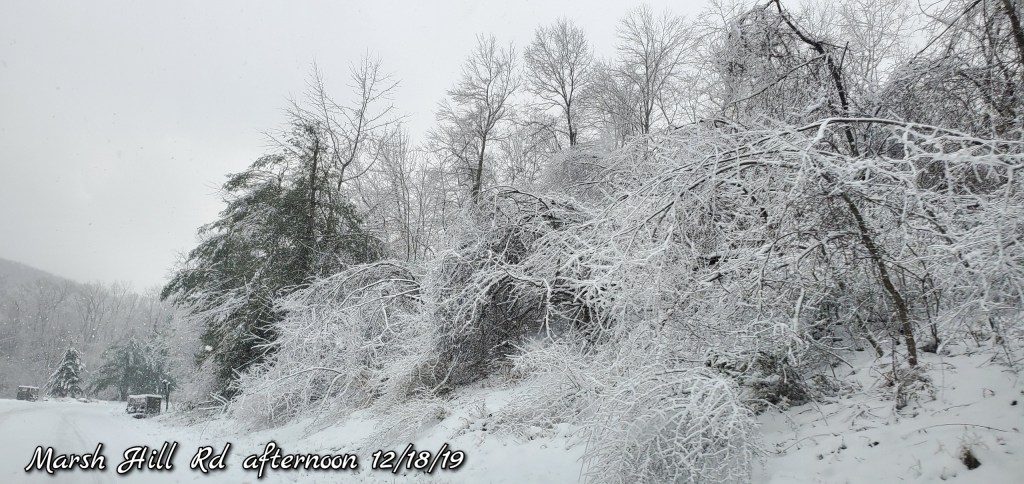
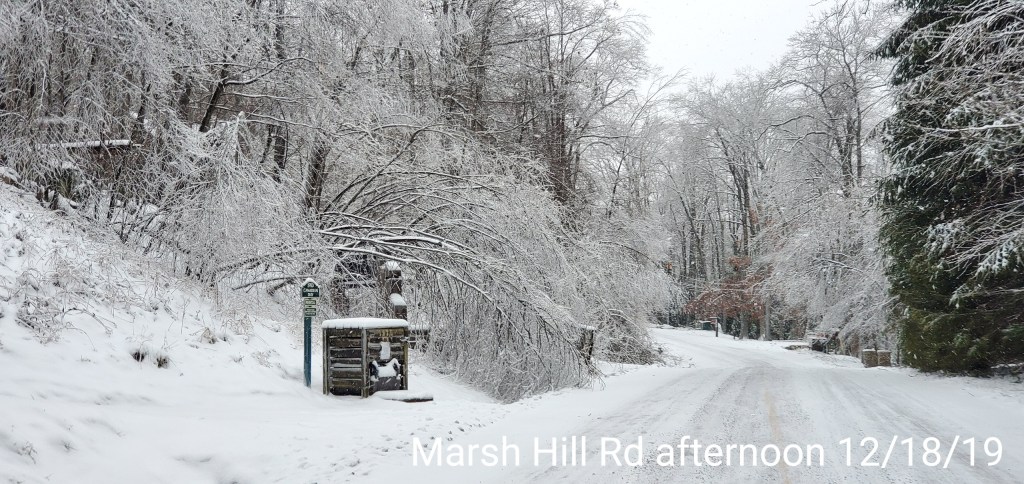
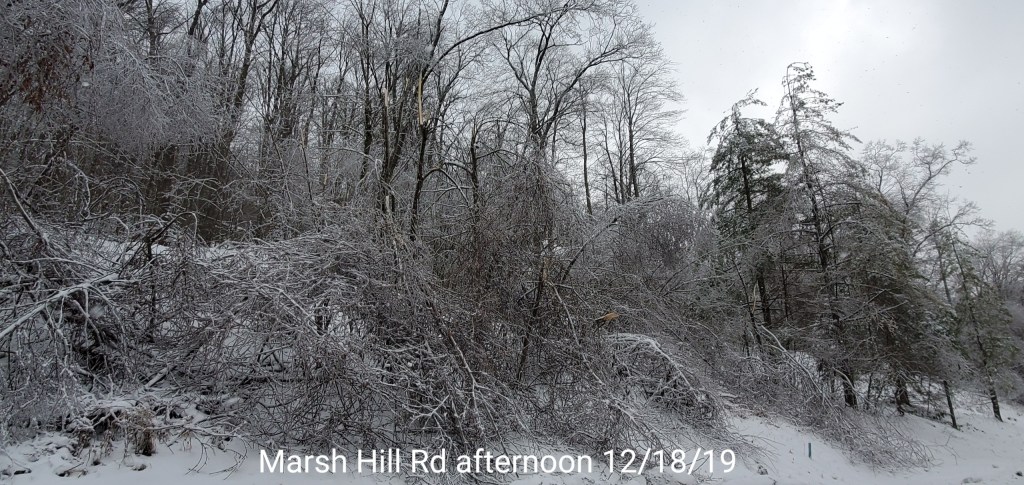
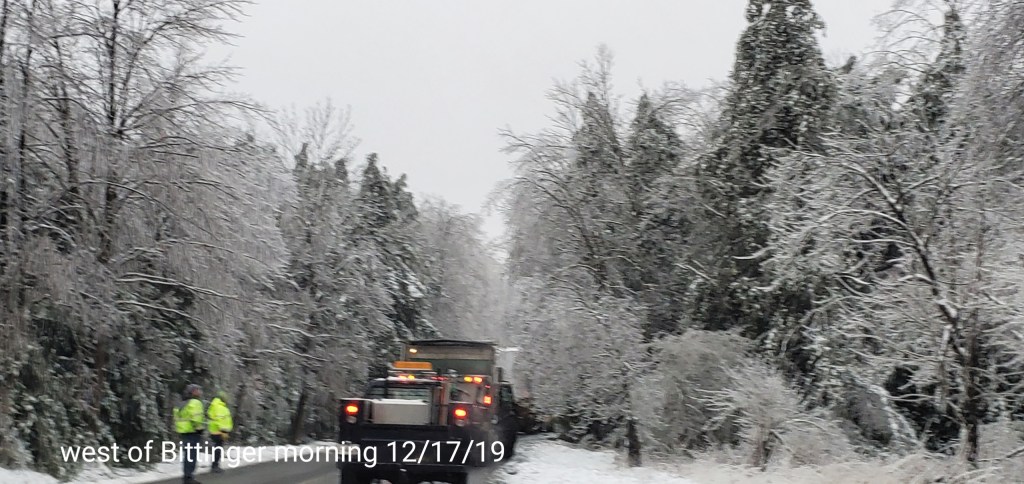
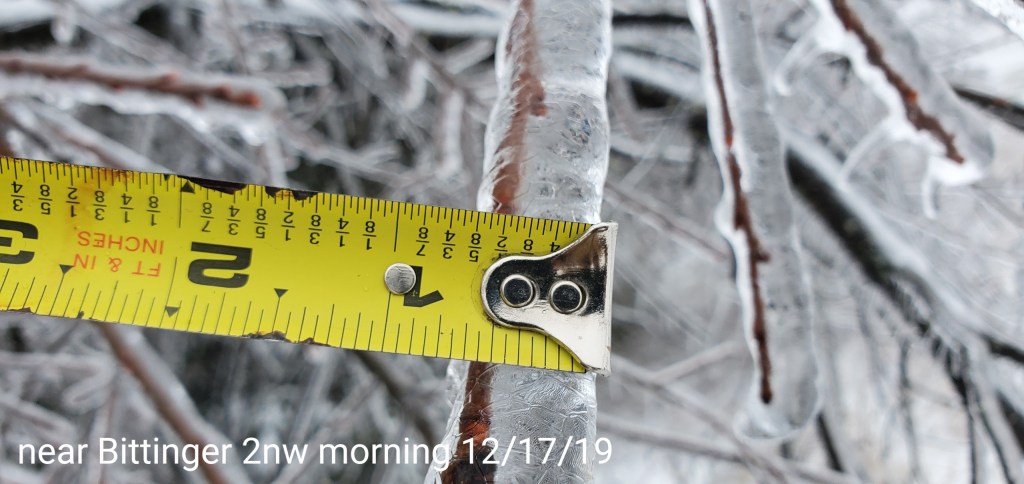
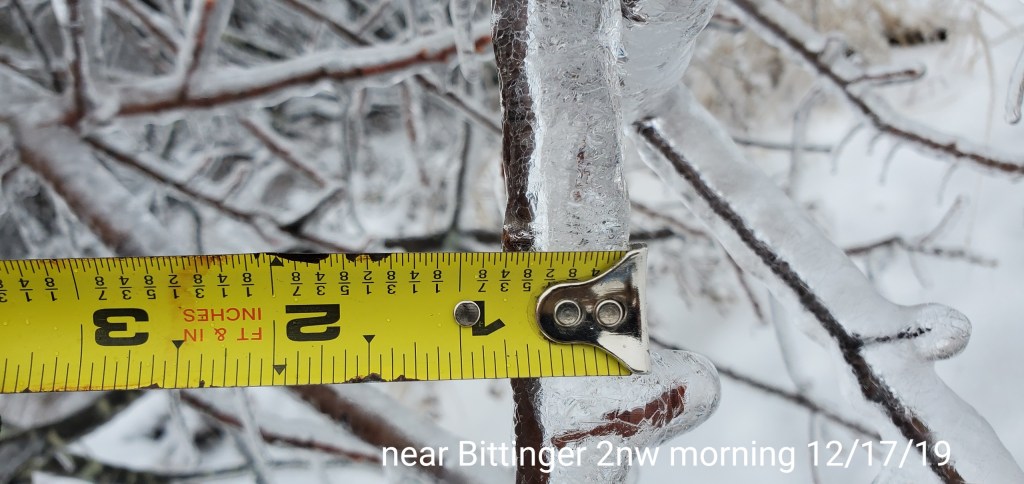
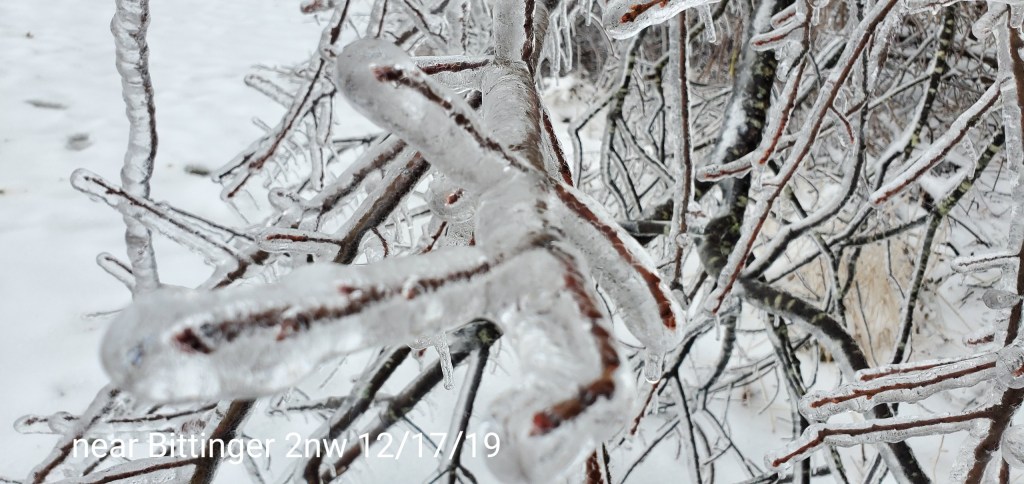
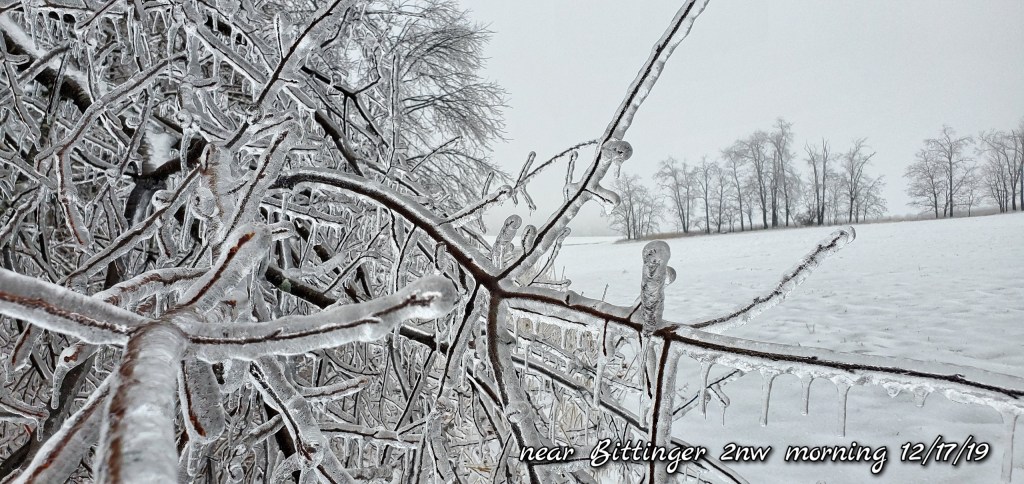
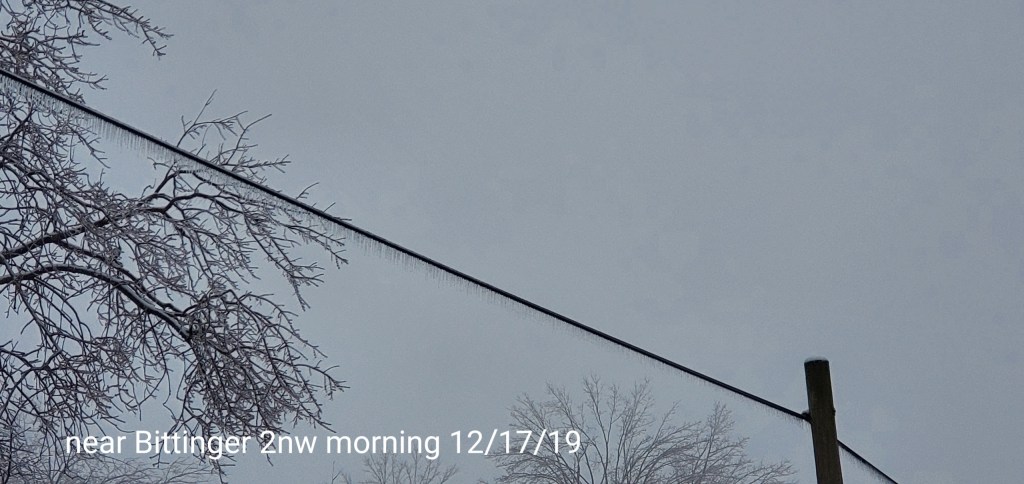
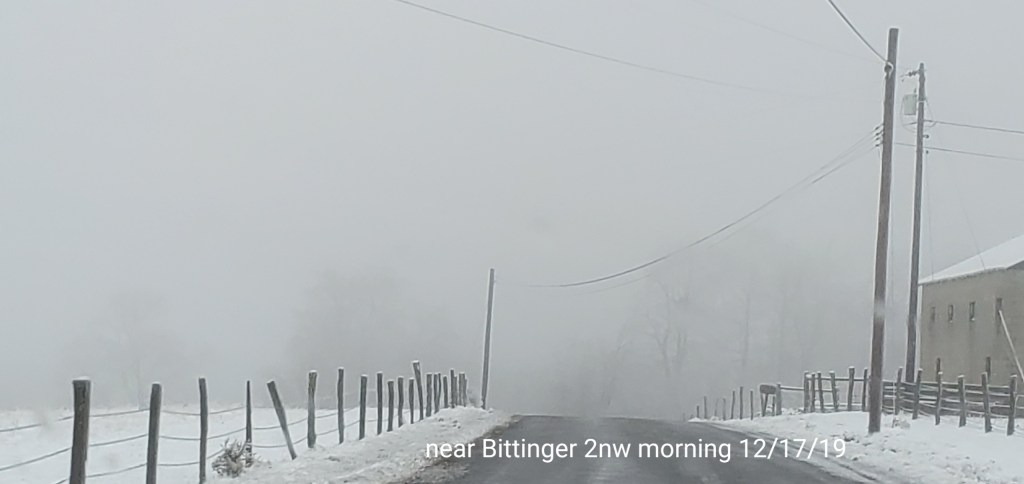
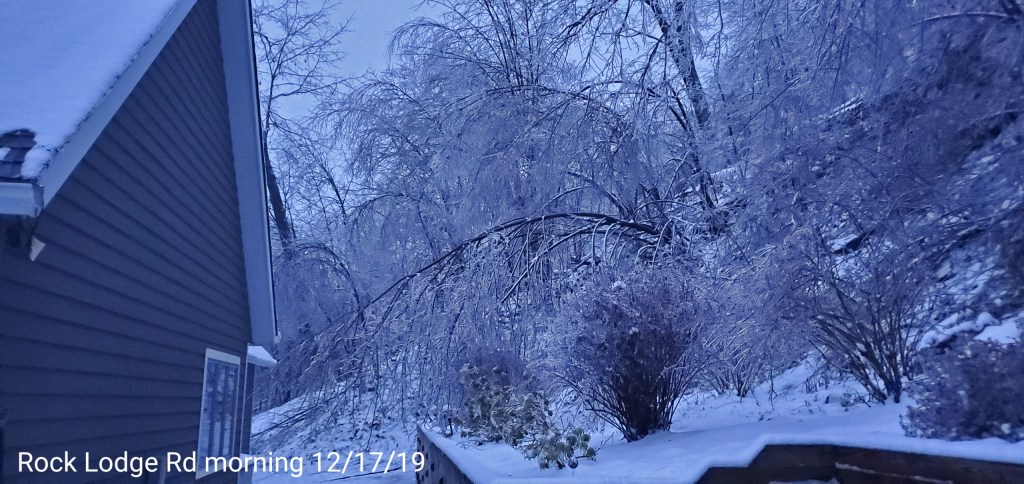
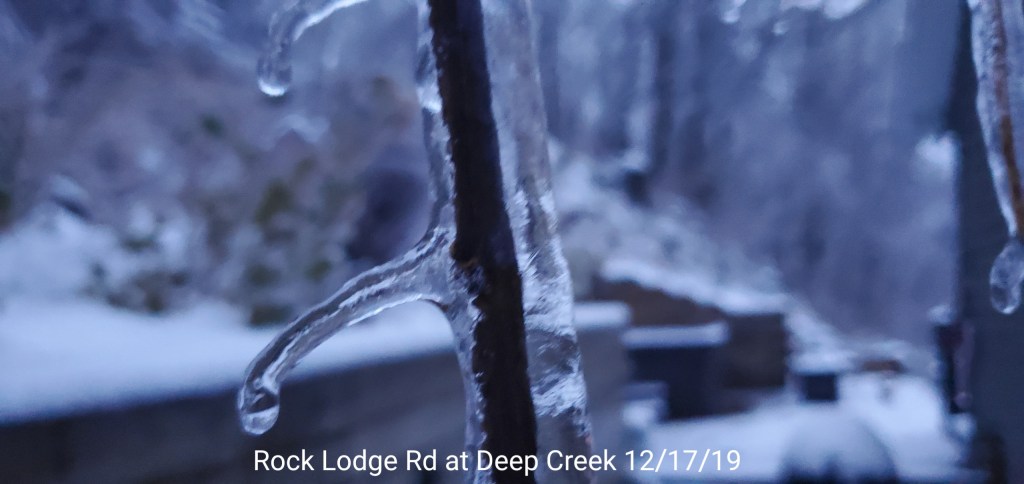
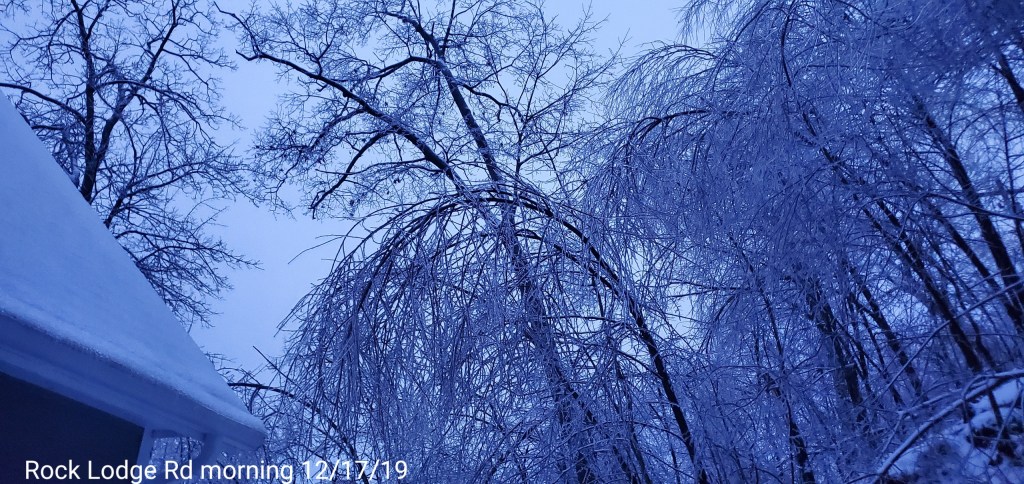
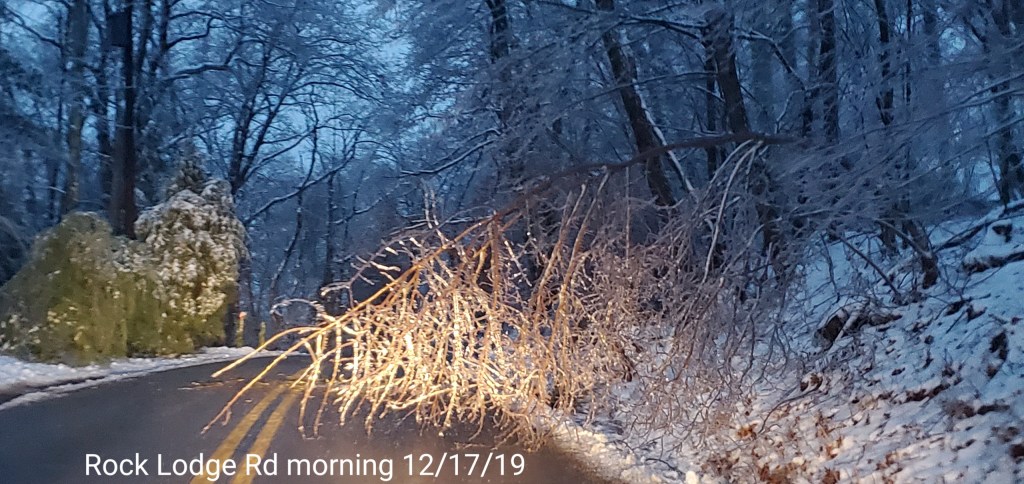
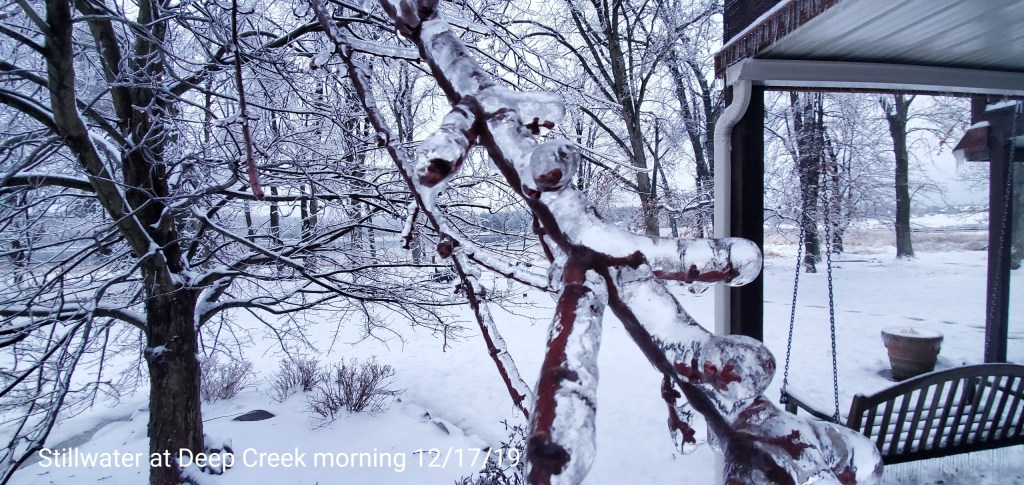
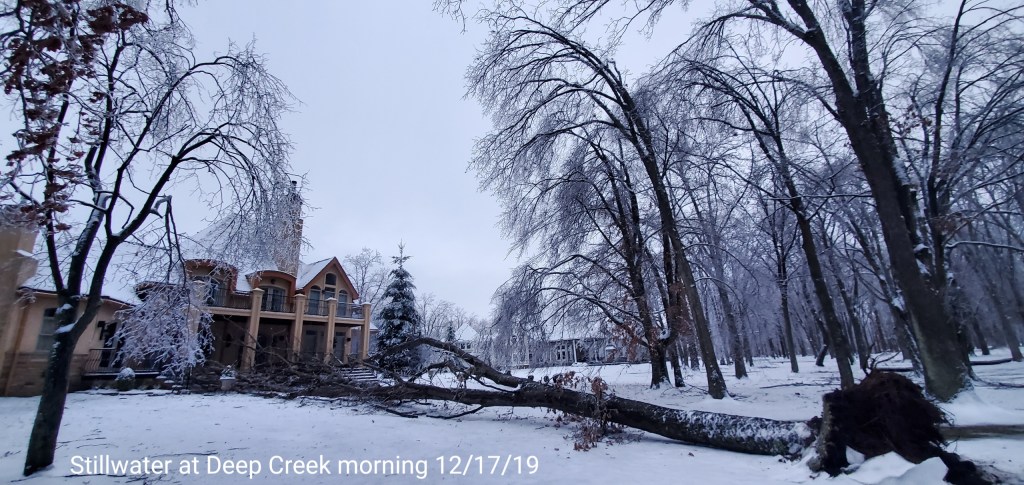
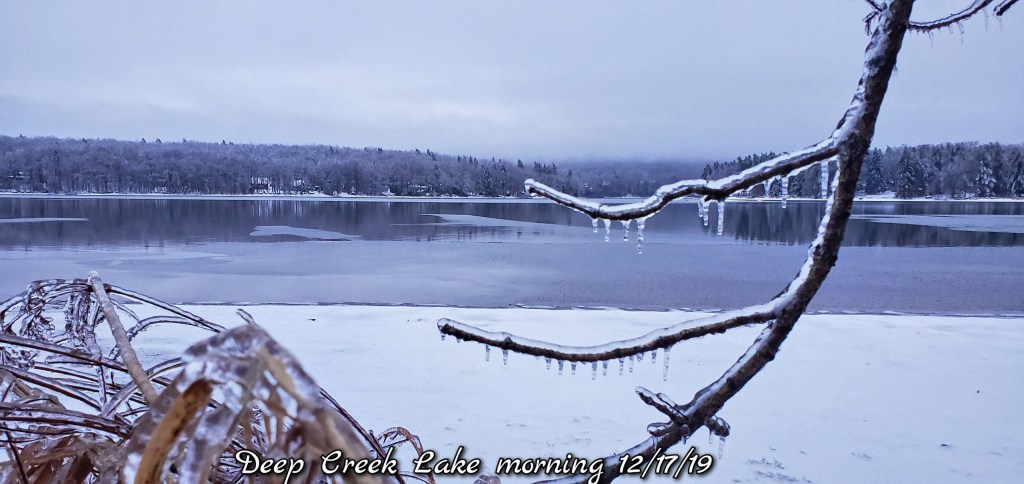
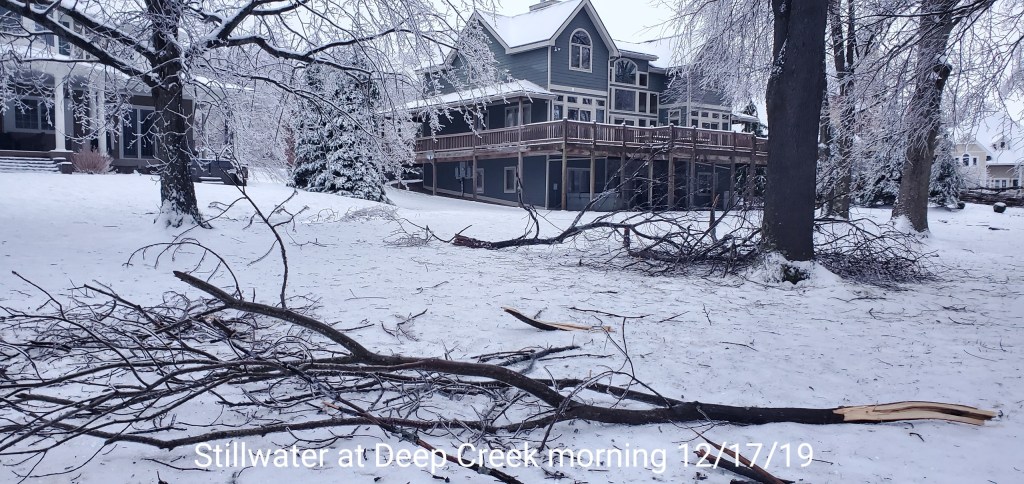
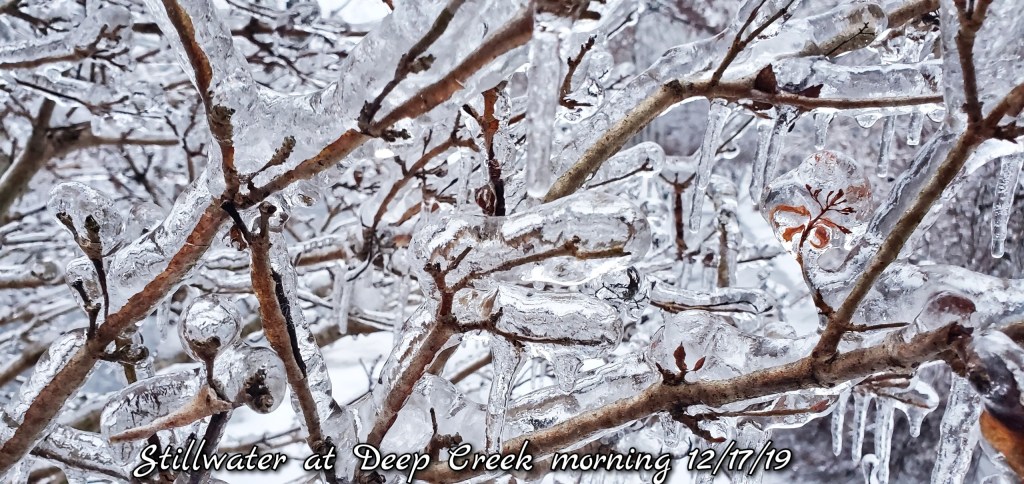
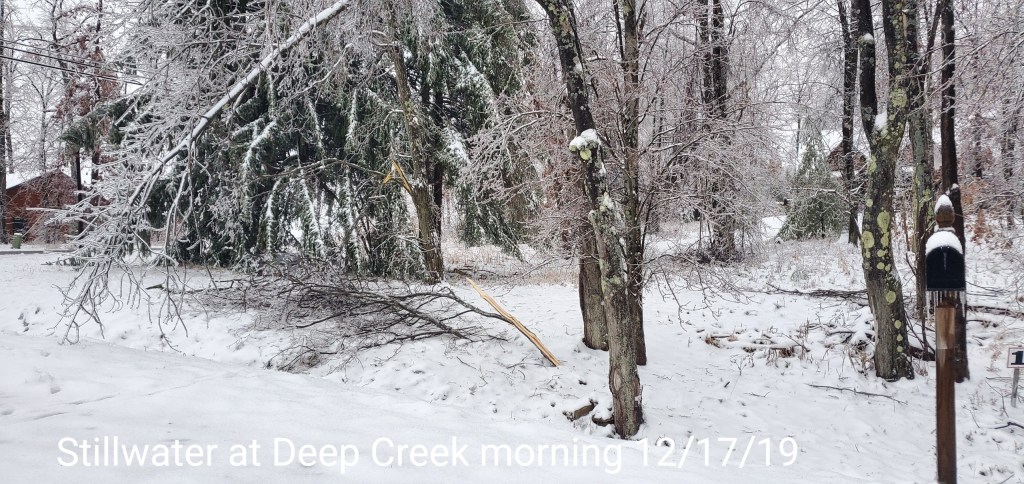
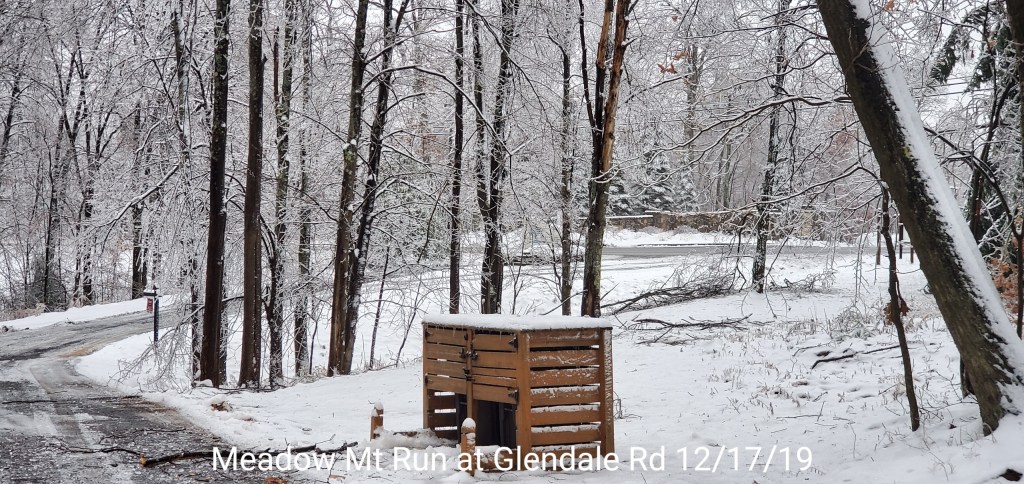
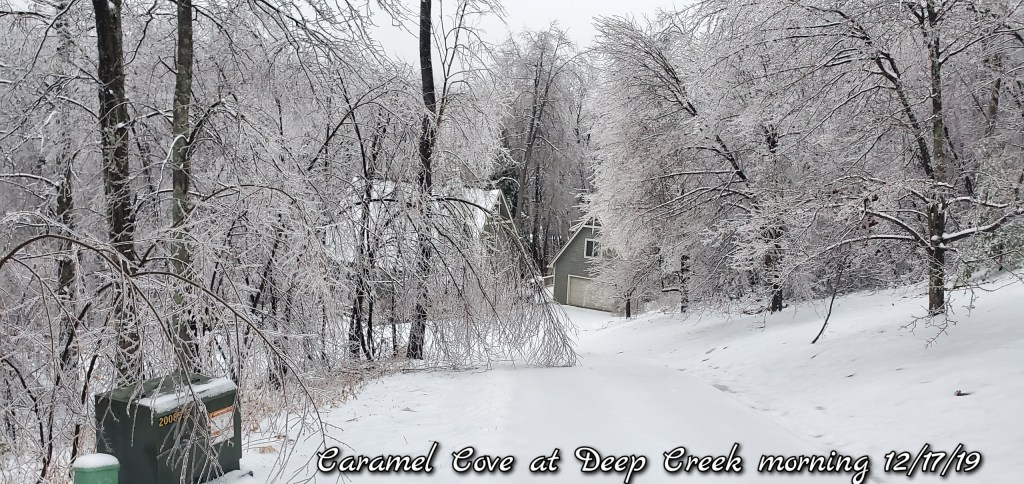
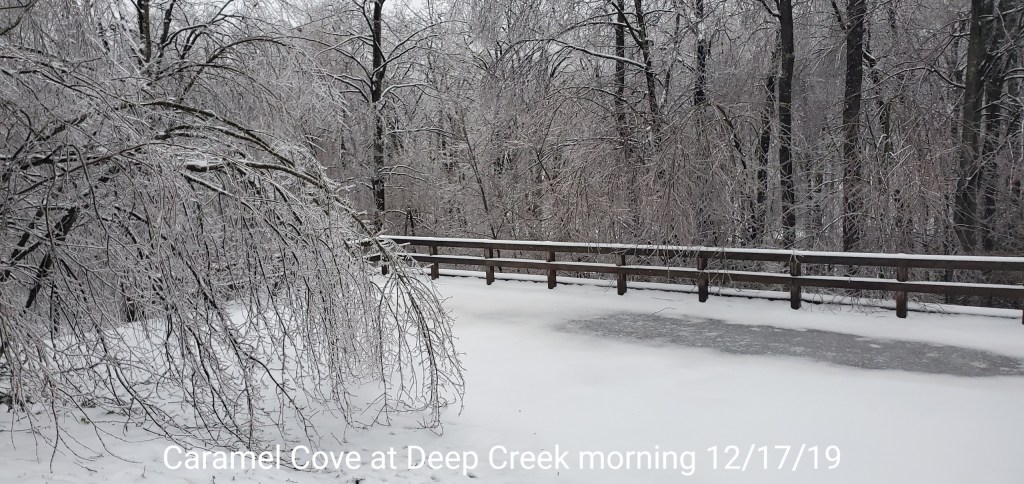
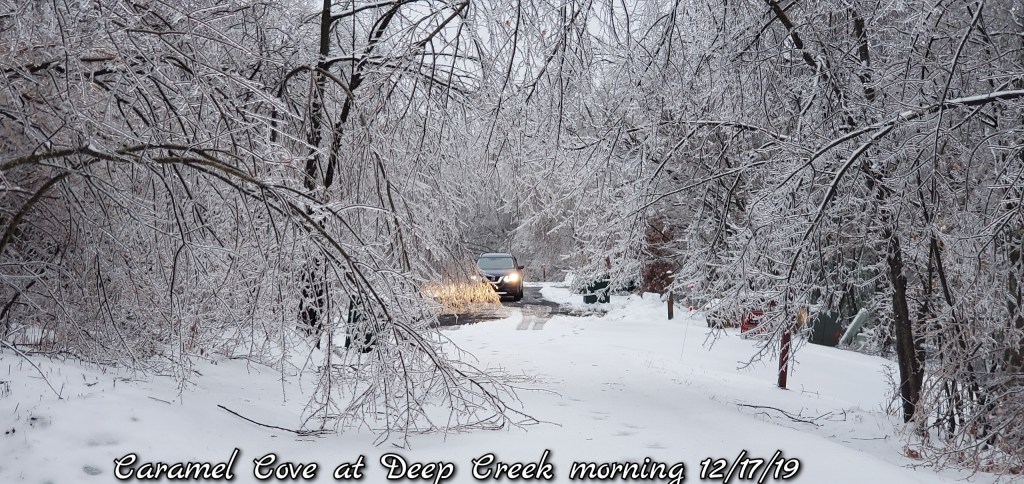
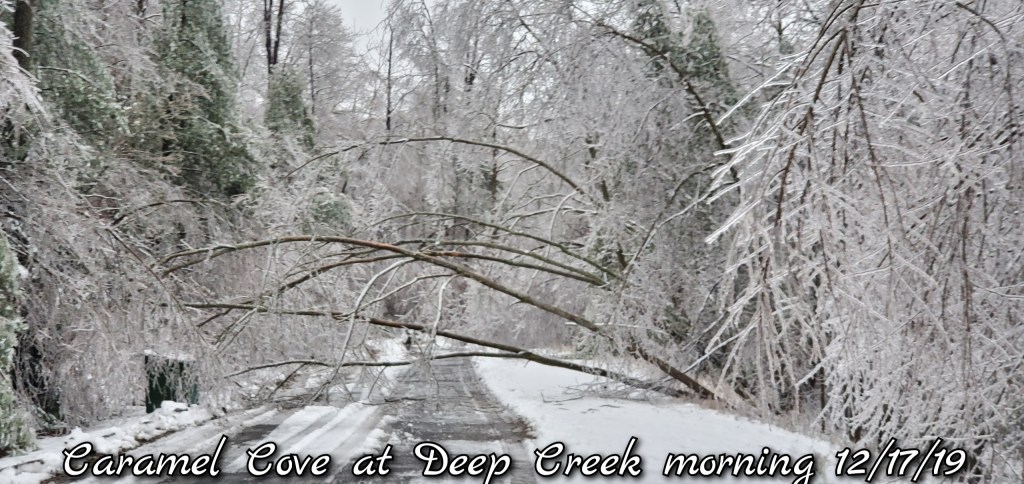
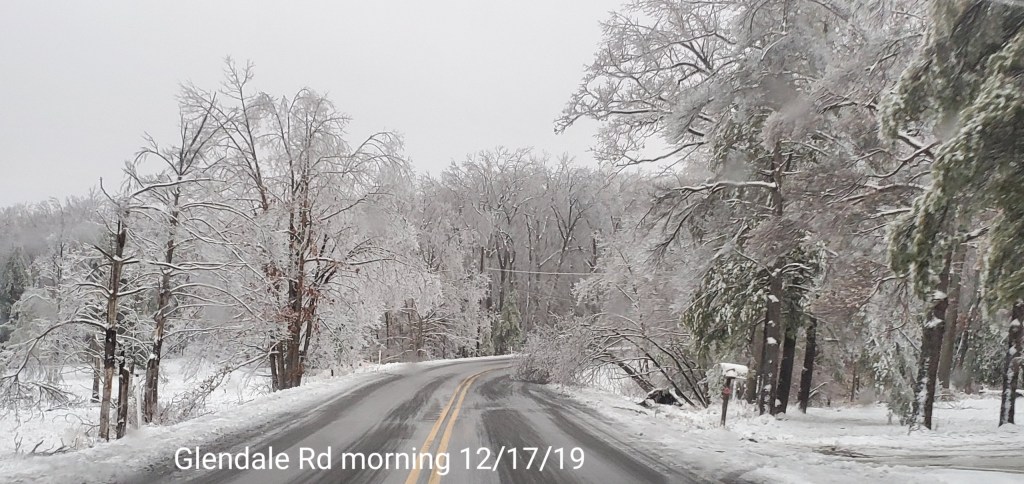
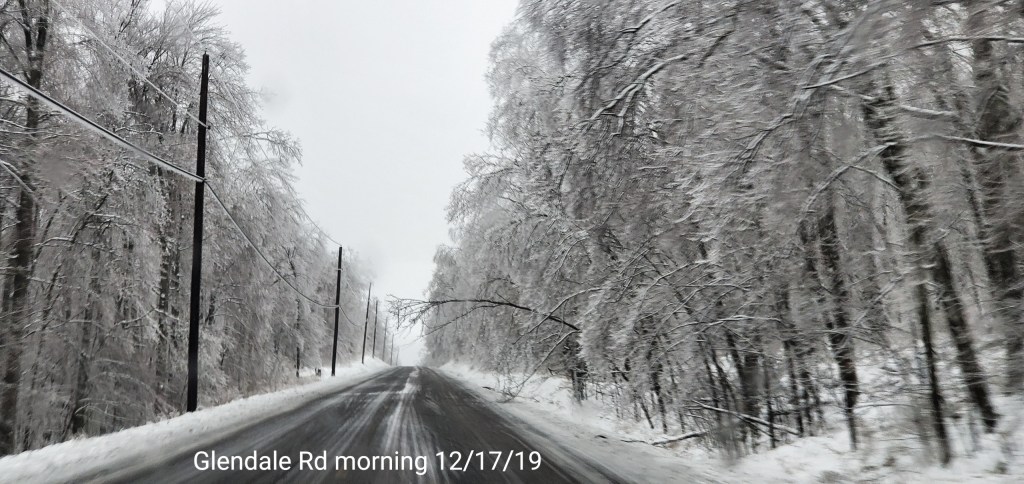
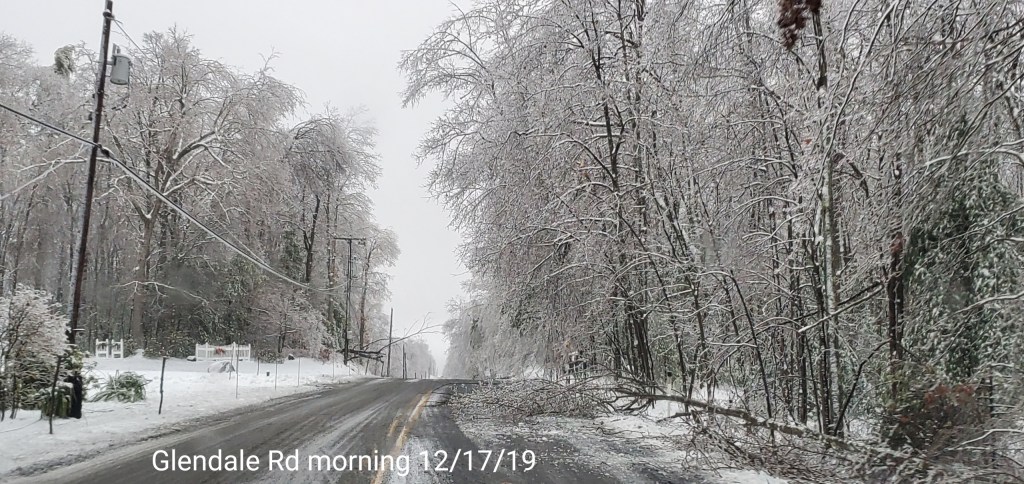
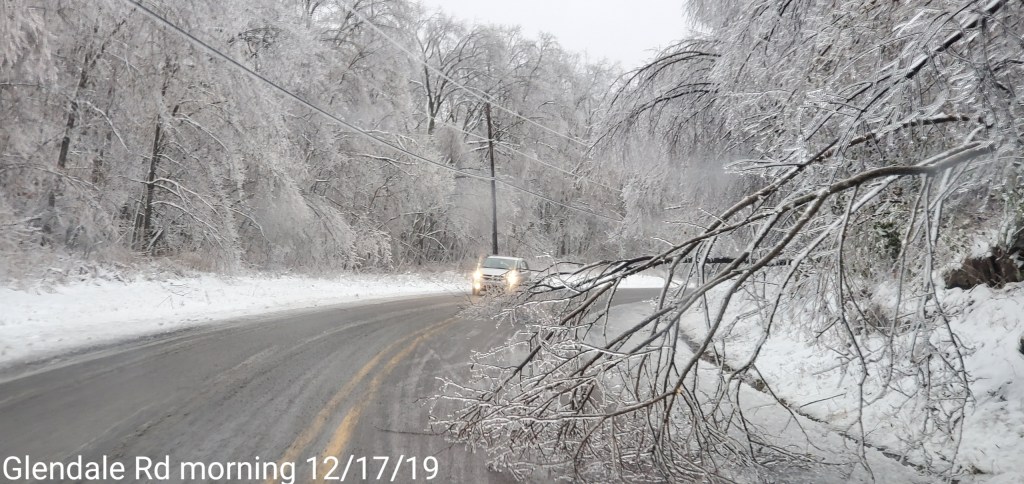
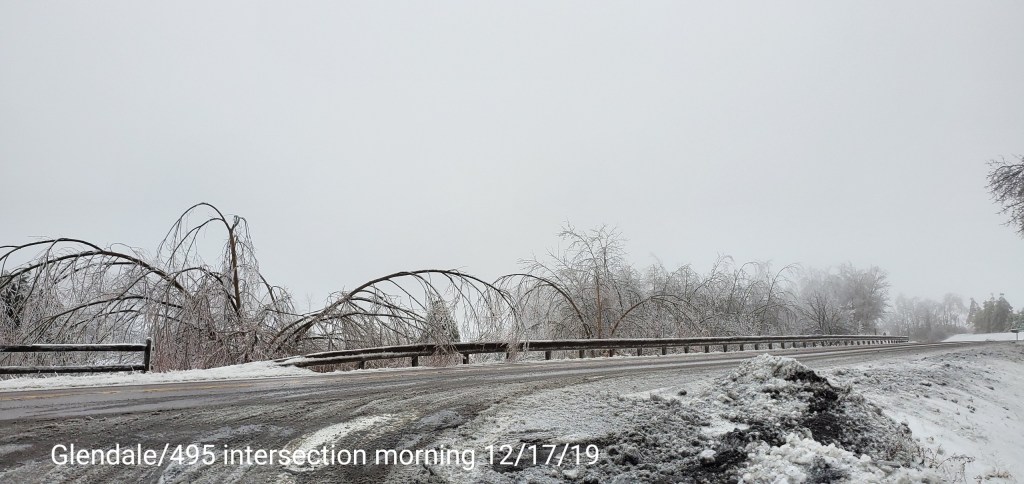
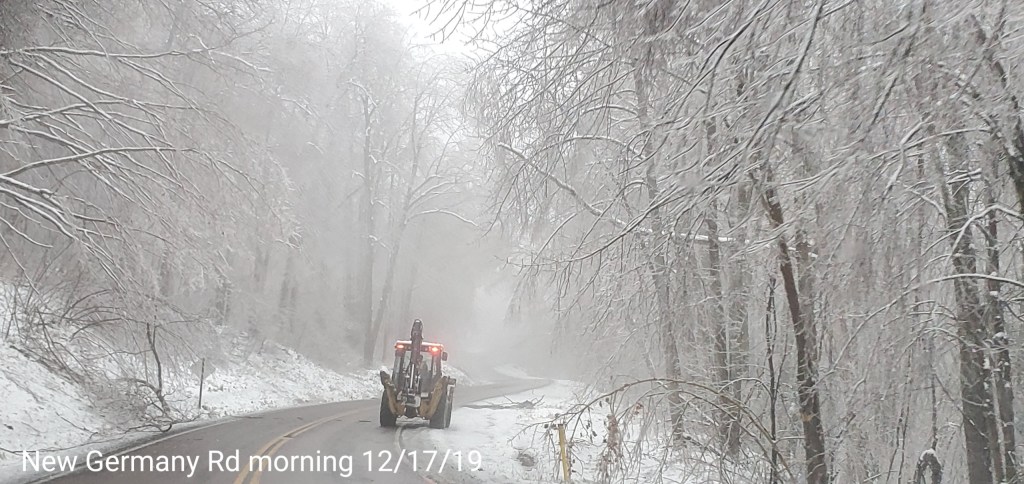
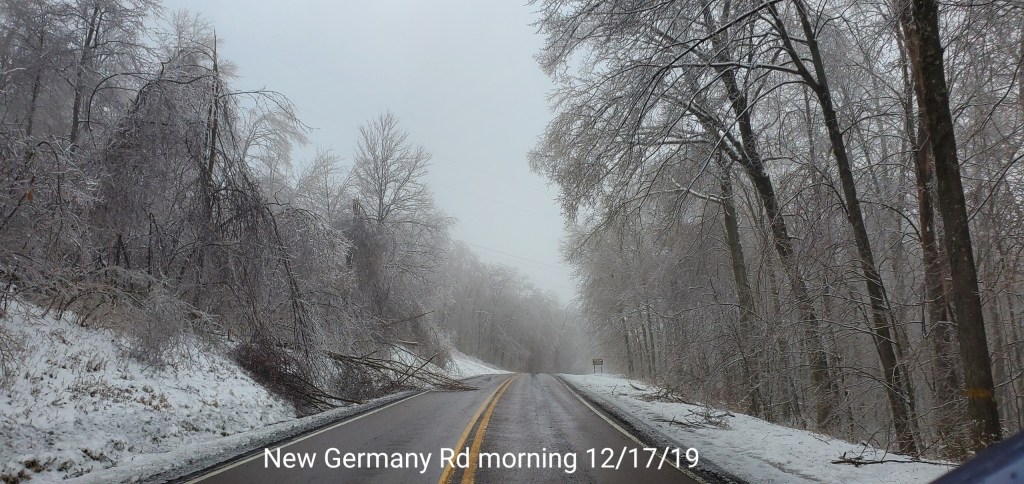
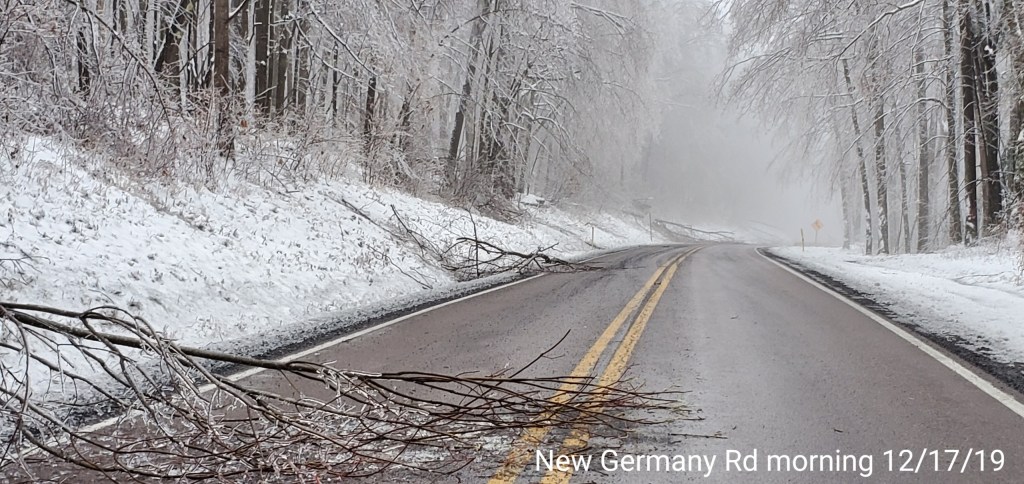
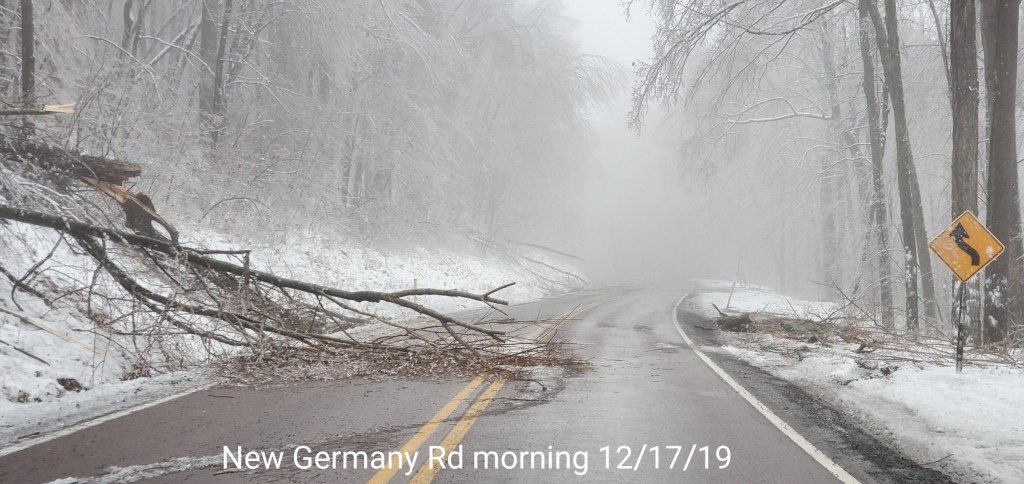
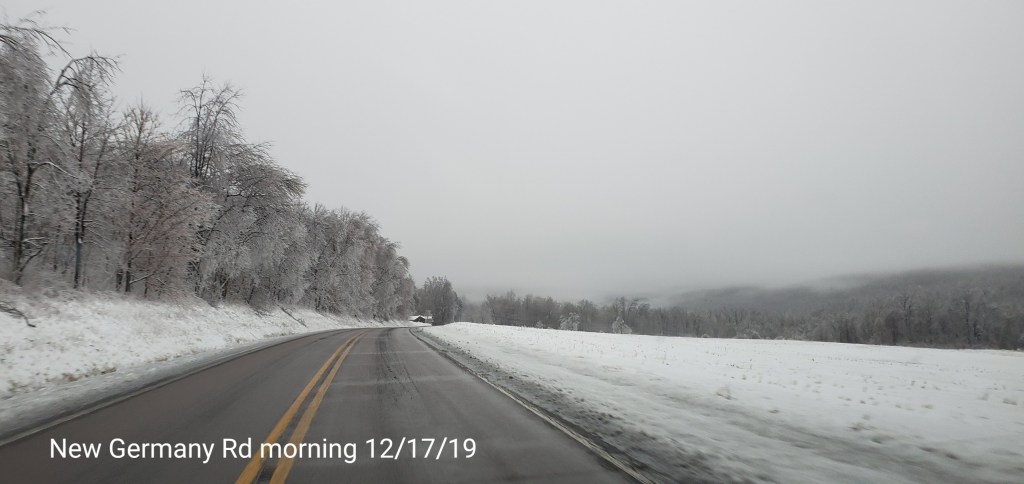
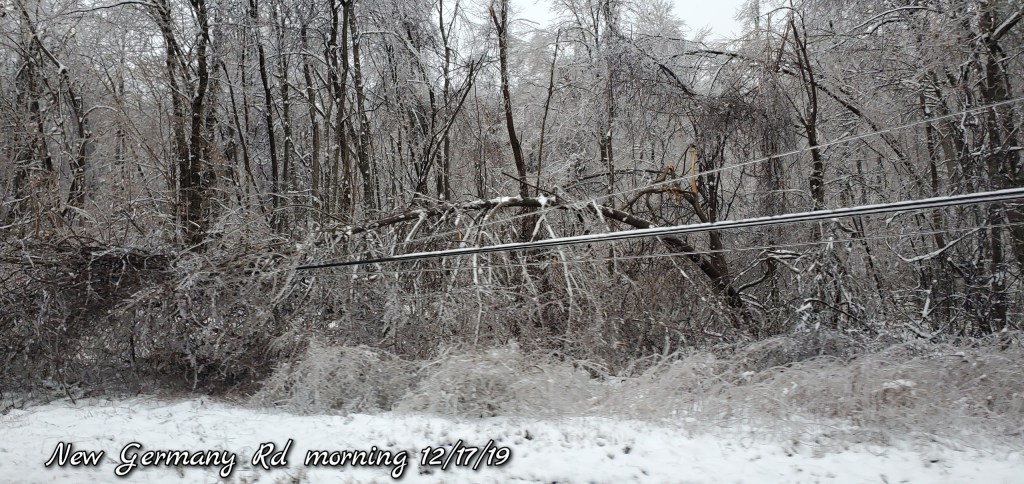
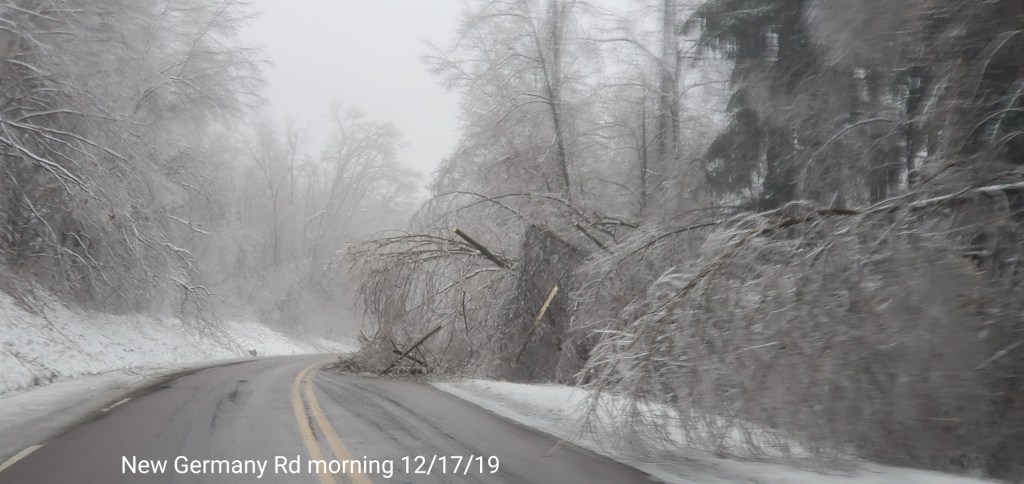
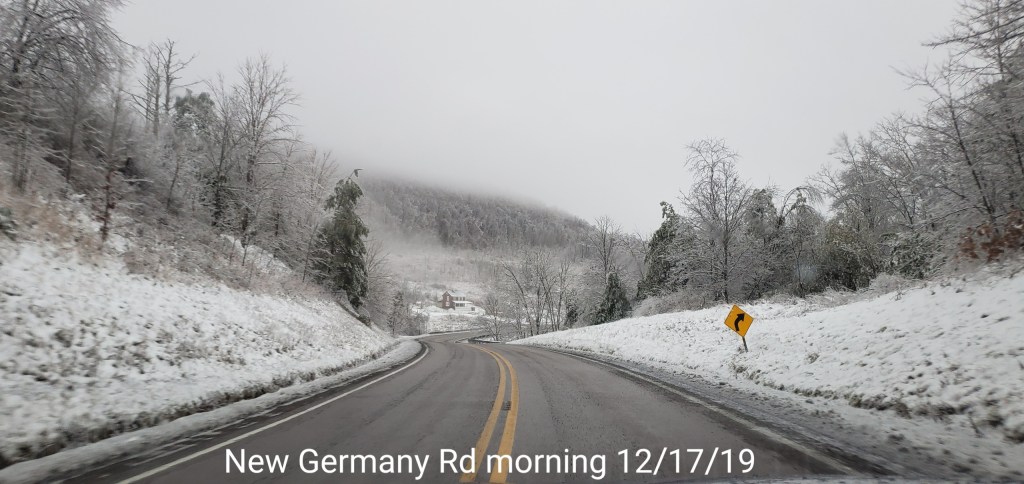
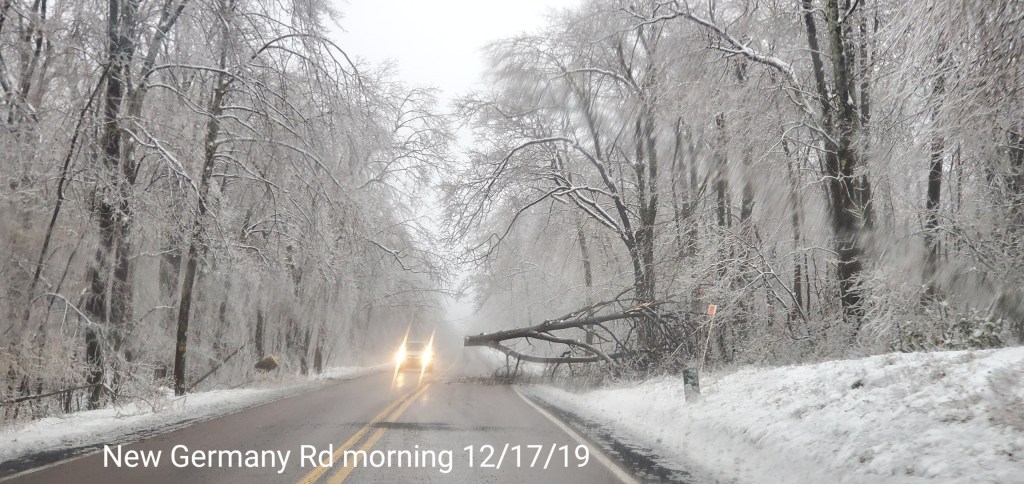
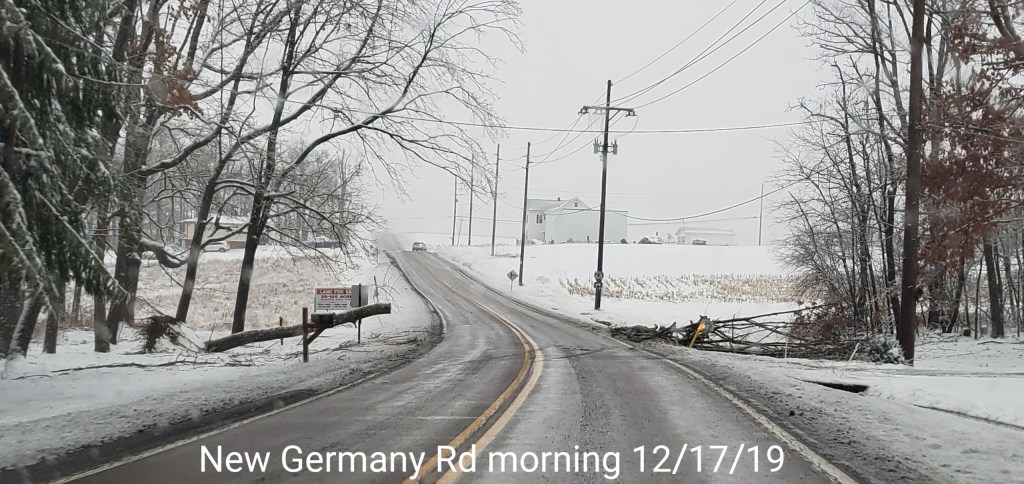
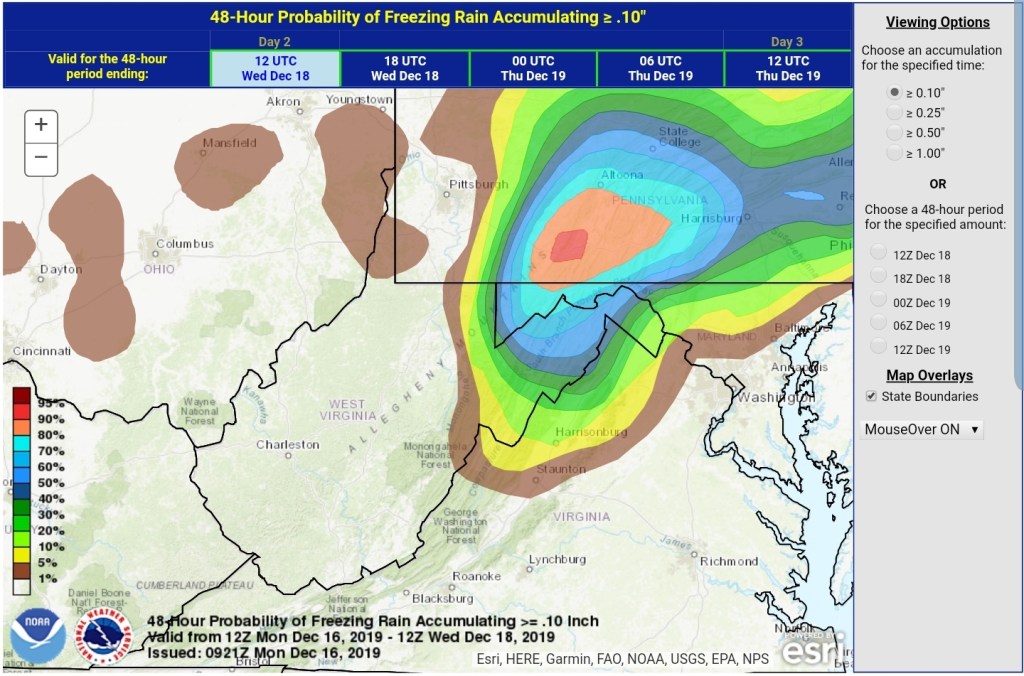
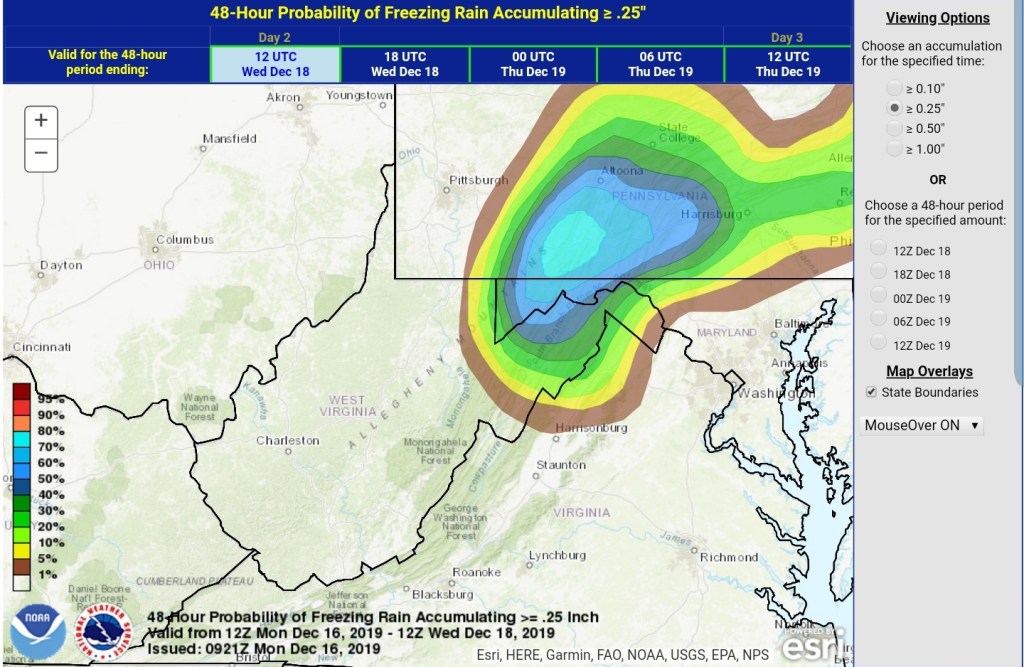
Ice ice baby. Major ice event across the eastern half of Garrett, and in some instances stretched into western Garrett. Overnight as far west as Preston County, before temps moderated there. Trees, limbs began falling 9-10pm and with that, power outages began. Some roadways blocked. All the while, very mild air and a rain out just to the south in Wv. Temps fell to the upper 20s at Mt.Storm early overnight last night, but sat at 50 this morning while below freezing remained in areas in Garrett. A brief surge of milder air came across mid morning, however not enough to scour out the cold in the high valleys in Garrett. The highest elevated areas in the ice zone lost more ice than the lower elevated areas with the brief mild surge that was followed by wind and colder air by midday. Leftover rain today changed to snow early afternoon as the colder air returned. Ice never came off the trees. Some high ground saw a little more melt than valleys in central Garrett with the slightest intrusion of mild air mid morning.
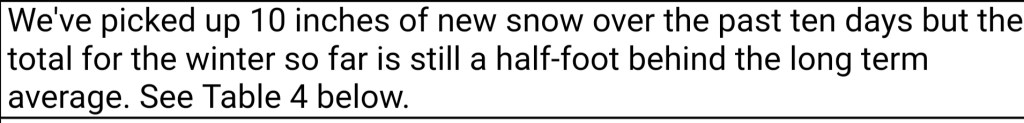
Snowfall season to date total 16.7, minor accumulation through nightfall to be added tomorrow
Freezing rain amounts, always a difficult judgement as freezing rain varies object to object. If its wind faced, if its marginal more can run to the end of tree limbs vs the upper parts etc…that said .4 to .6 range was common.
Garrett College
Due to the power outage, data is missing for the first 10 hours today. That leaves today’s data incomplete at GCC. The min temp does stand as the min as that occured after power was restored.
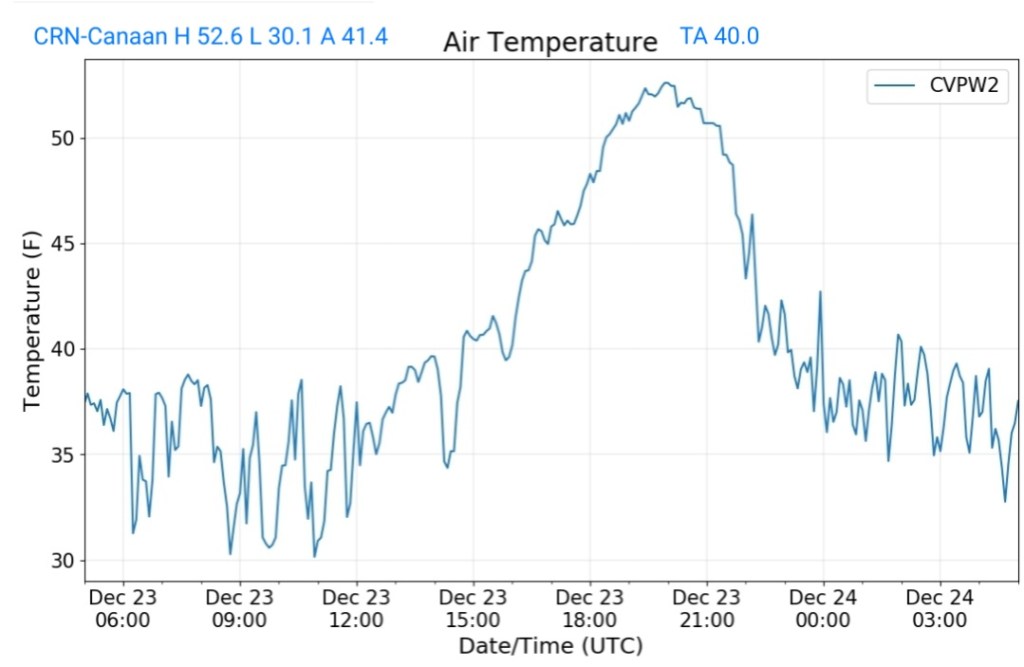
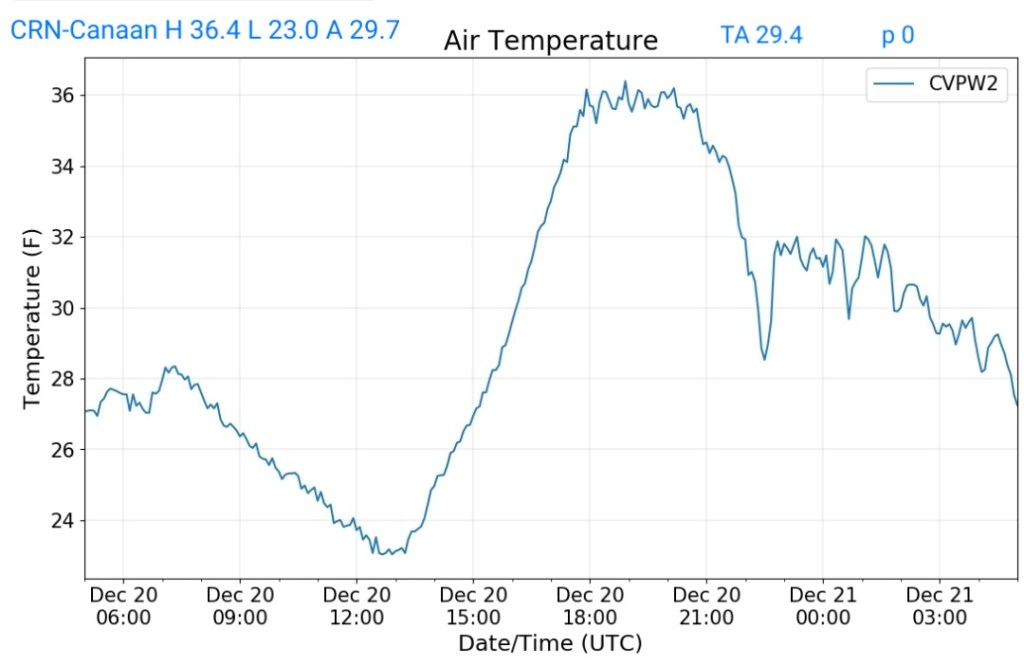
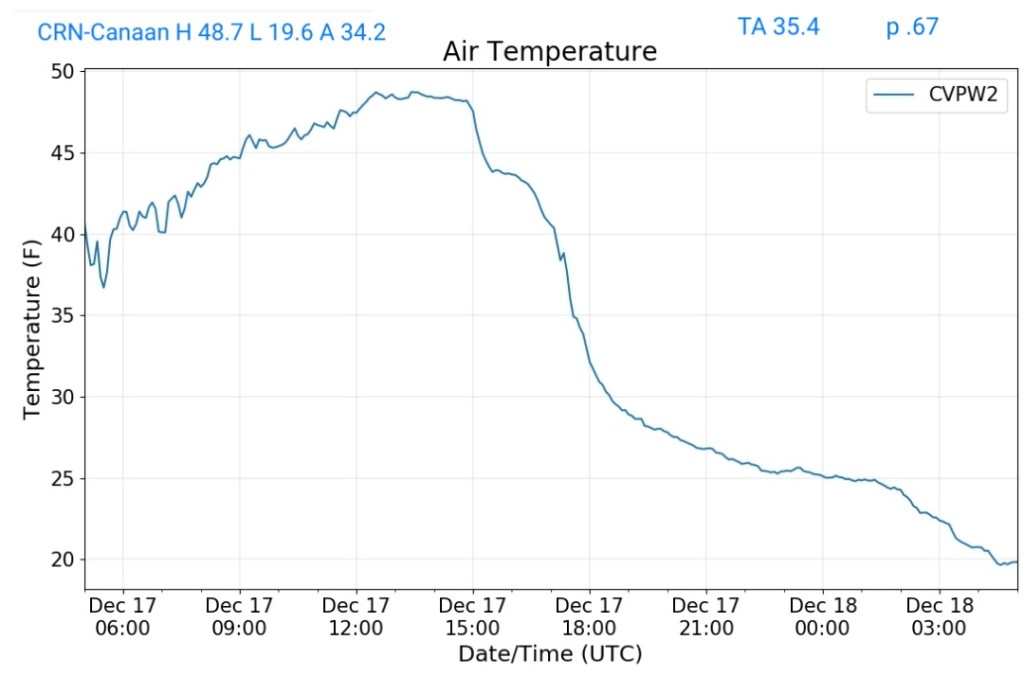
Canaan Heights/Davis 3SE
This zone remained in the rain
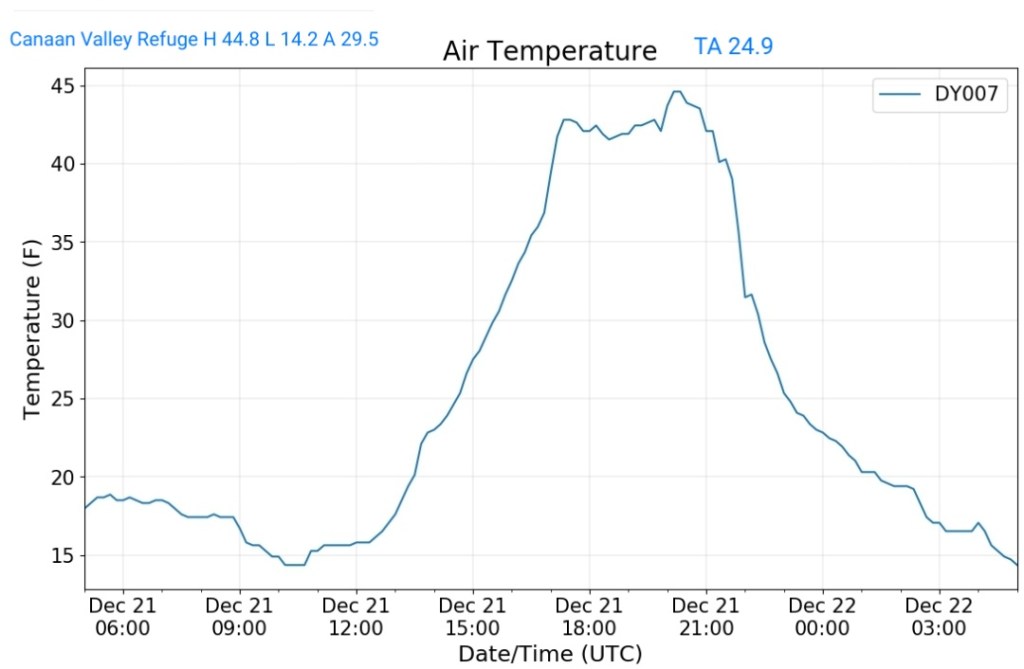
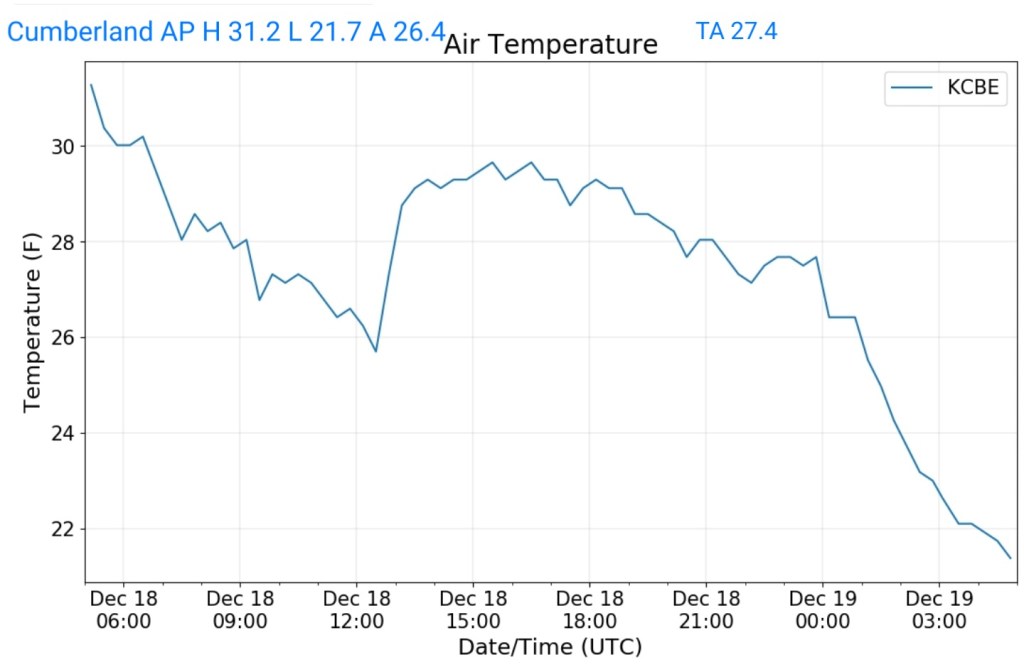
MIN[14.2]—MAX[48.3]—AVERAGE MEAN[31.2]
Snowfall stands at 26.3″ additional today will be added in the morning
Surface features and 500mb height anomalies and flow
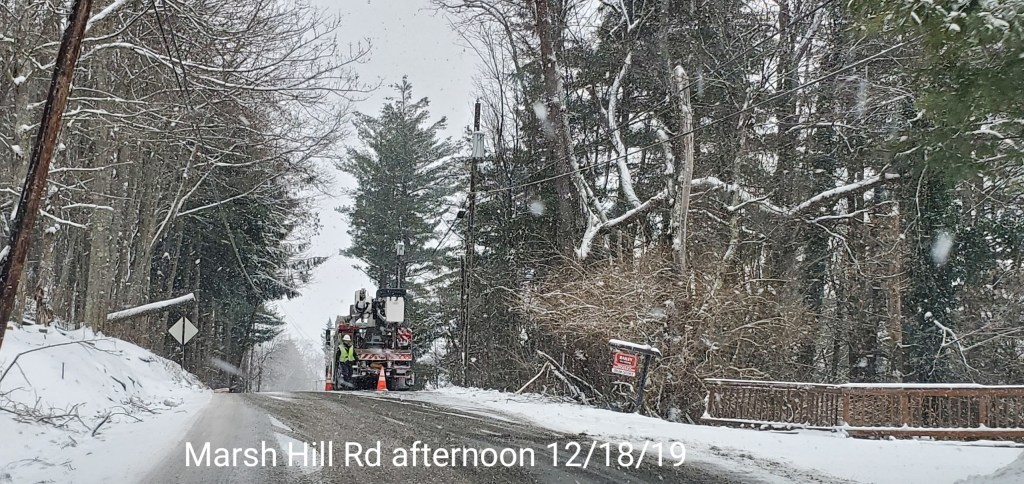
Pics to come…
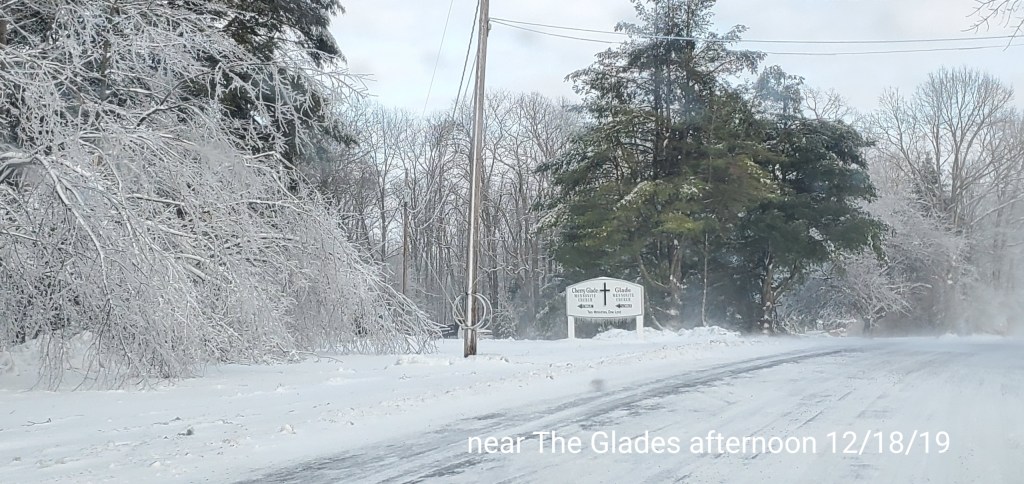
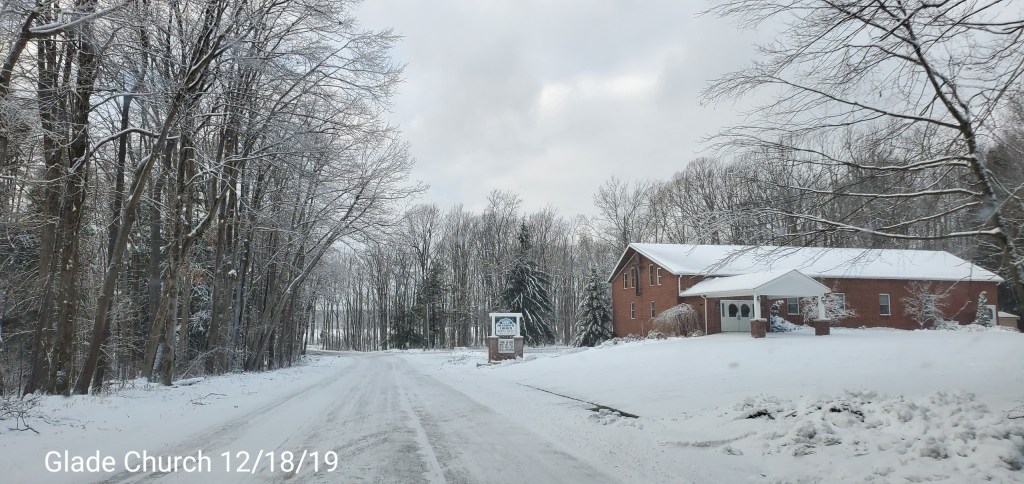
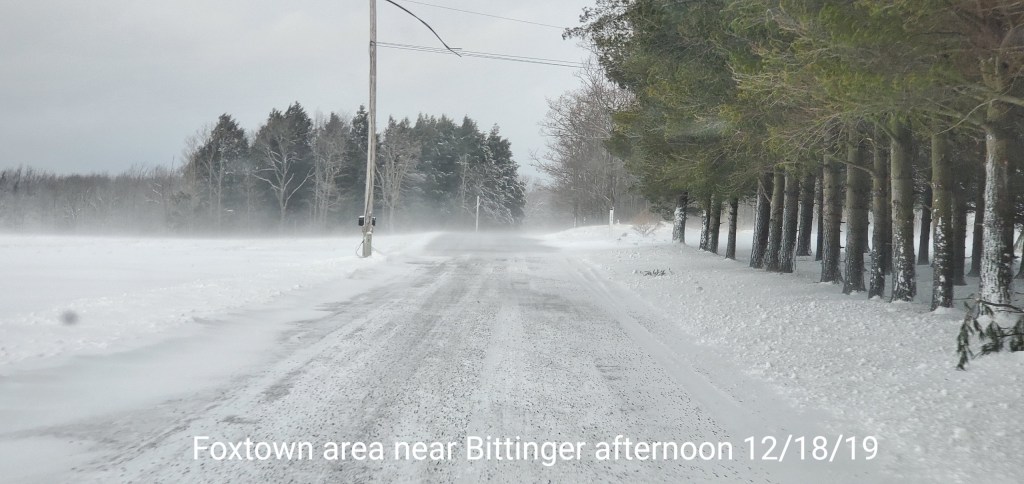
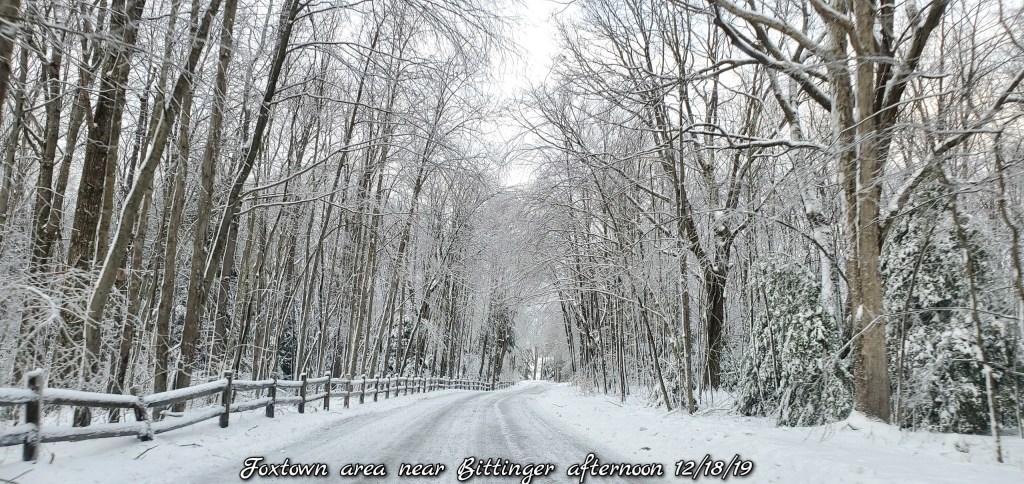
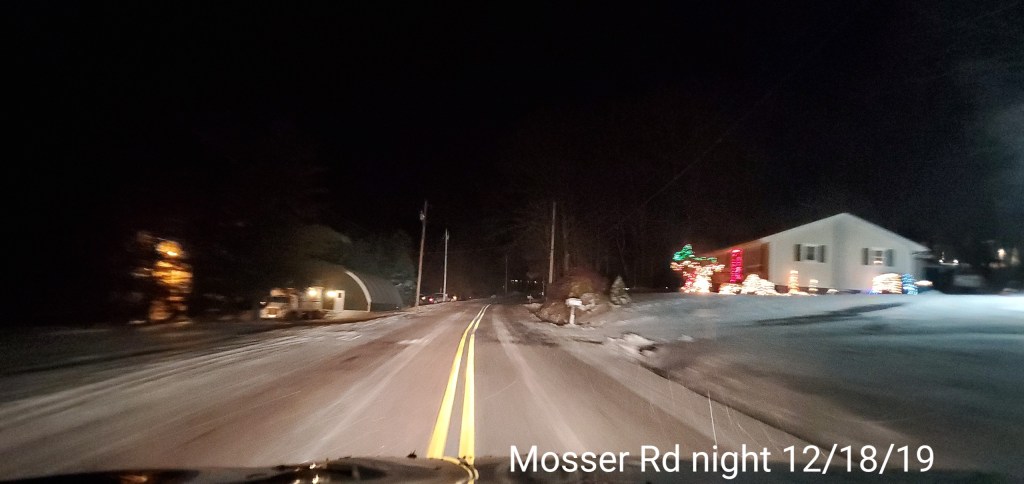
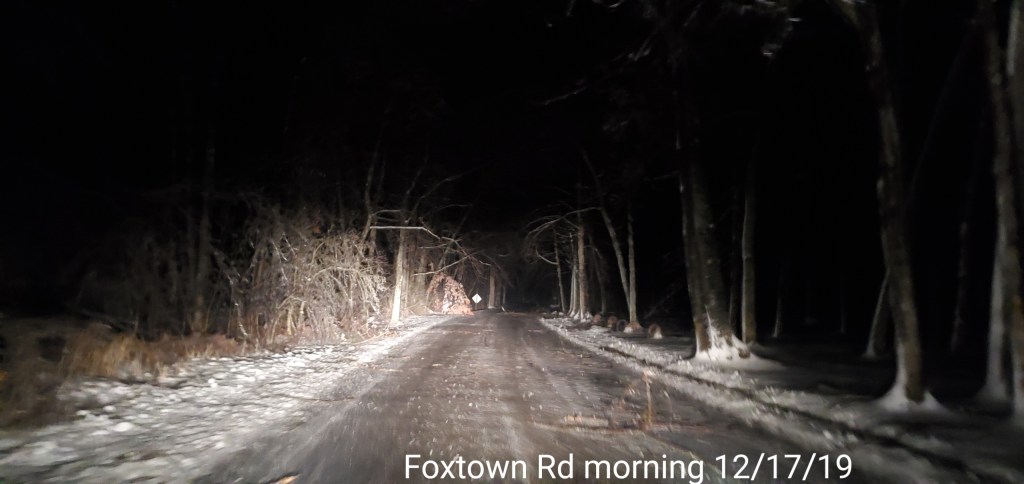
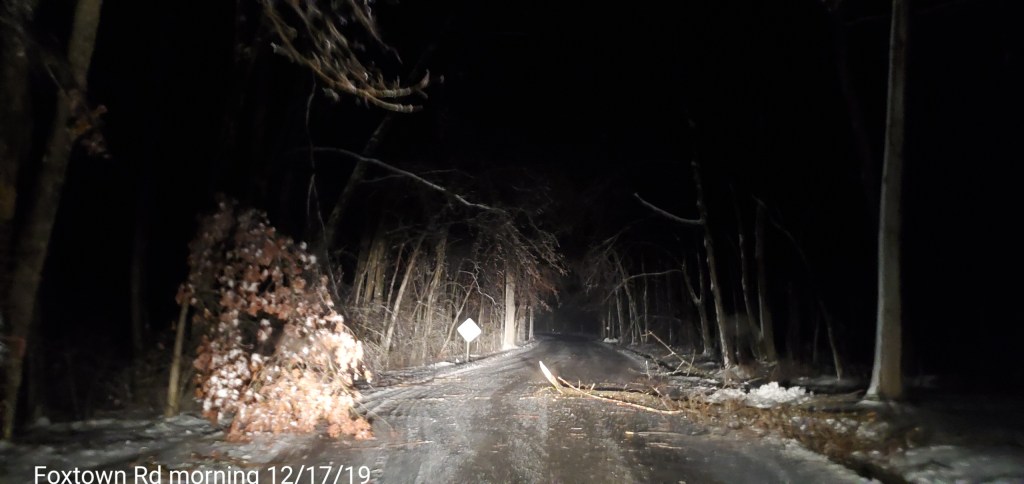
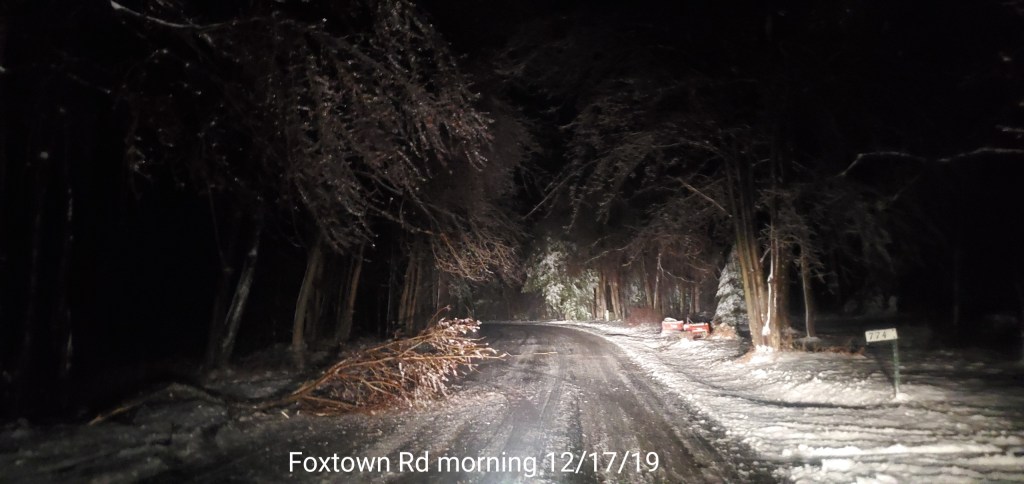
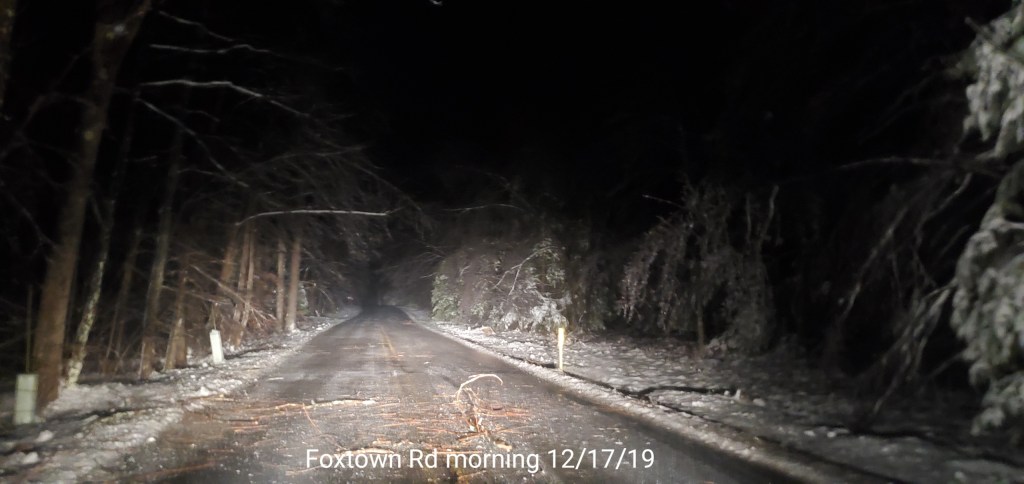
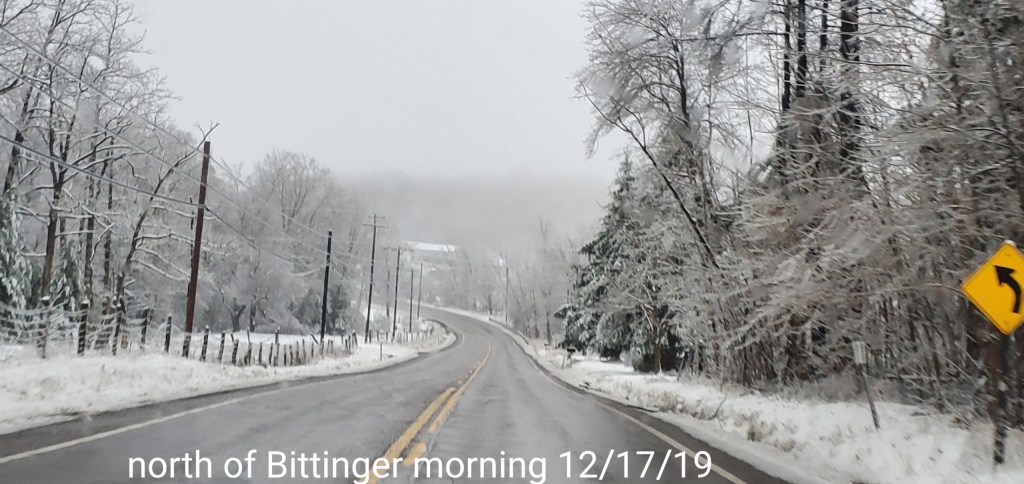
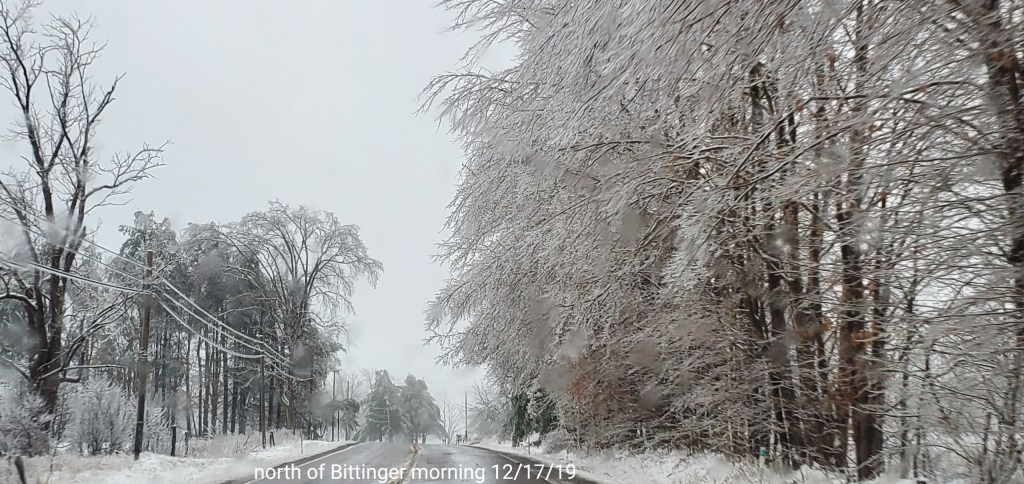
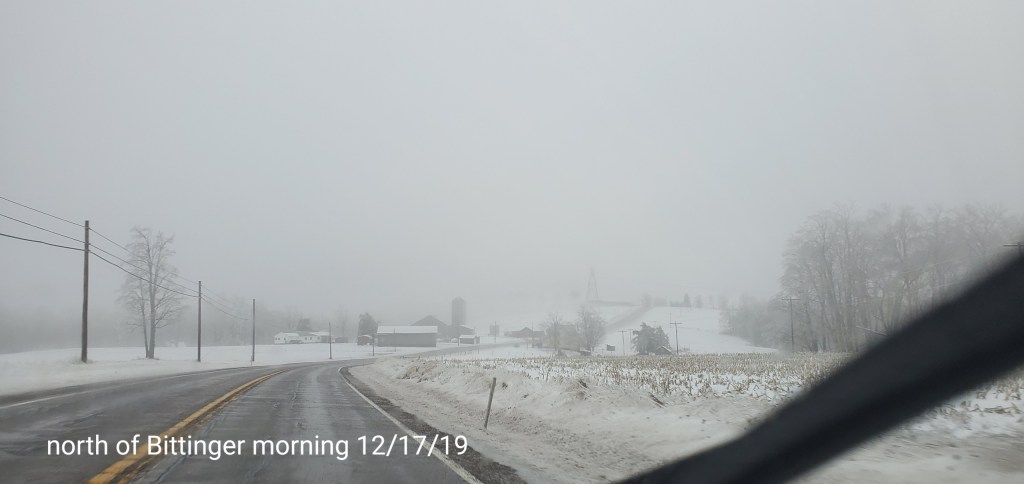
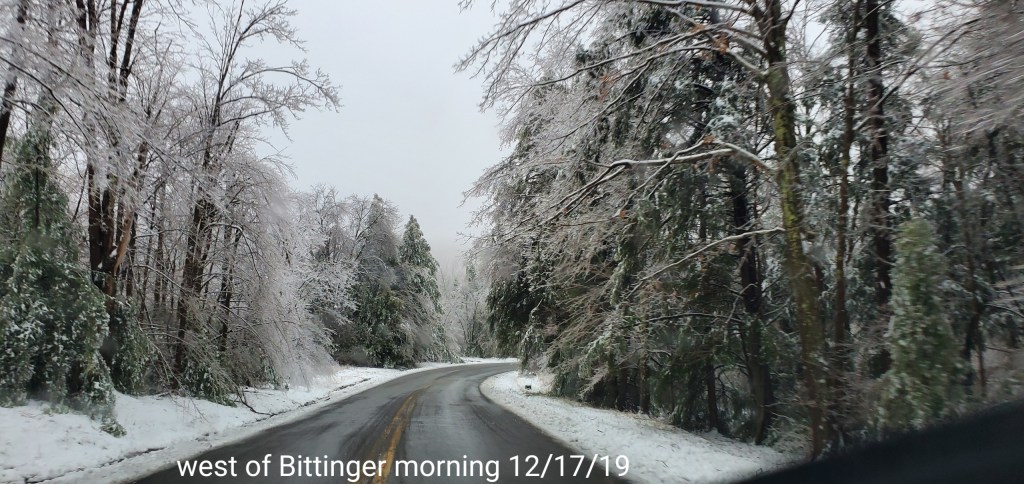
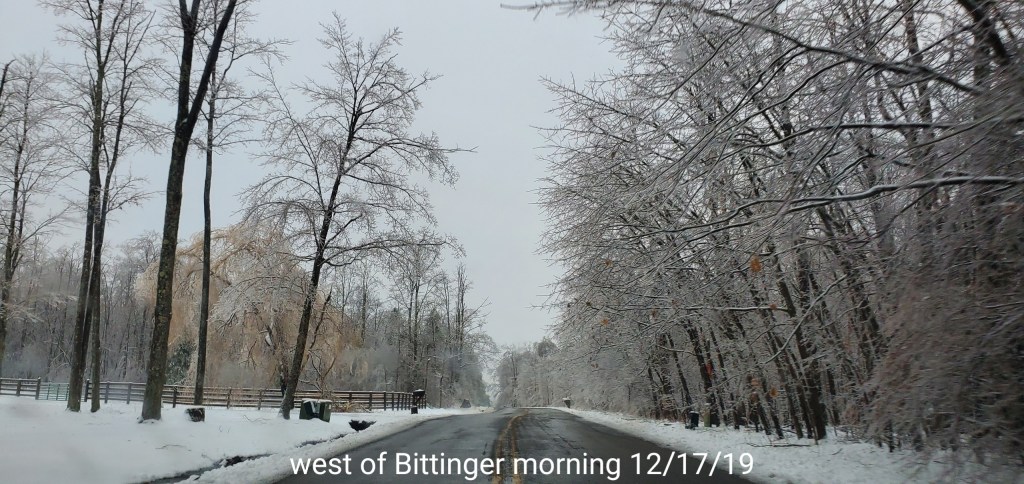
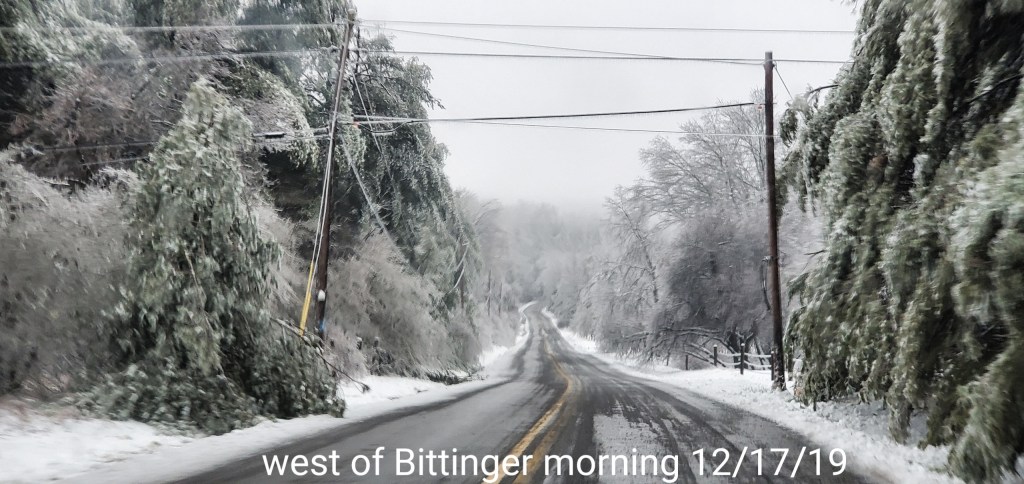
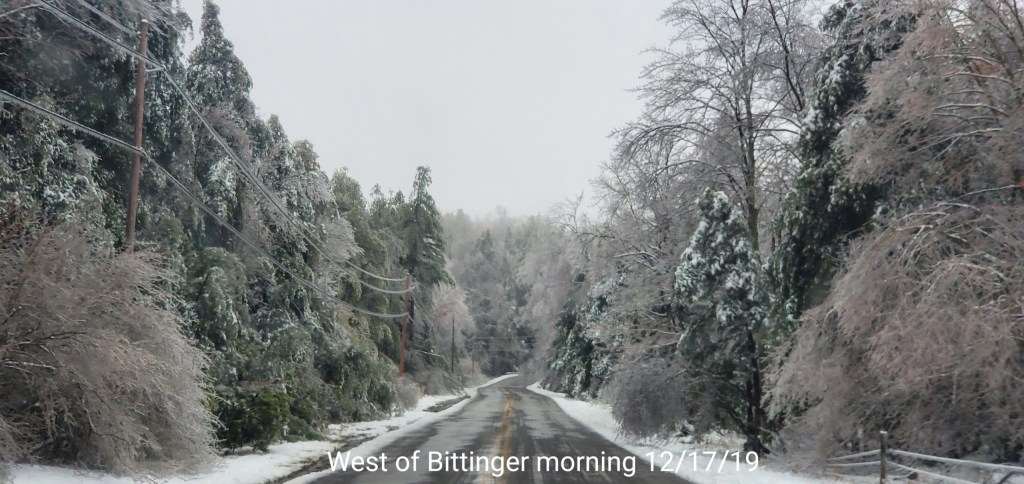
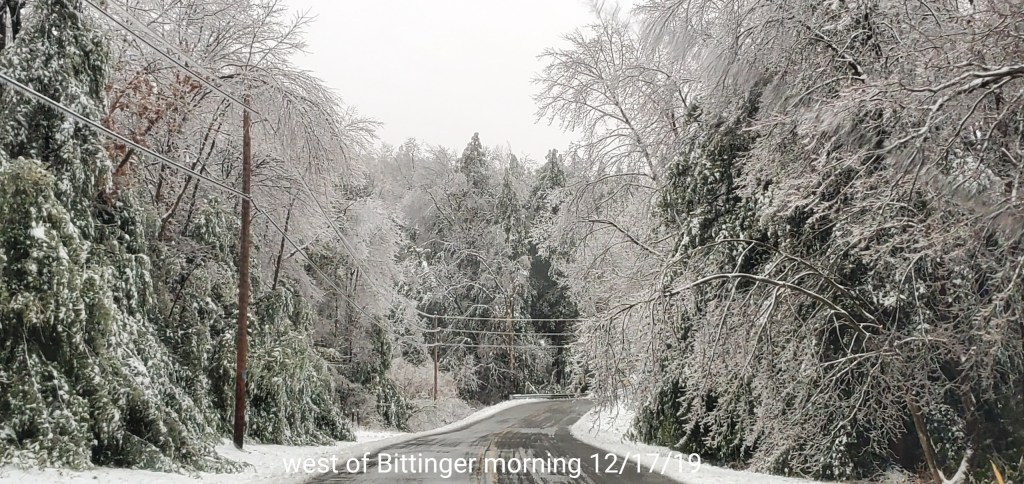
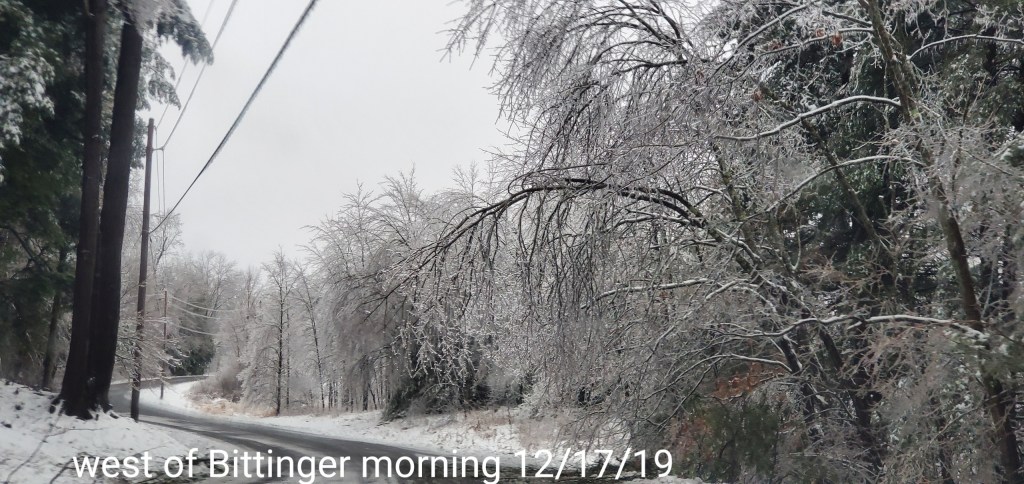
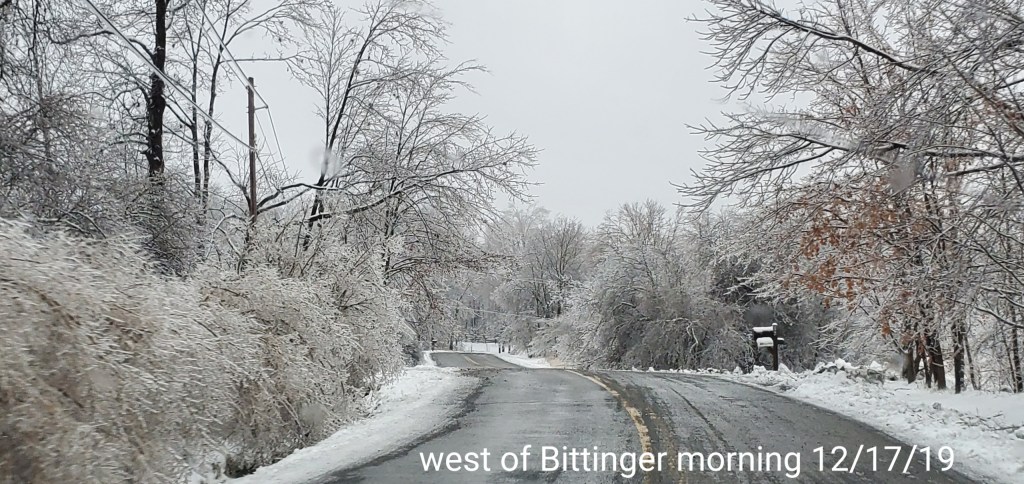
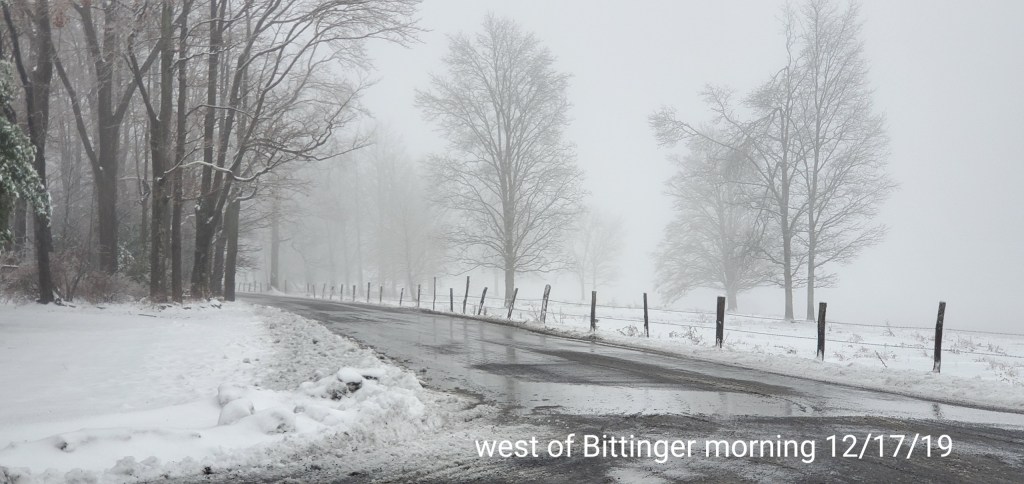
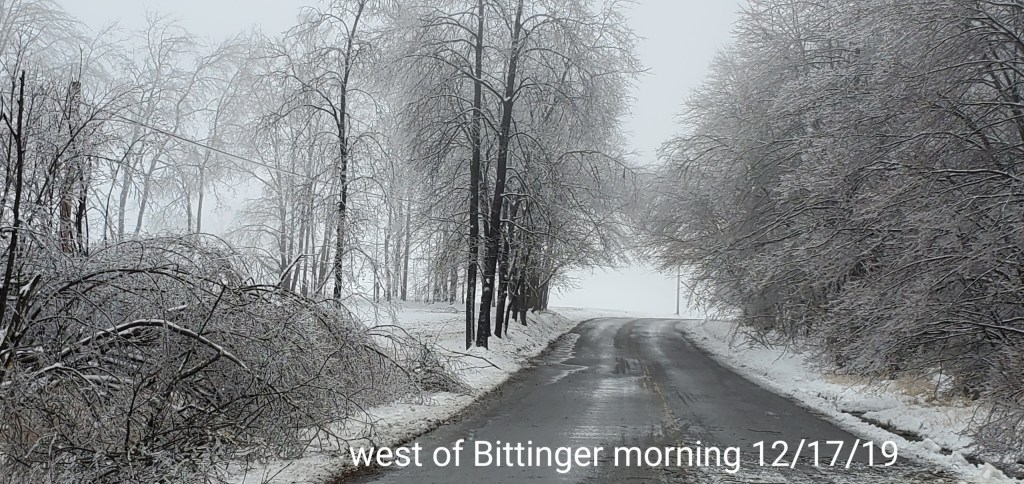
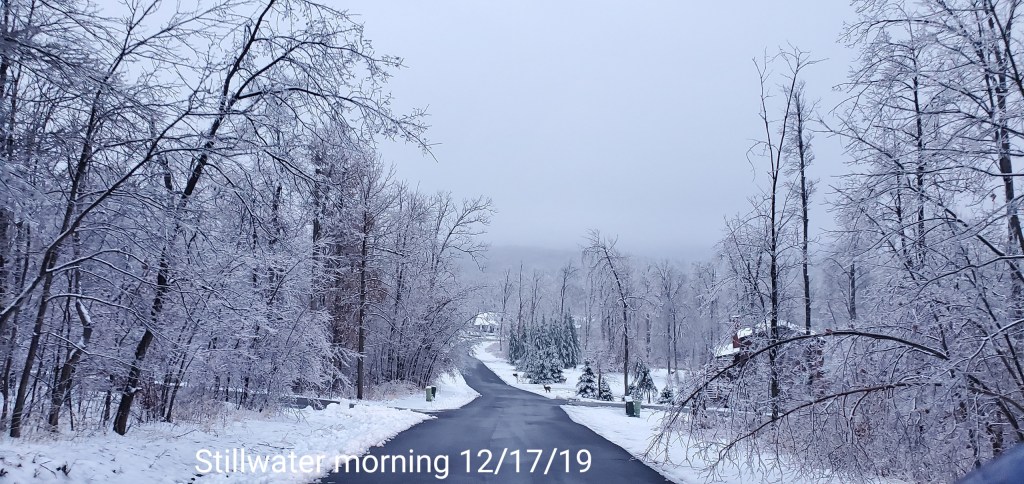
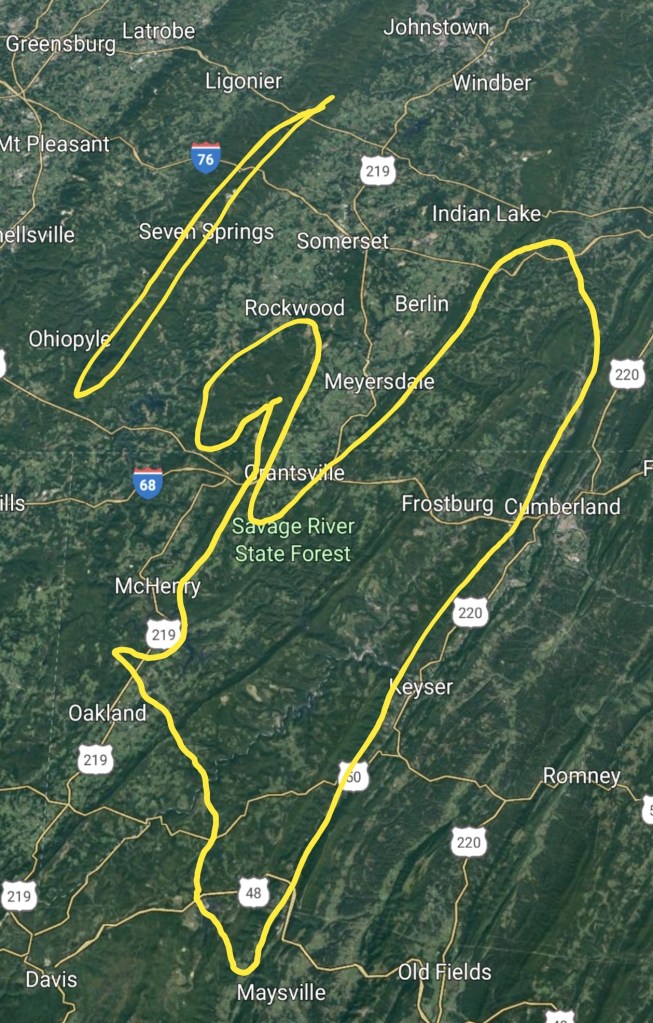
Bittinger area
Early a.m pic
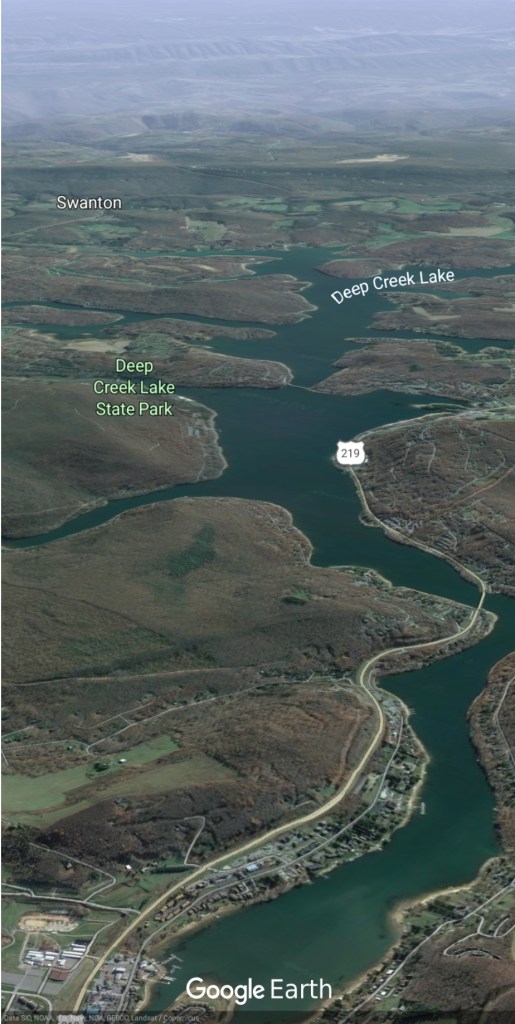
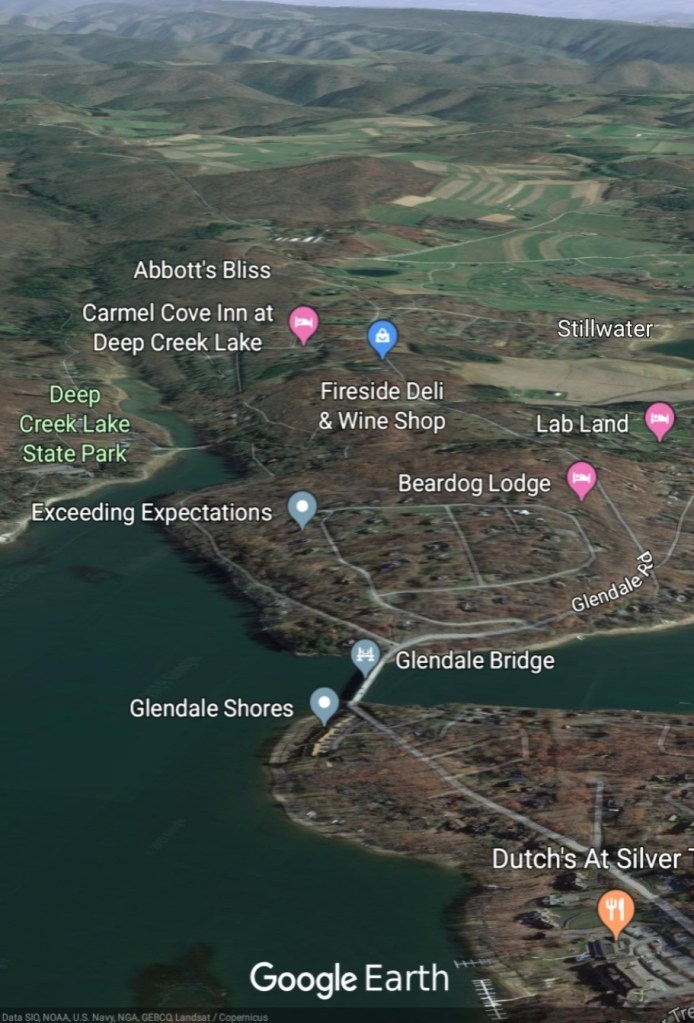
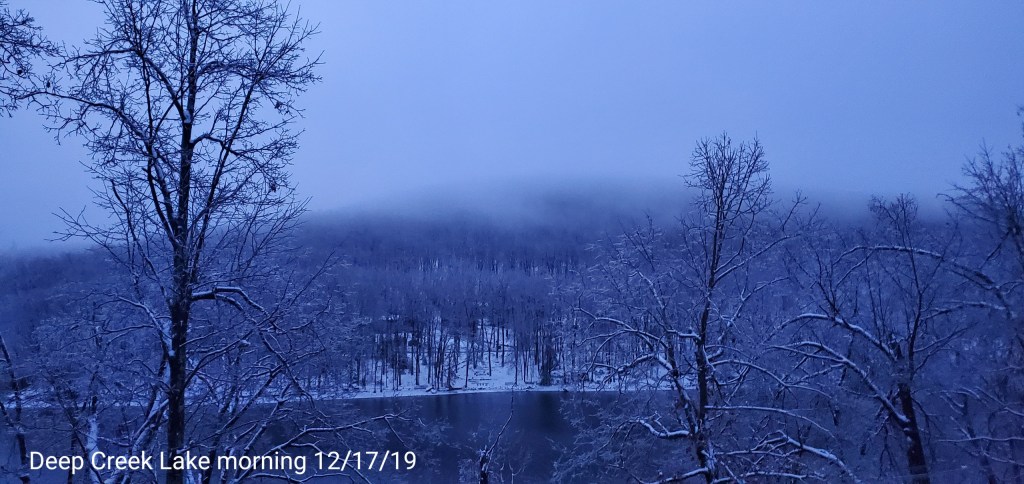
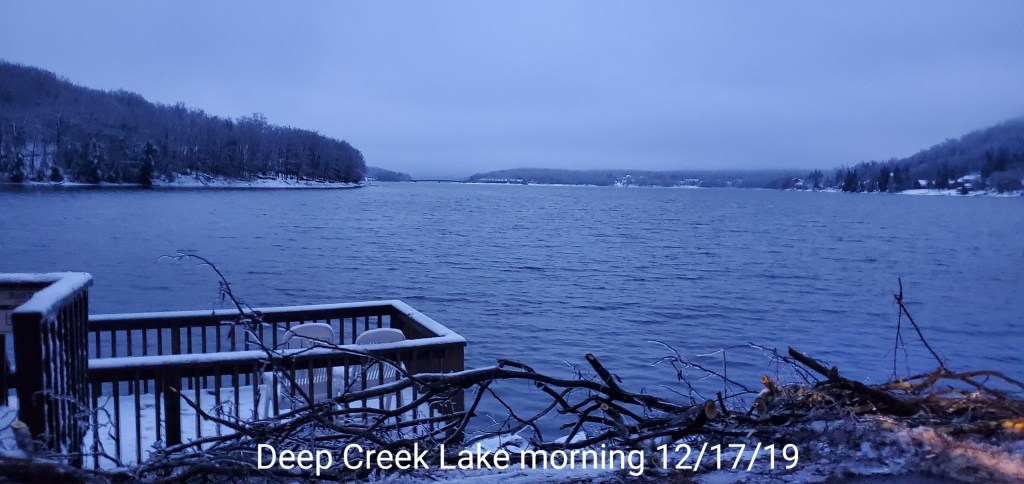
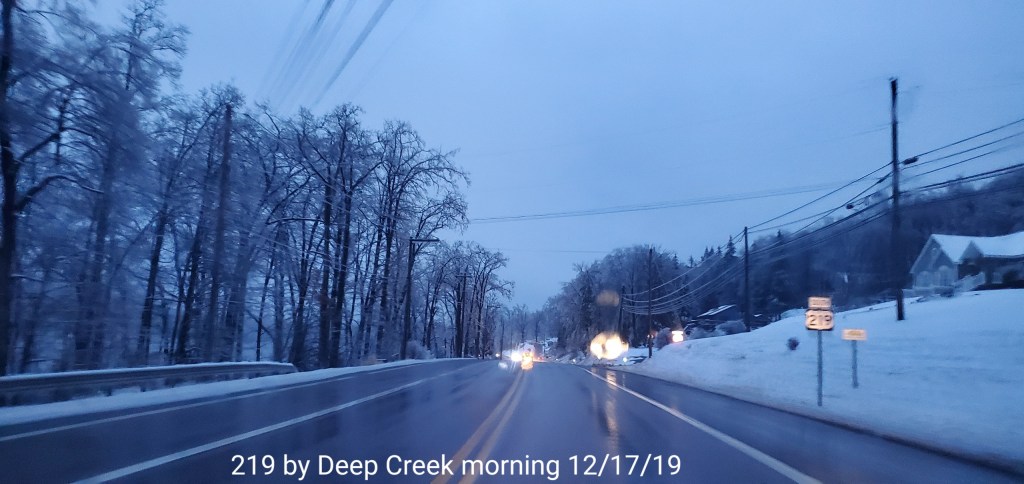
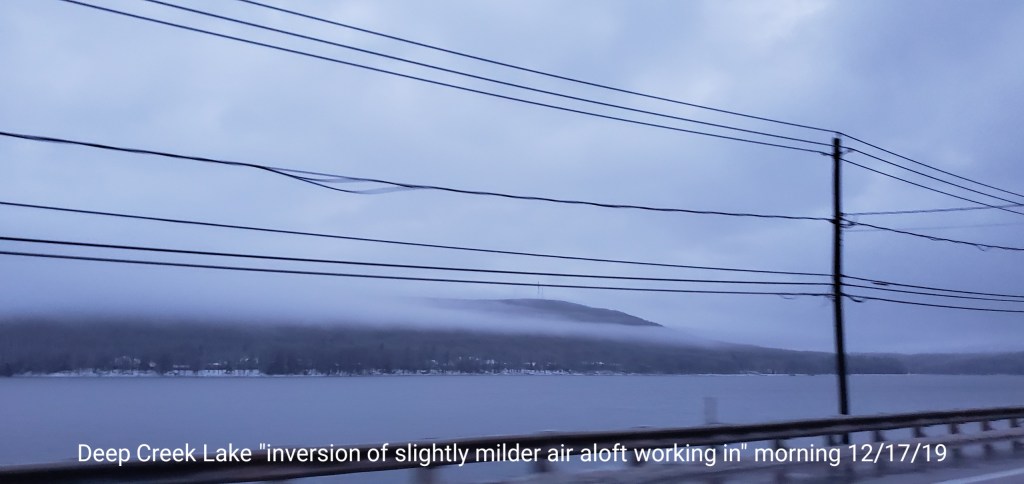
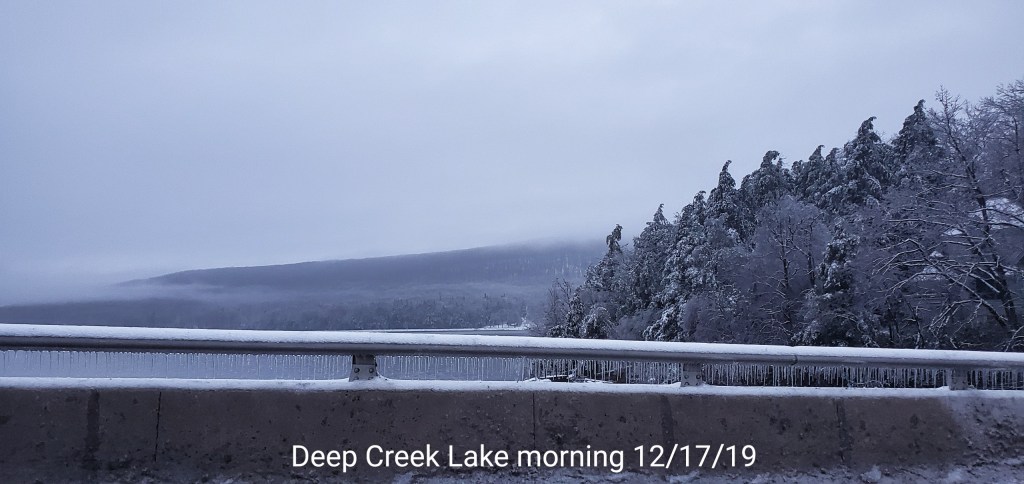
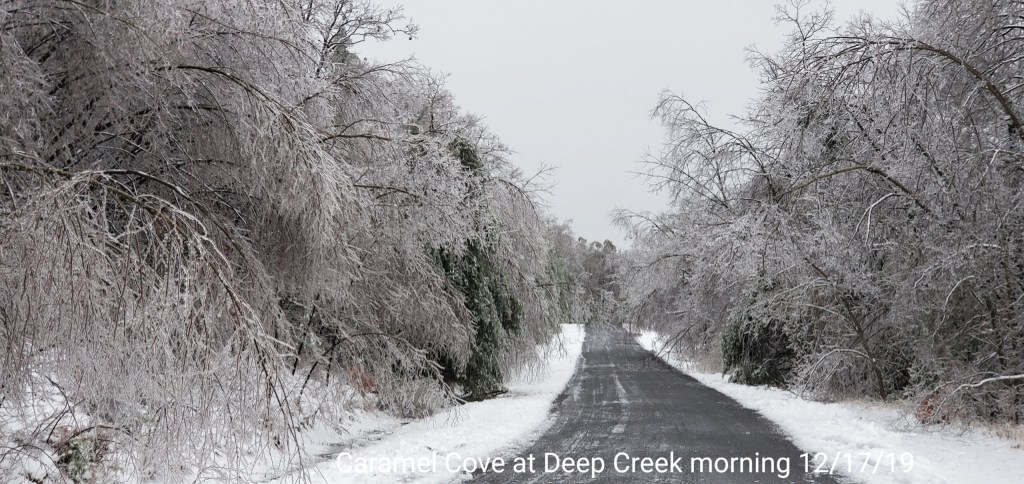
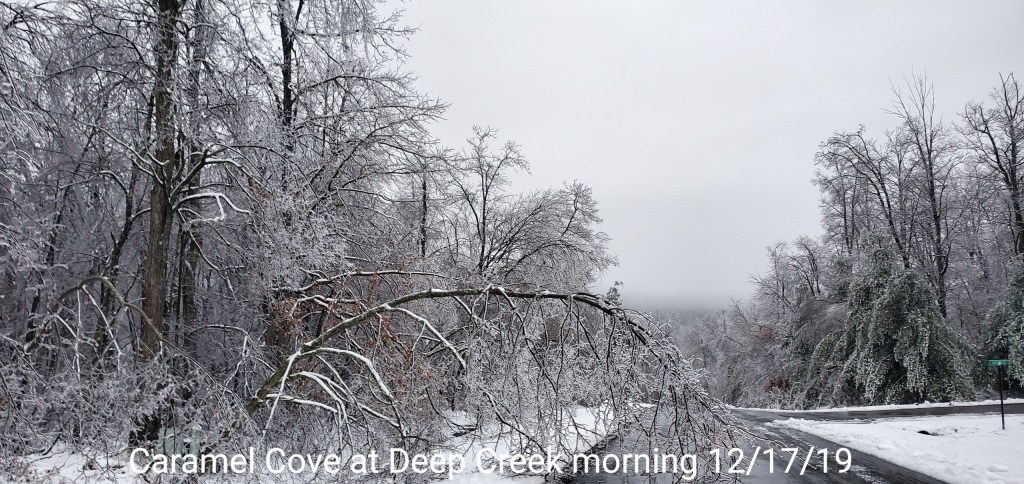
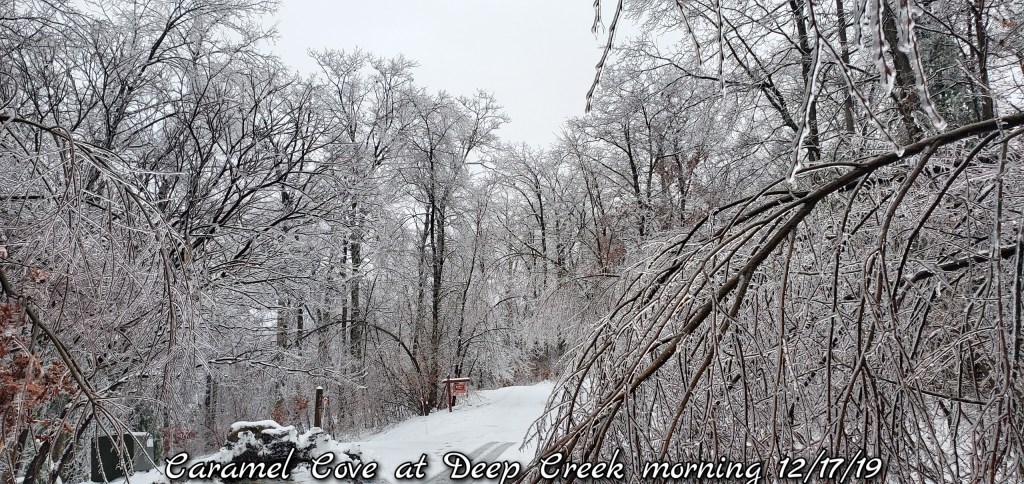
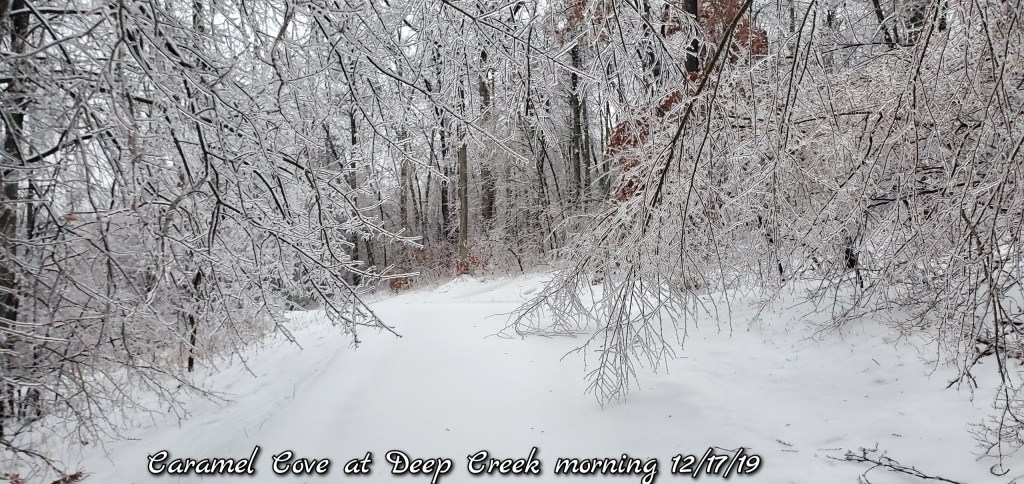
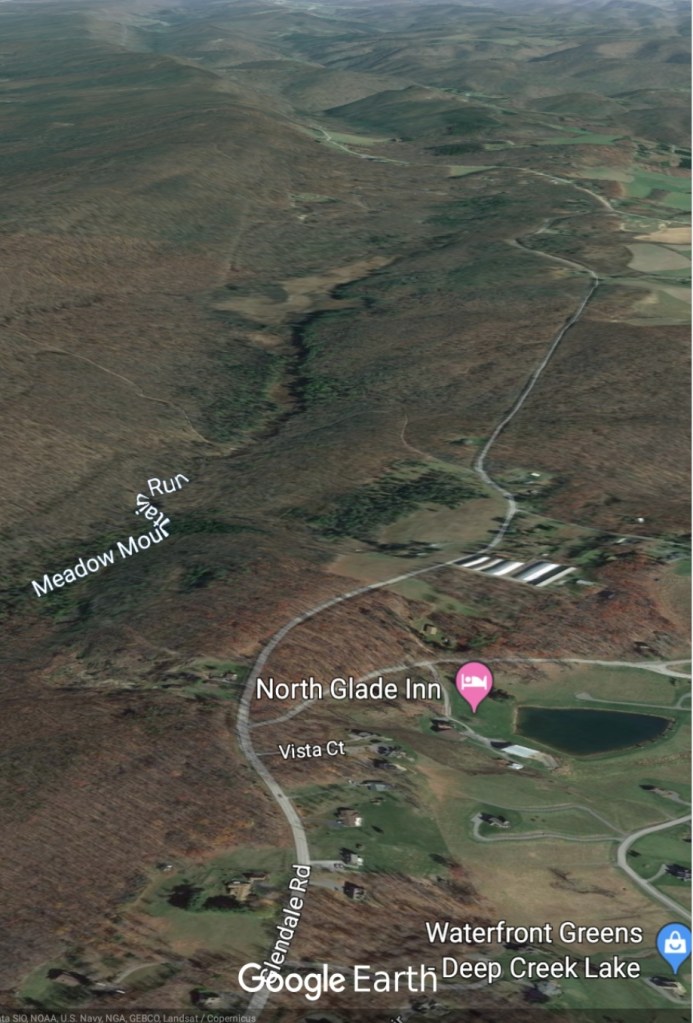
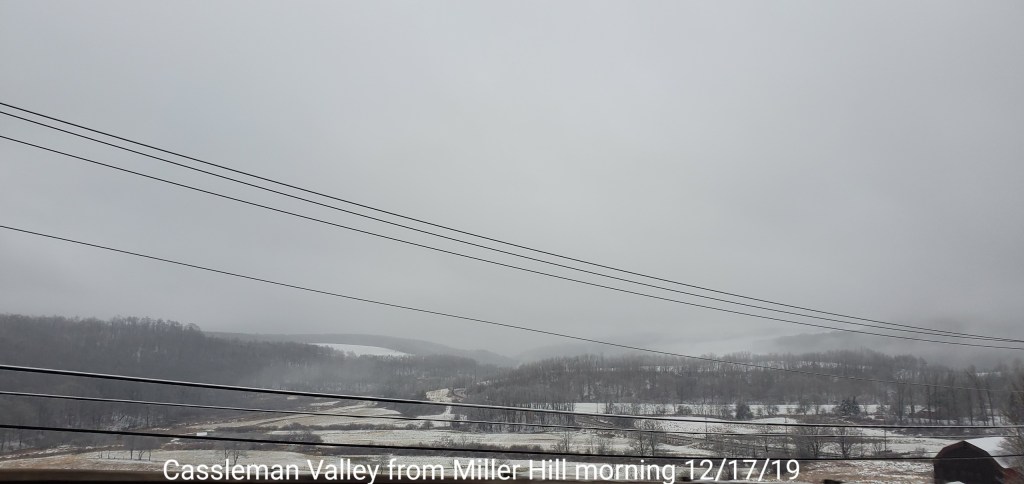
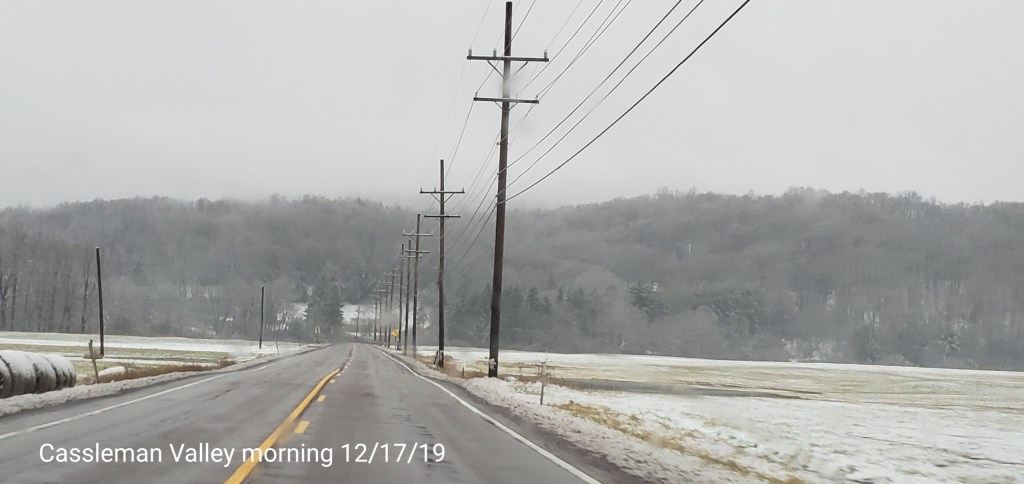
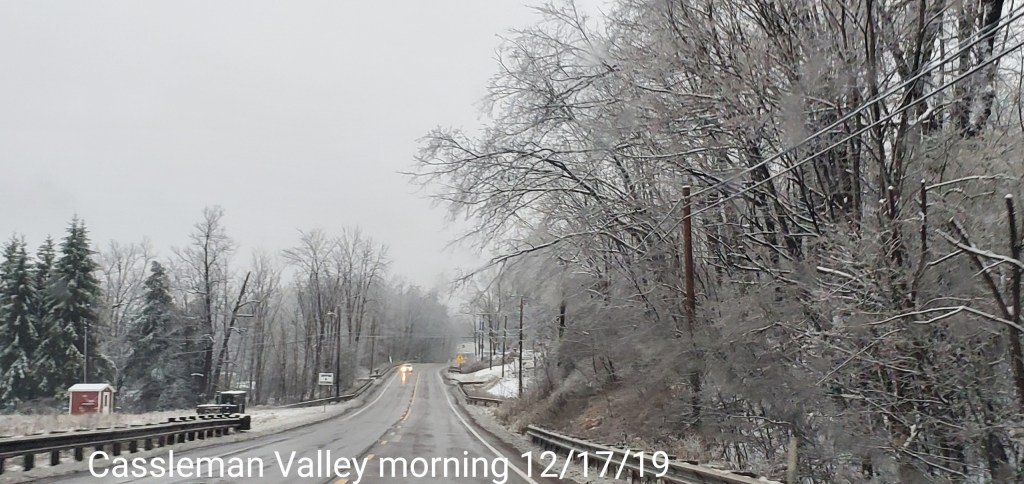
Deep Creek Area
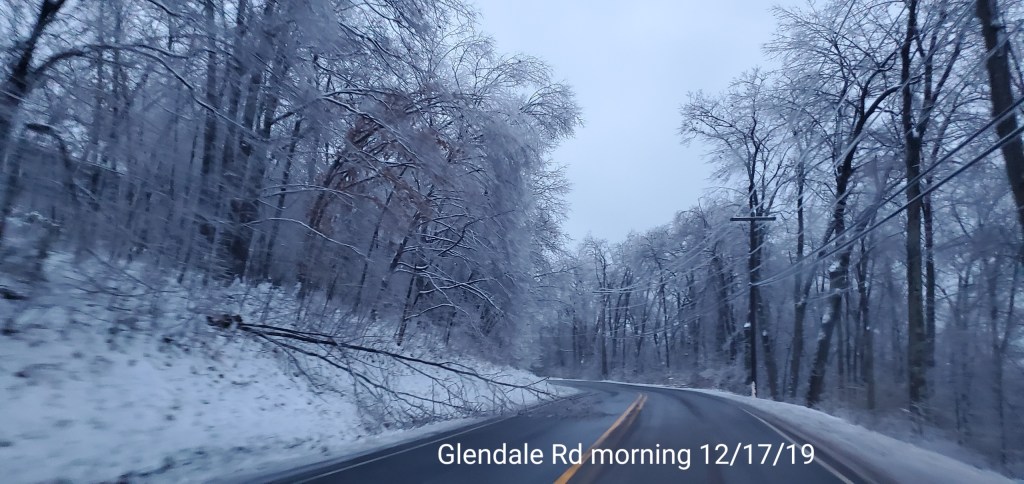
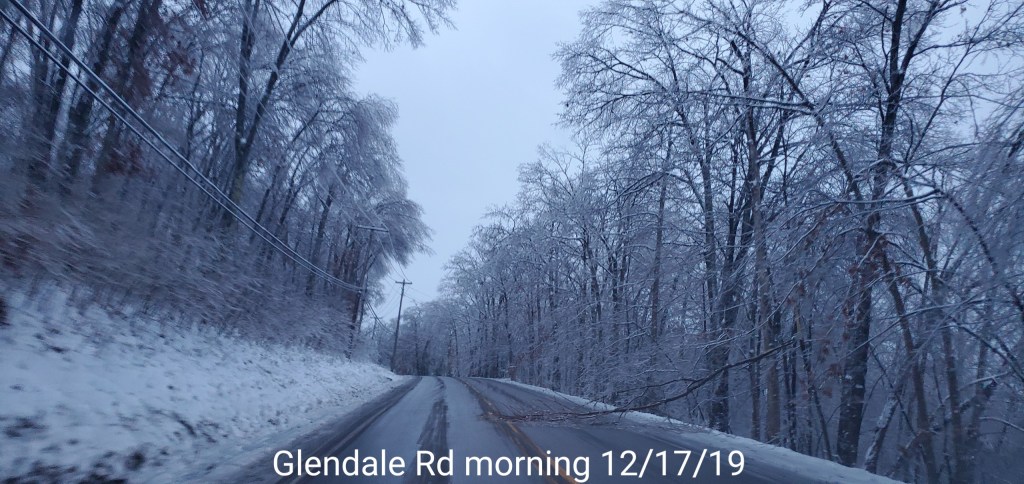
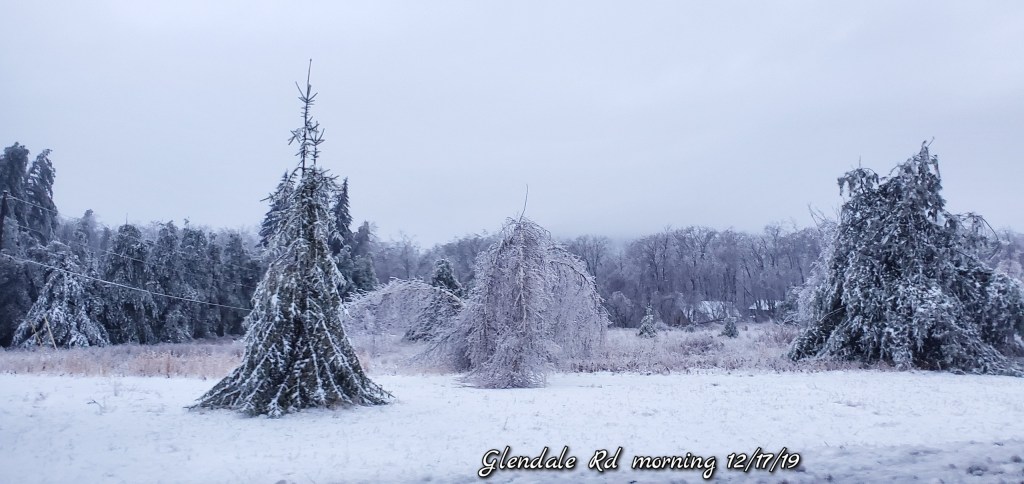
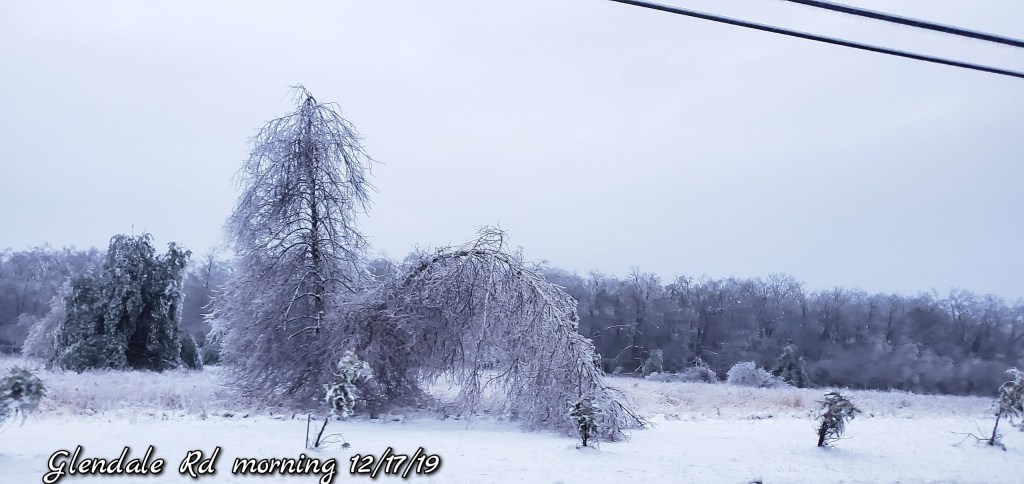
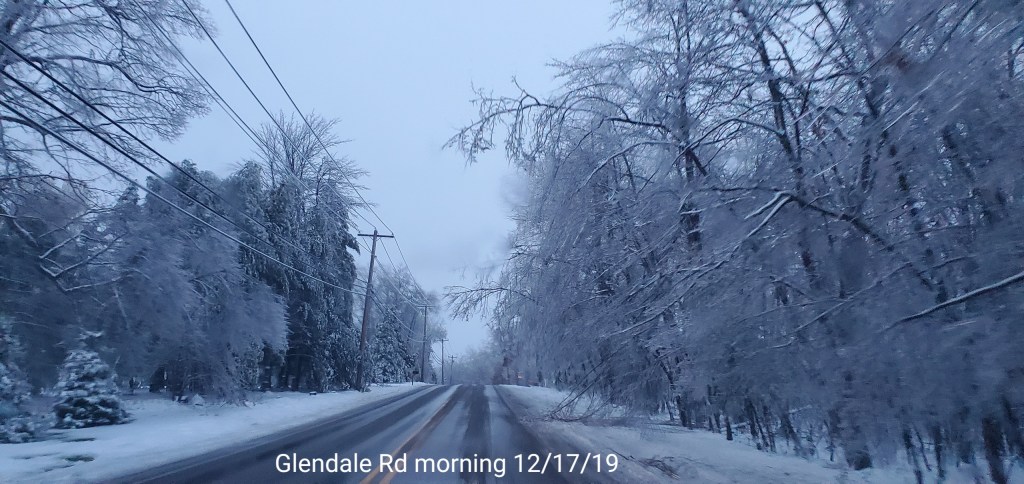
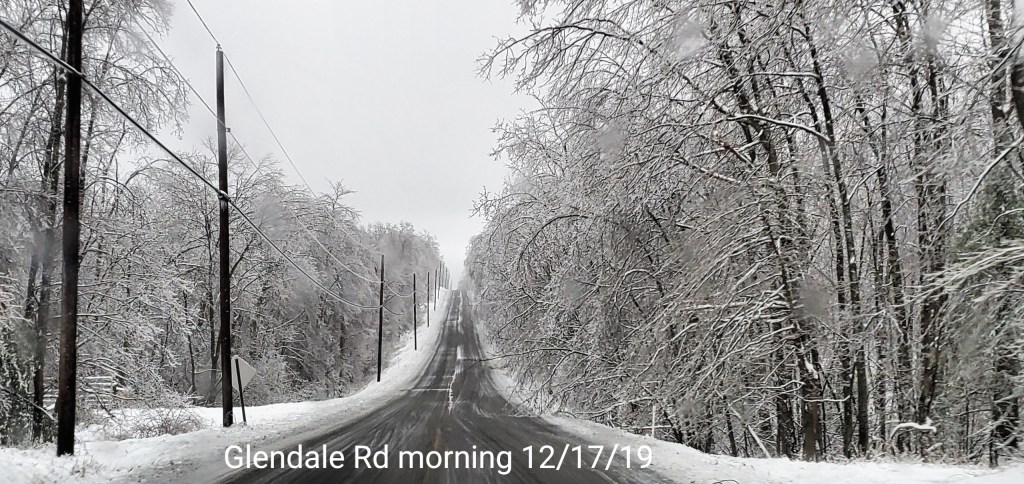
On out Glendale
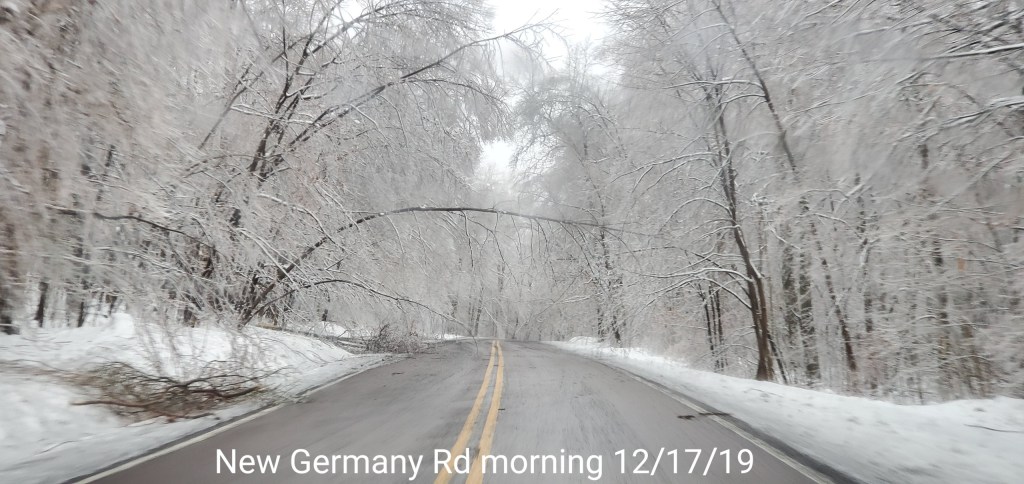
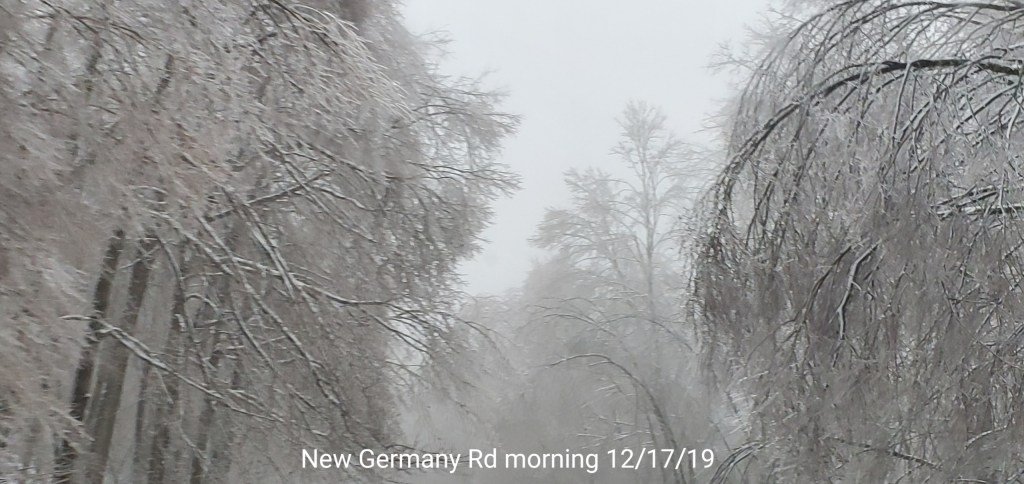
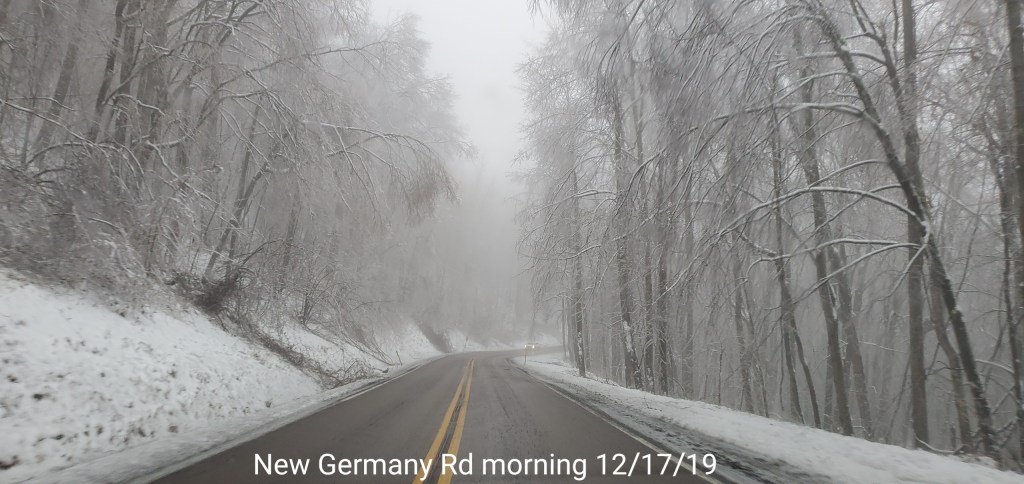
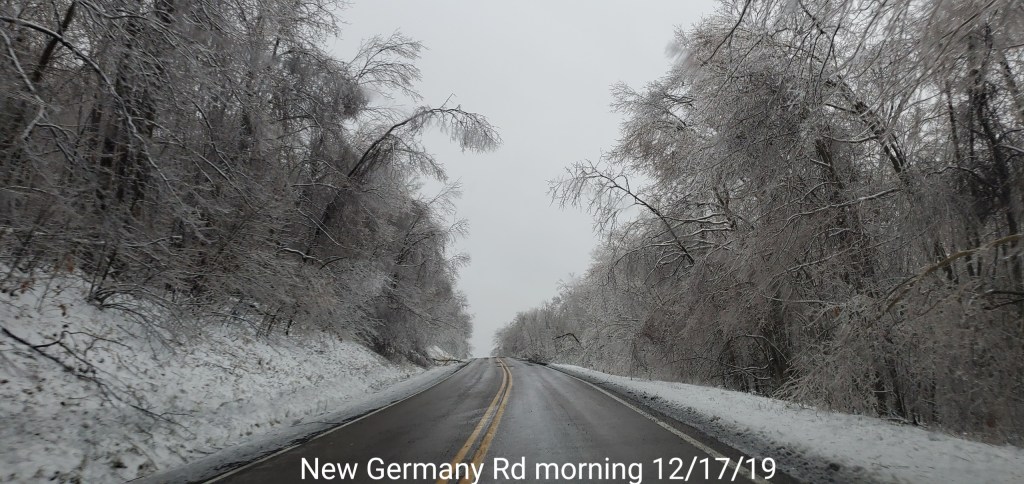
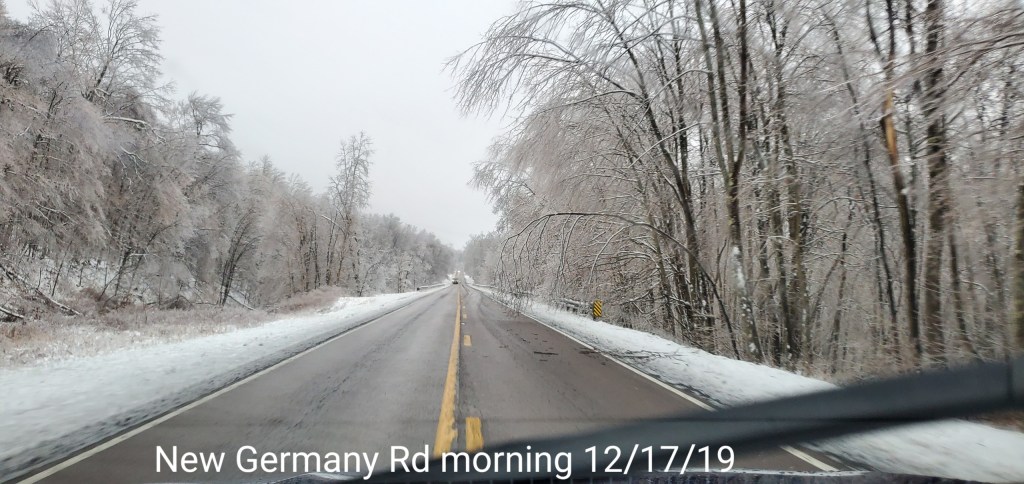
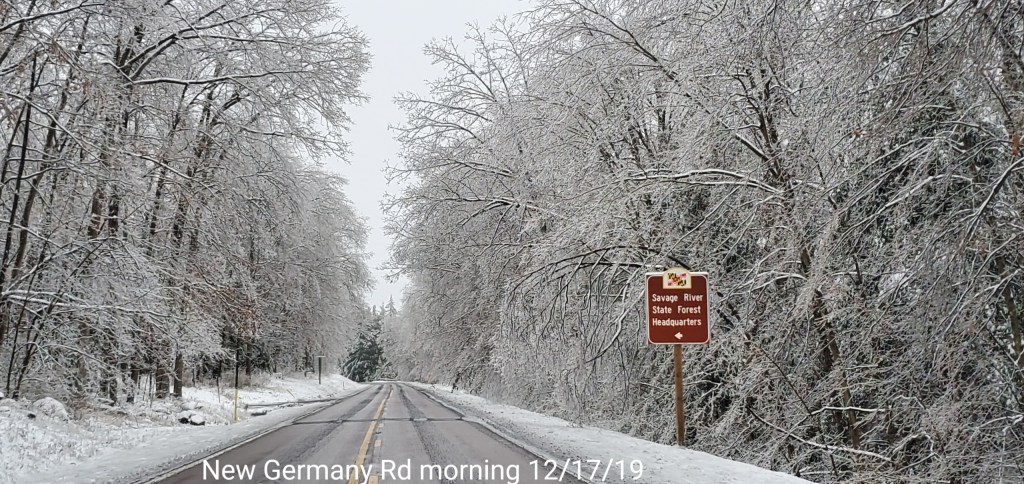
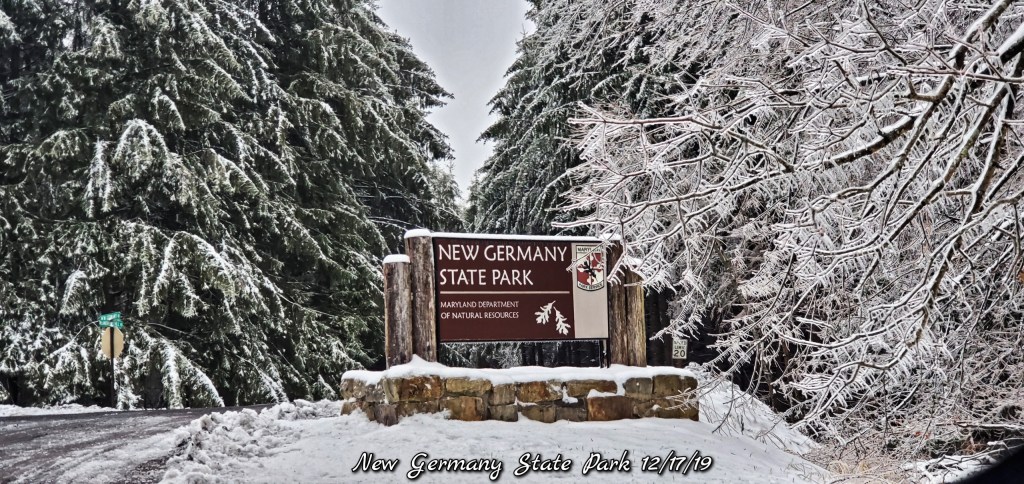
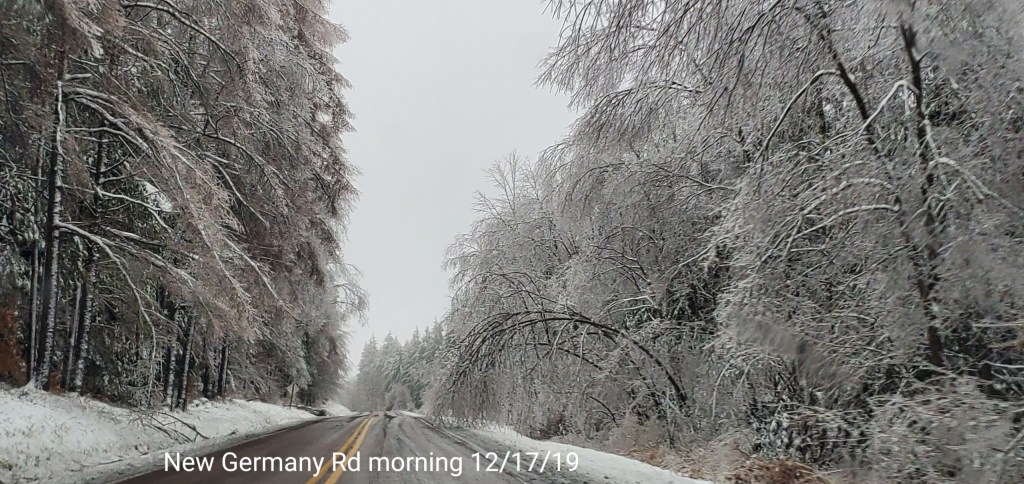
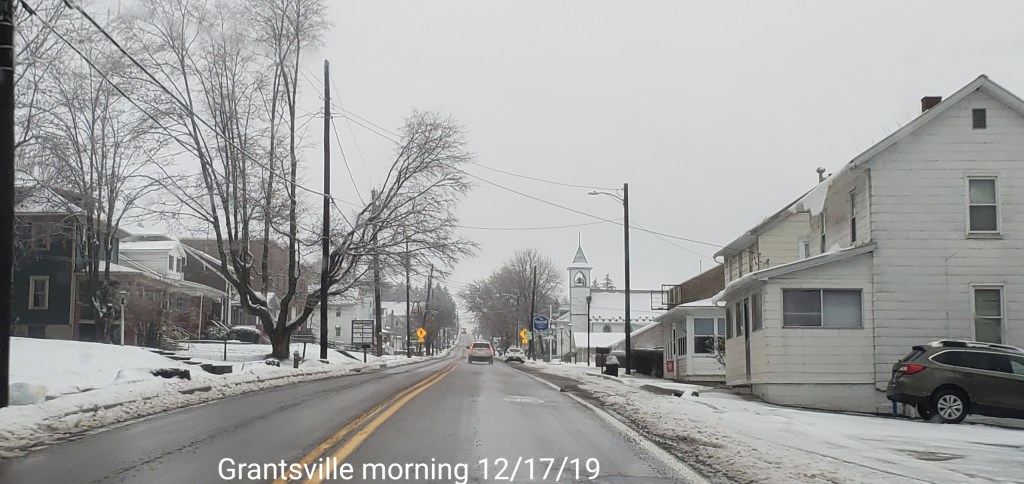
New Germany Rd towards Grantsville
Grantsville area
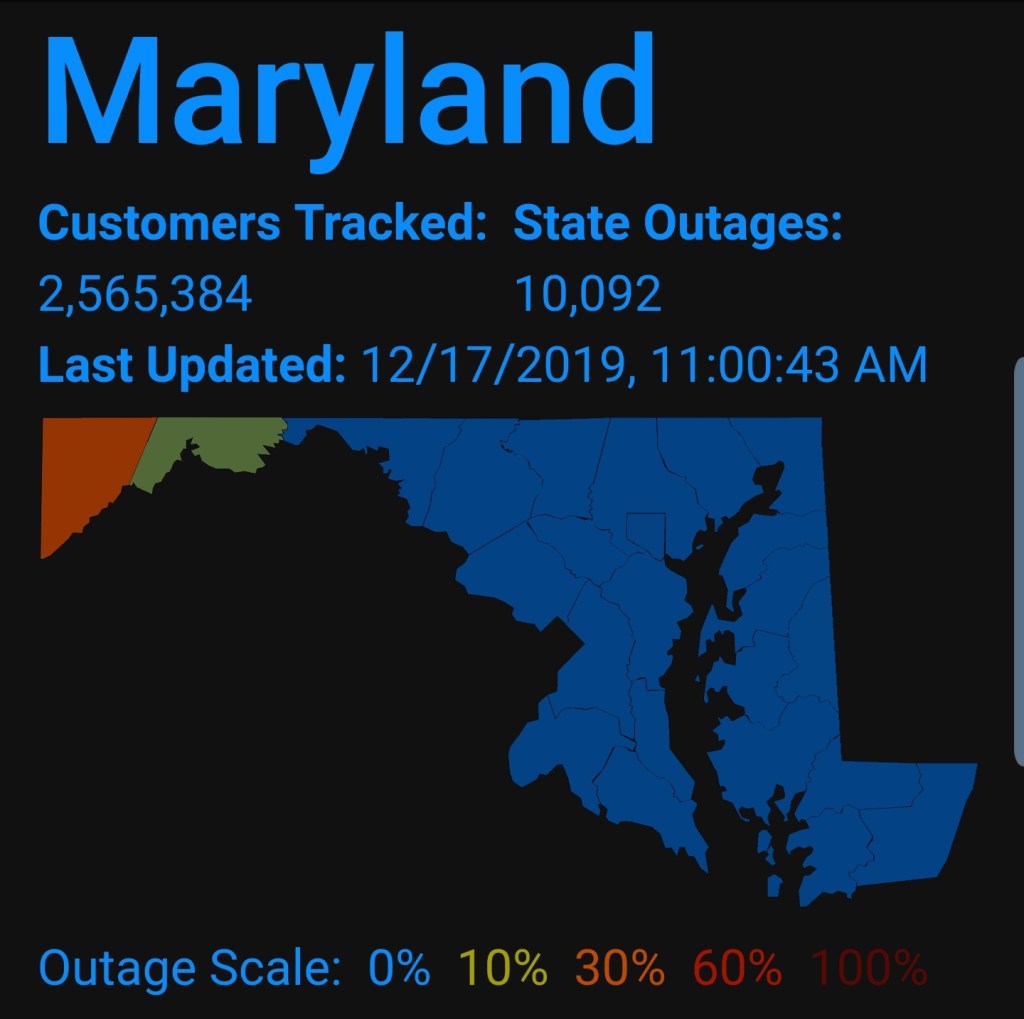
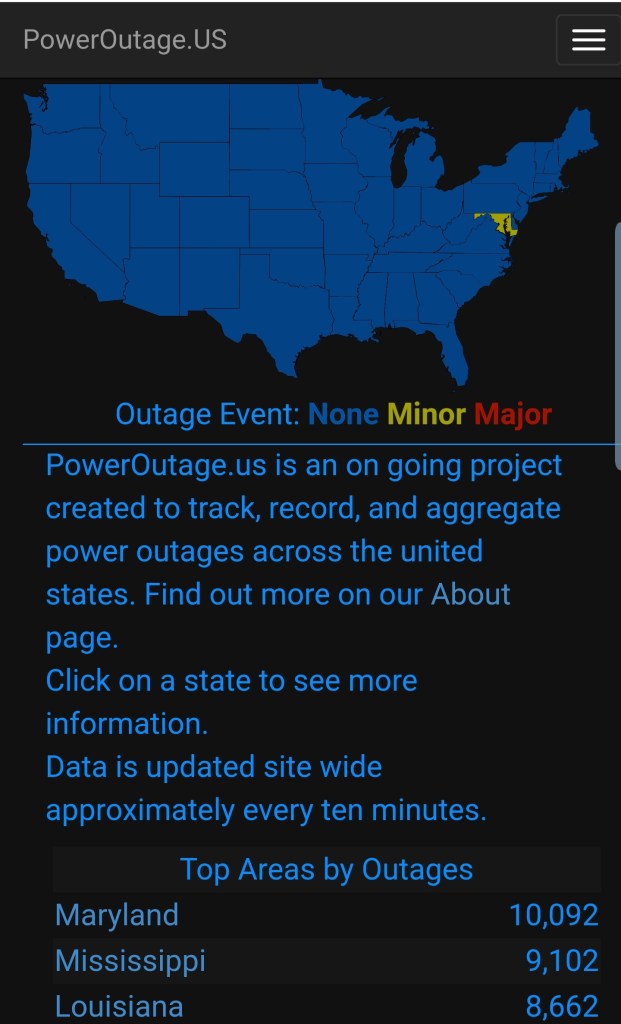
Power Outages
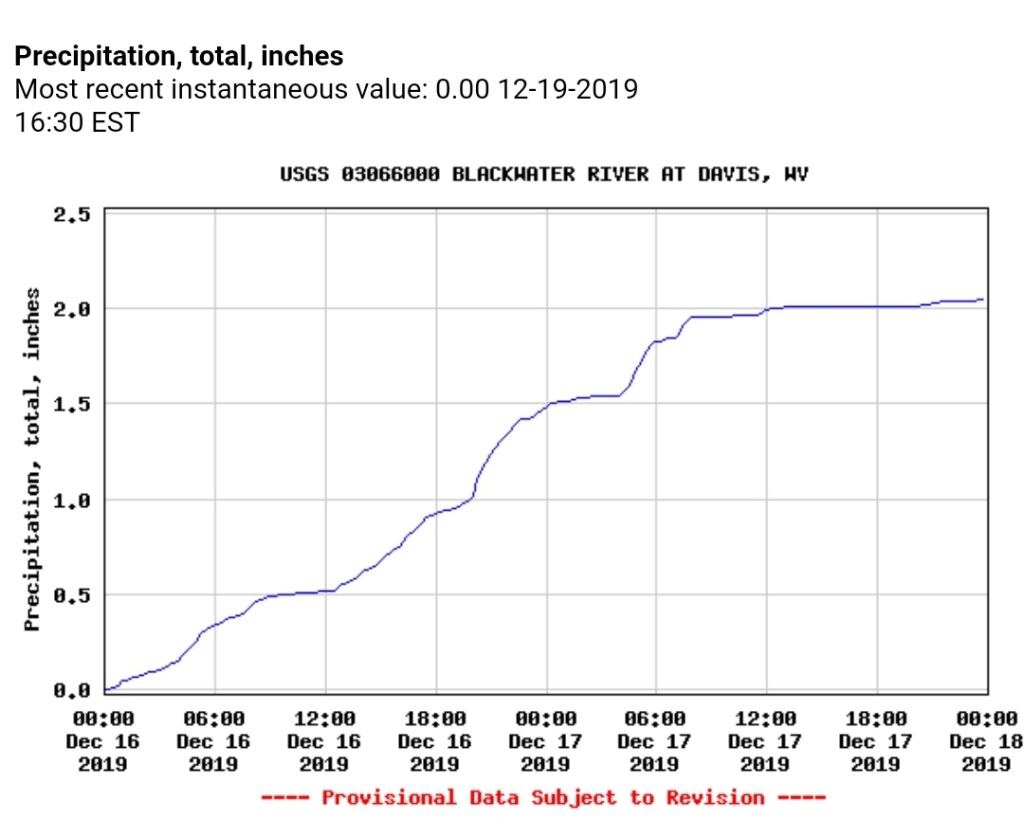
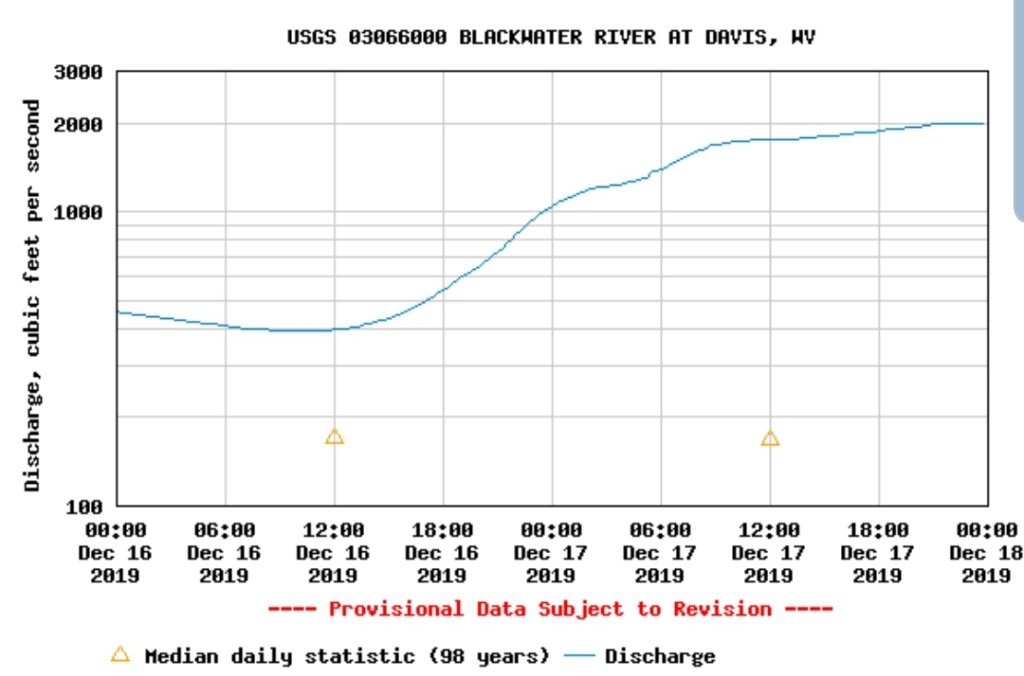
High water side of the event.
1-2″+ of rain sent area water ways well above typical flow. This occurred even in the ice zones as well, however some of that was limited with a lot of ice remaining on the trees. In other areas, such as Blackwater, flow surged to 2000cfs prior to midnight.
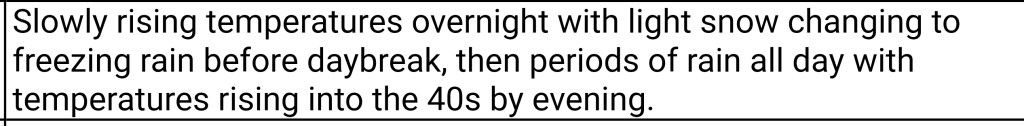
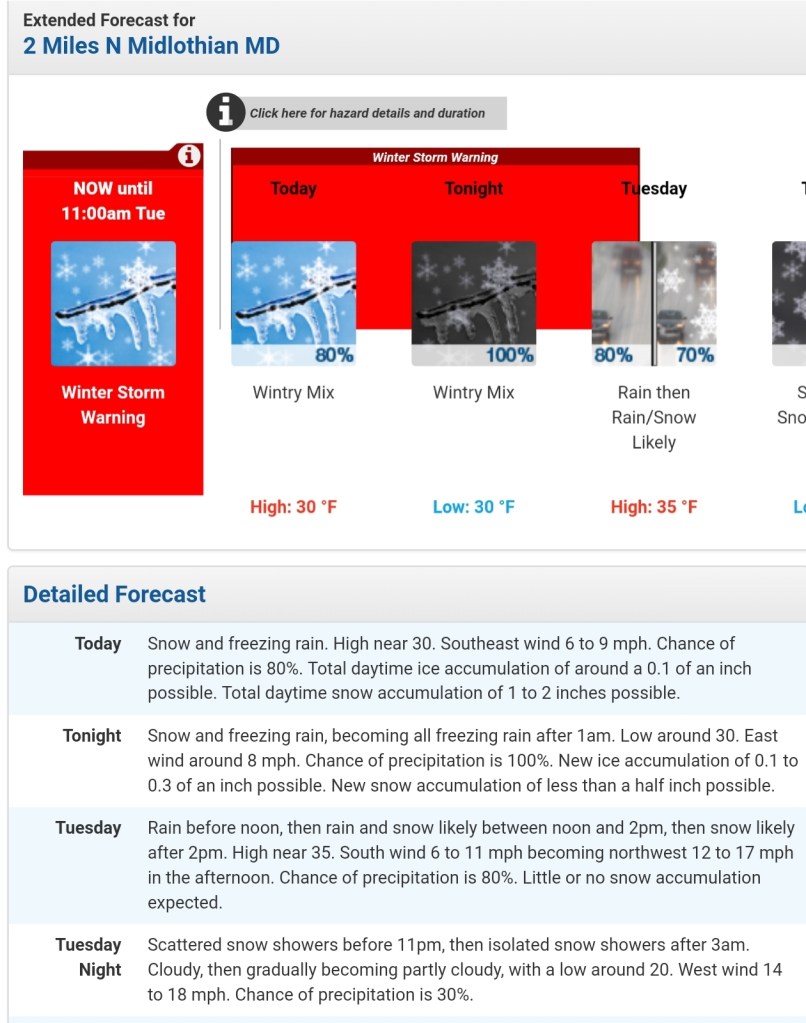
Snow overnight, changing to freezing rain in the morning. Plain rain Wv high ground. Light freezing rain through the day, increasing in coverage and intensity late day and by overnight, the tree load was greatly increasing.
Surface features and 500mb height anomalies and flow
pics to come-
Bittinger area
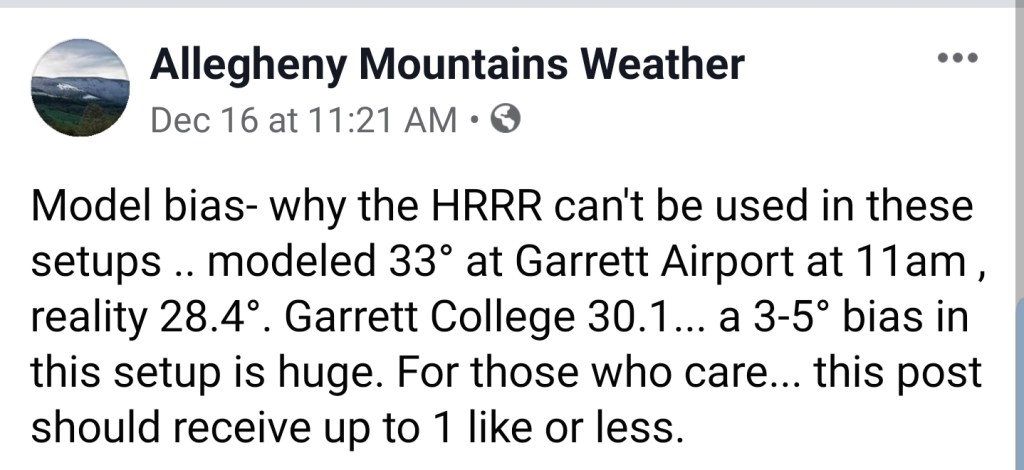
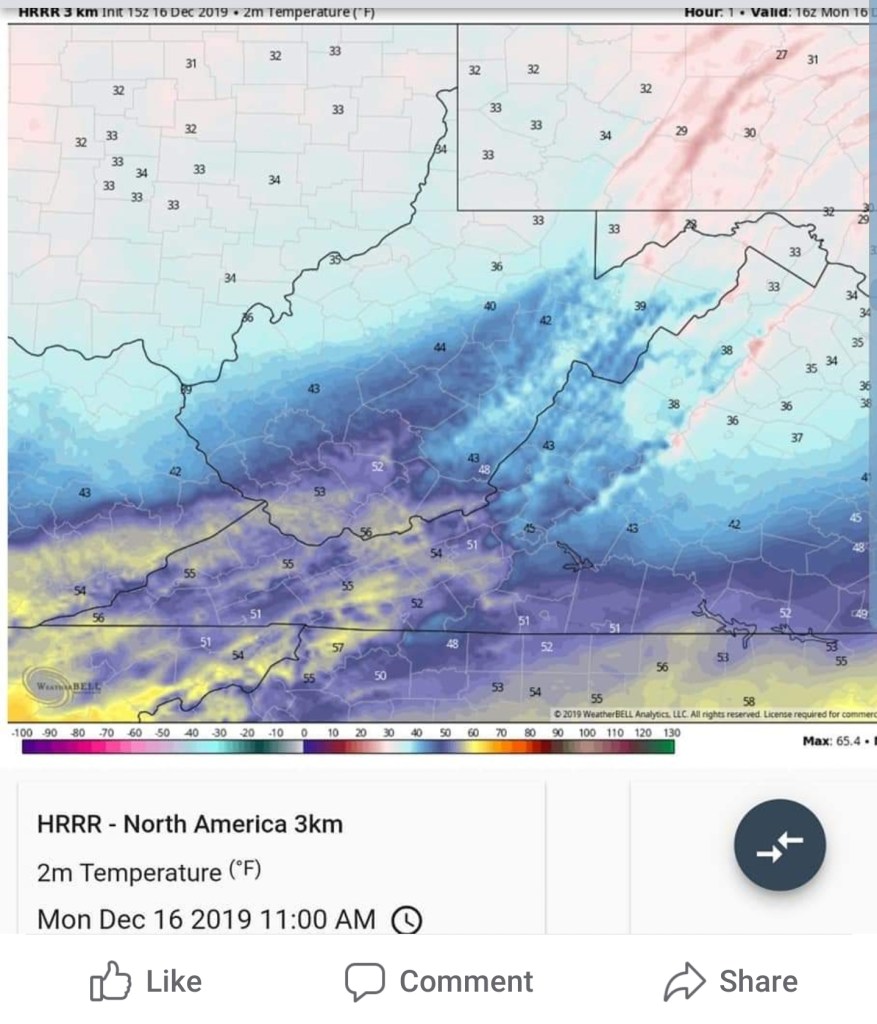
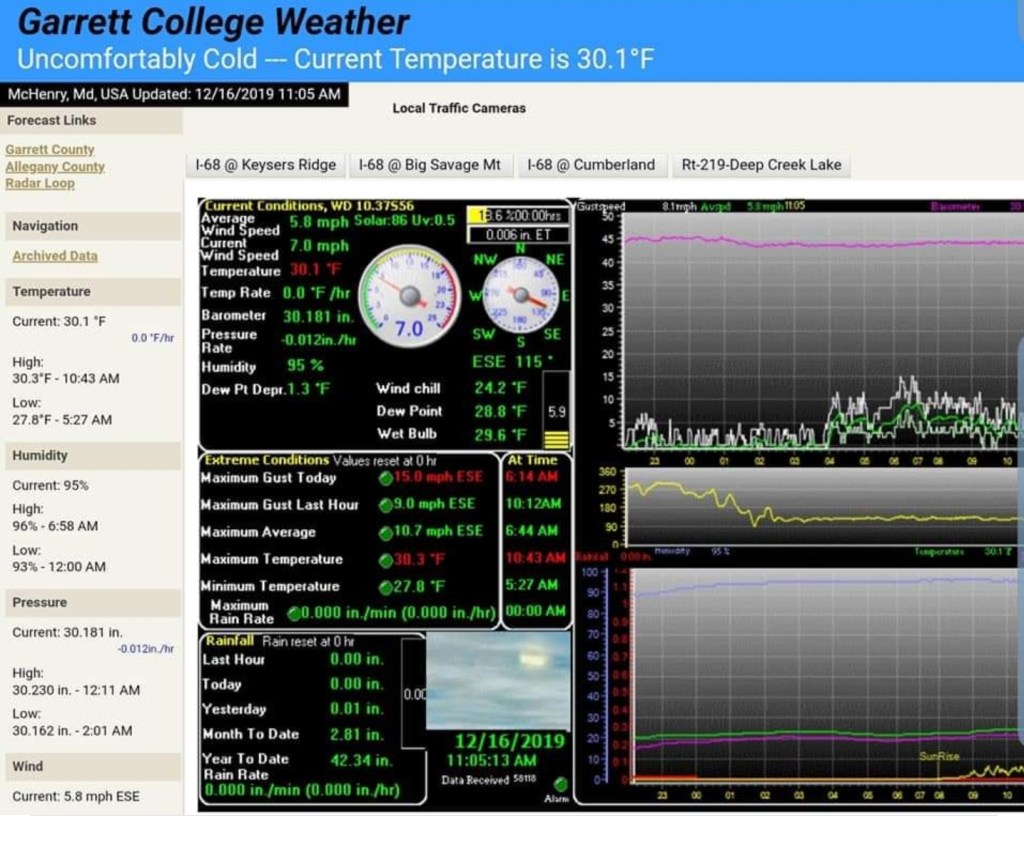
Model evaluation-
This has been pointed out time and time again on just how horrible the HRRR model is. The notorious warm bias exist every time. Sometimes as much as 4-8. The model does not even initialize right. Its flat out terrible. Today it had a 3-5° warm bias to start the run. Sadly the new upgraded GFS look to have that same bias although there is not a lot of examples that with it, however today was one. It went way to warm and the area would have avoided any ice issues had the GFS been correct. In reality, the worst ice storm in years.
Hrrr
Morning update:
7am, the snow aspect across the high ground is and in some cases has wrapped up. Now the lull phase. Overall, precip in what is expected to be the highest impacted ice zones should be fairly light, pockets of steadier precip then backs off through much of the day today, and then increasing later. Freezing rain looks fairly light during the morning and early afternoon hours.
By later today into the overnight, temps along the Allegheny Front, into central Garrett and points east, northeast look to drop 2-3°, from daytime maxes today that may briefly eek above freezing. At this time, precipitation is on the increase. The most significant icing may occur in the hours of 4pm to 4am in these areas. Especially the higher east facing ridges. This could be significant icing in those areas. Ice will occur outside of this zone, this is circled for greatest impact zone.
East facing ridges could see in excess of .5 total ice accretion as we go through tonight.
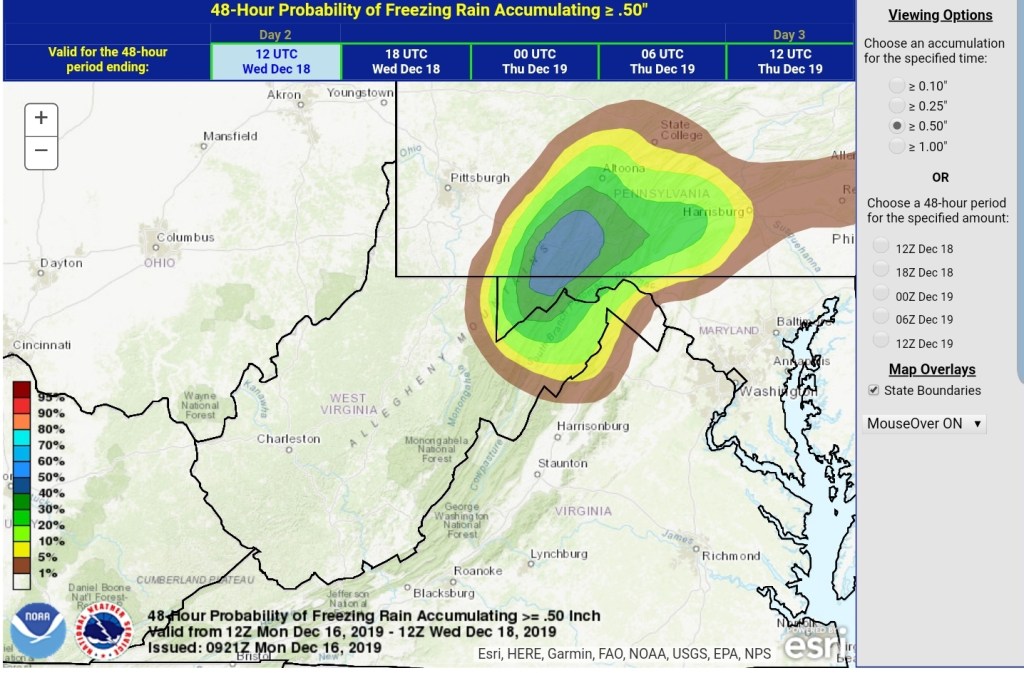
The WPC outlook looks as follow:
The models, the model parameters for freezing rain are consistently overdone. In a marginal temperature setup and moderate rain+, not everything freezes as it falls. Some is able to run off before freezing. Models do not factor that and will overdo ice amounts. With a east wind, those high east facing ridges get aided by the wind in freezing more of the rain. That said, model rundown
My favorite in the setup the
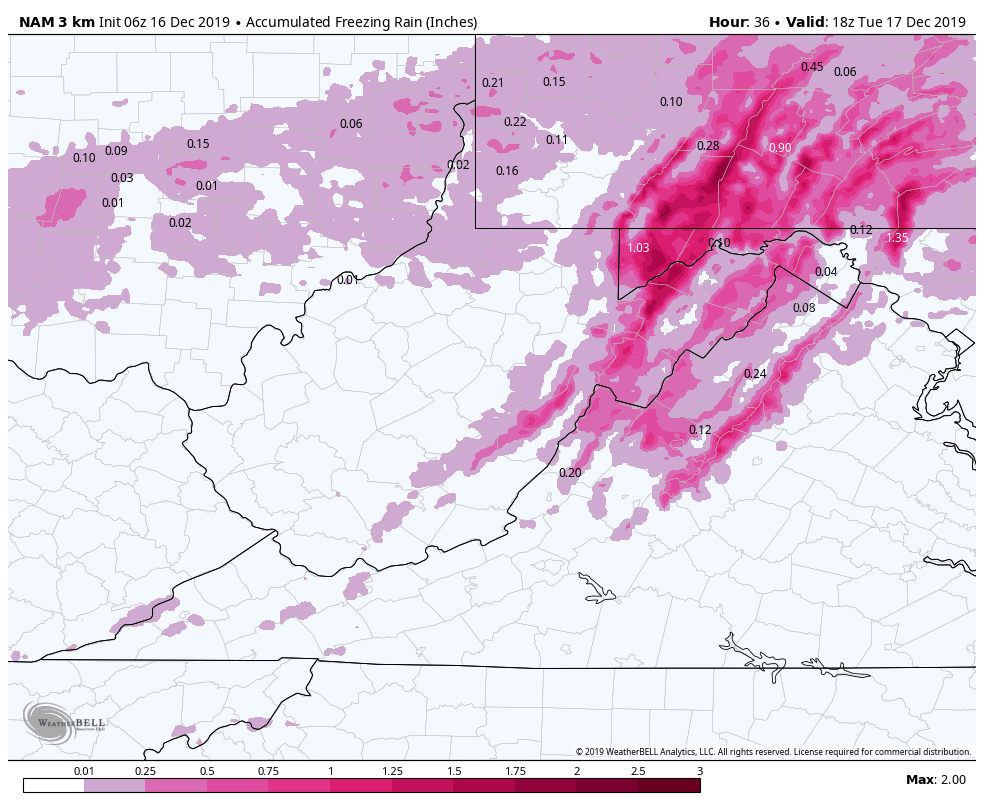
6z 3km Nam
2m temps
6z ICON
2m temps
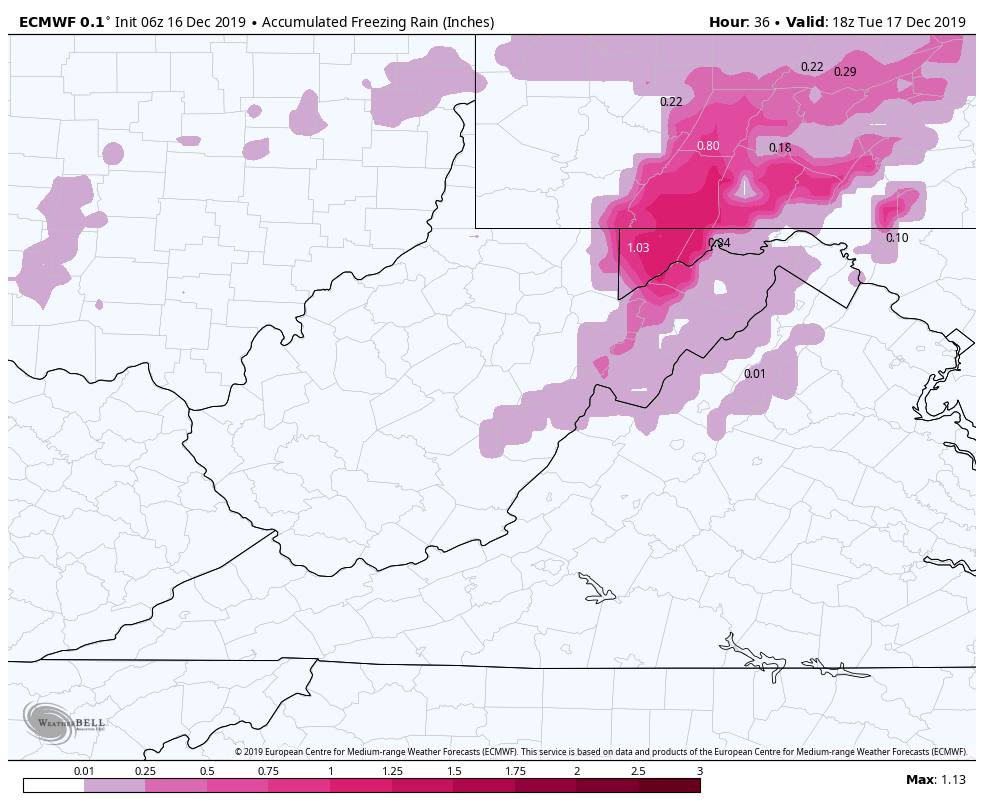
6z ECMWF
6z HRDPS
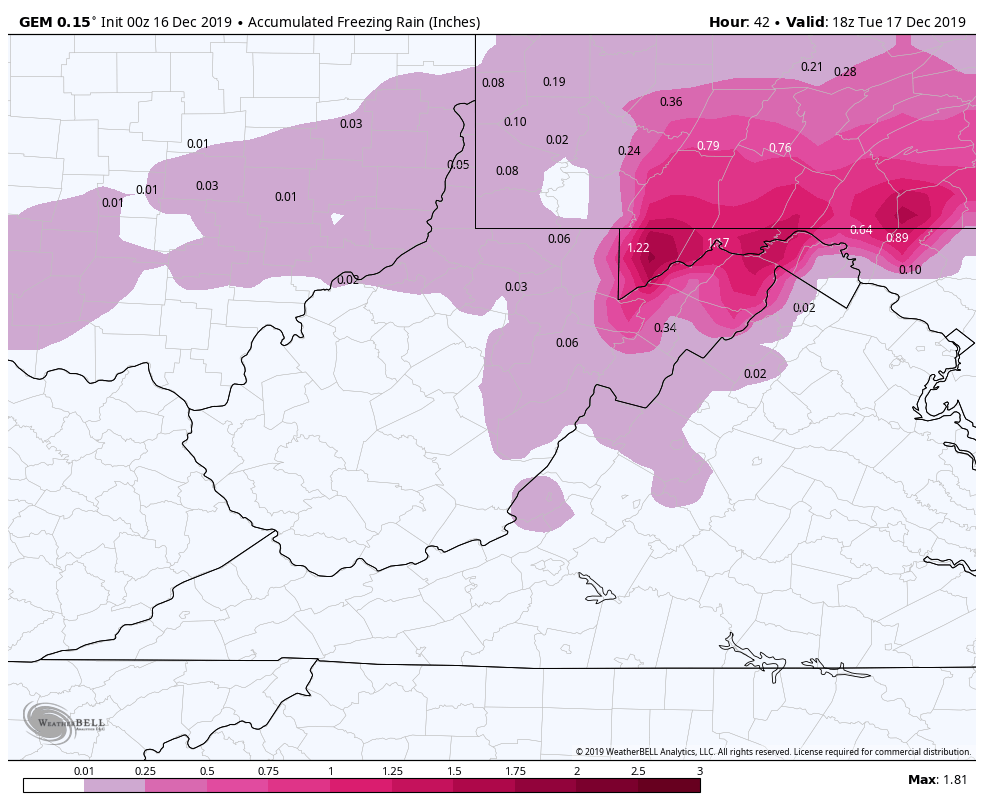
6z HDPS Canadian
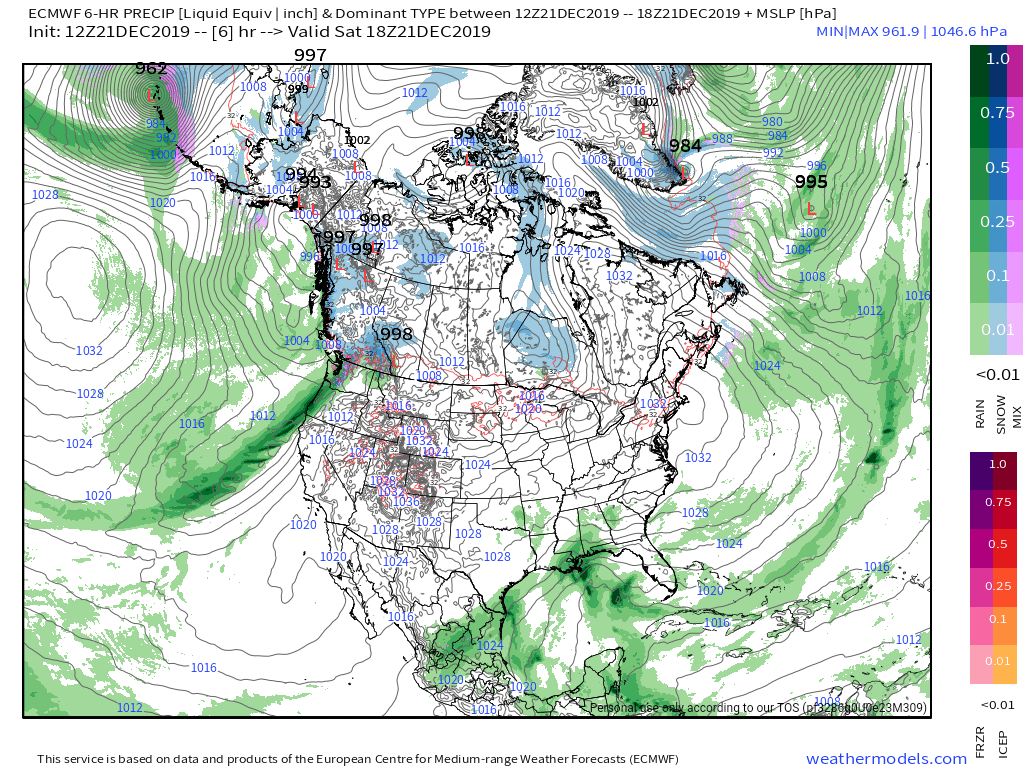
6z ECMWF
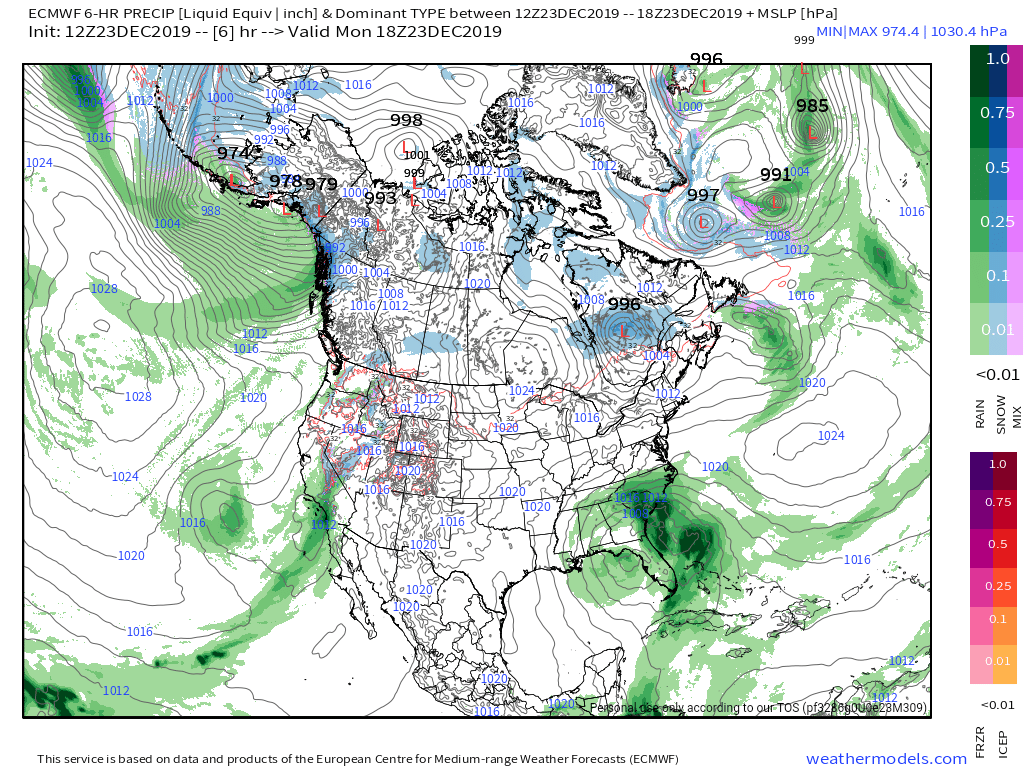
MSLP/6HR/PRECIP
Will get to the GFS in a bit..
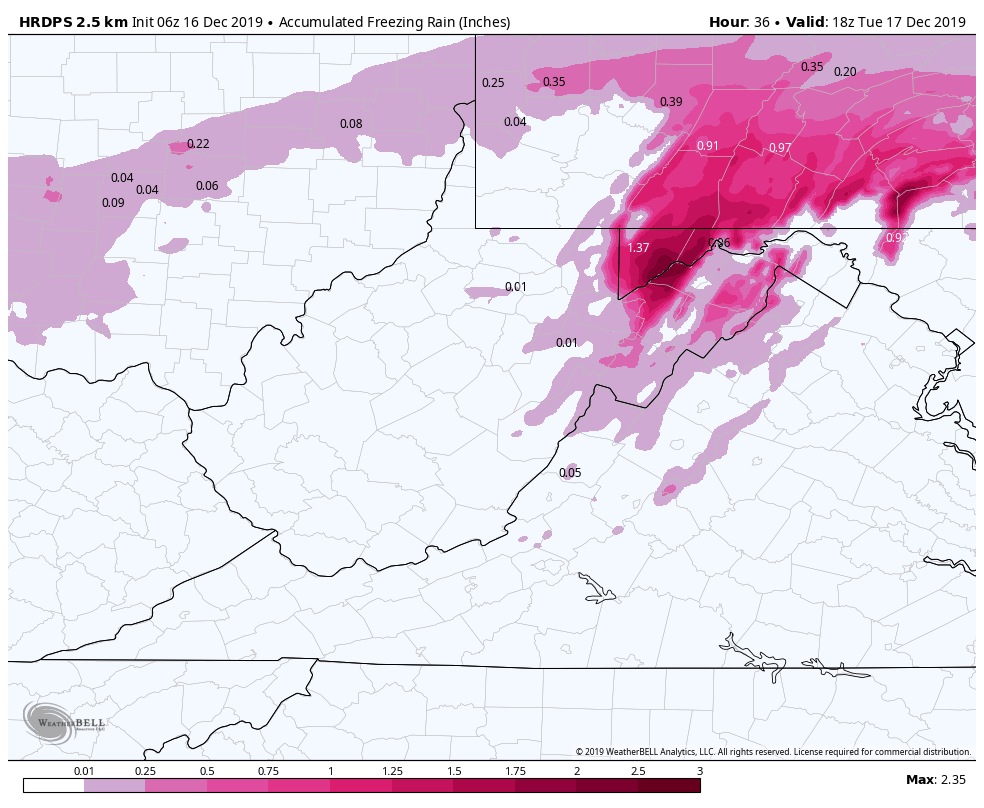
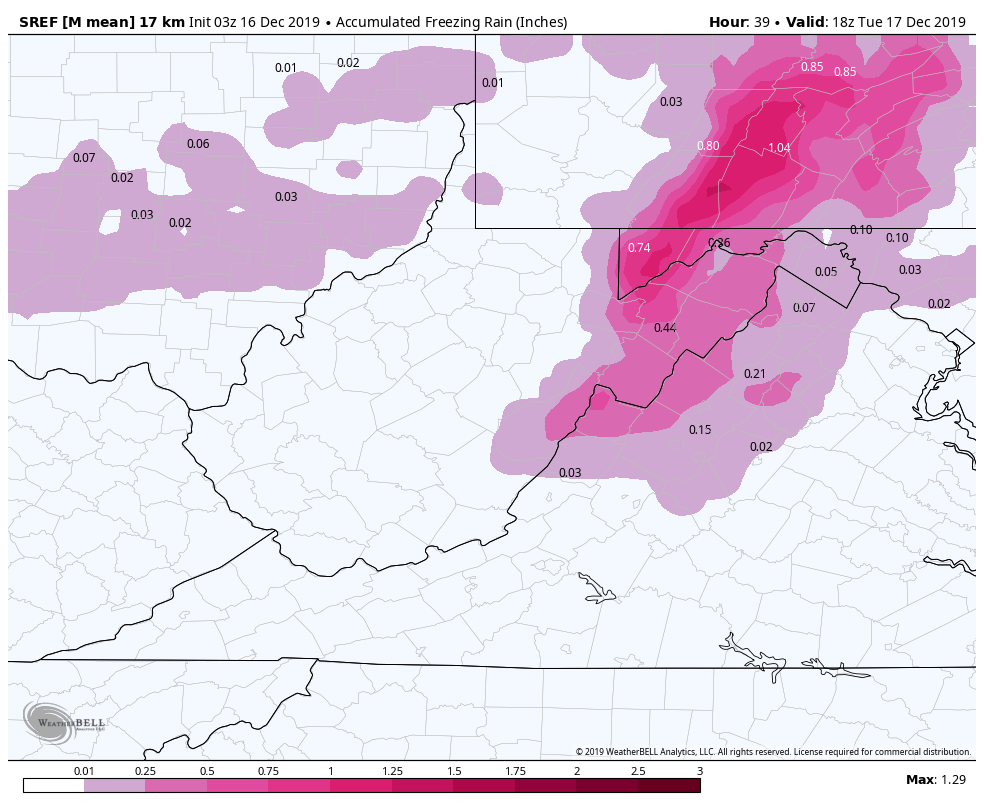
Ice amounts off the models. Again, these are overdone but still suggest significant icing. Also more expansive than reality will have it. Model product listed within the image.
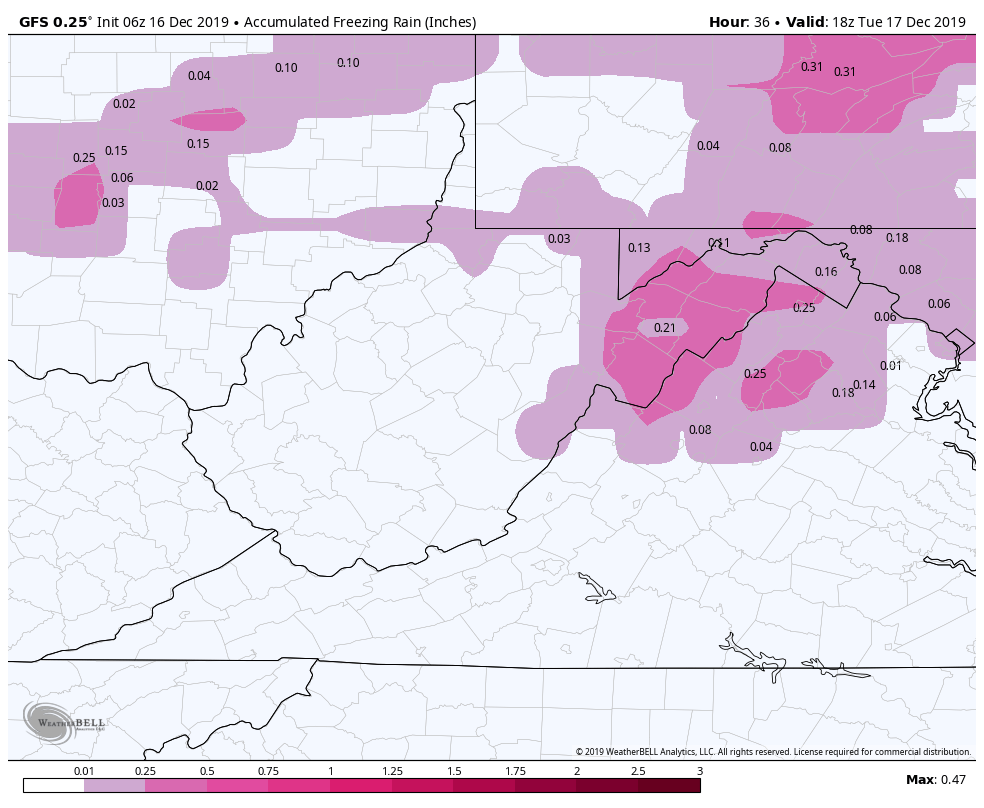
Ok, those are some bonkers amounts that are overdone. Now we jump to the GFS. The 6z in this case but it doesn’t matter. Every GFS run has been warmer, and brings very little ice. This is the upgraded GFS, and its either scoring big points here beating every model or its falling to the same fate as the HRRR and has a notoriously warm bias with these setups. I am mainly posting all of these to look back and see the model bias after the fact. Models are tools, with biases.
6Z GFS
2m Temps
Ice off the GFS…what ice? Minor event
Some NWS point and clicks in the ice zone. Much better on timing now.