Cloudy start and a wide variety of temps……..valley areas of ice yet this morning, elsewhere in the 40s….turned into a mild day across the board, showers, few thunderstorms, and turning cold before midnight with frozen precip returning
Temp profile this afternoon
Radar with estimates 10pm-10pm
Satellite
Flow
Surface features and 500mb height anomalies and flow
Cloudy, east wind..Early precip mainly virga. After nightfall precip did break out and was in the freezing rain form north causing bad roads. North central and eastern Garrett.
Temp profile this afternoon
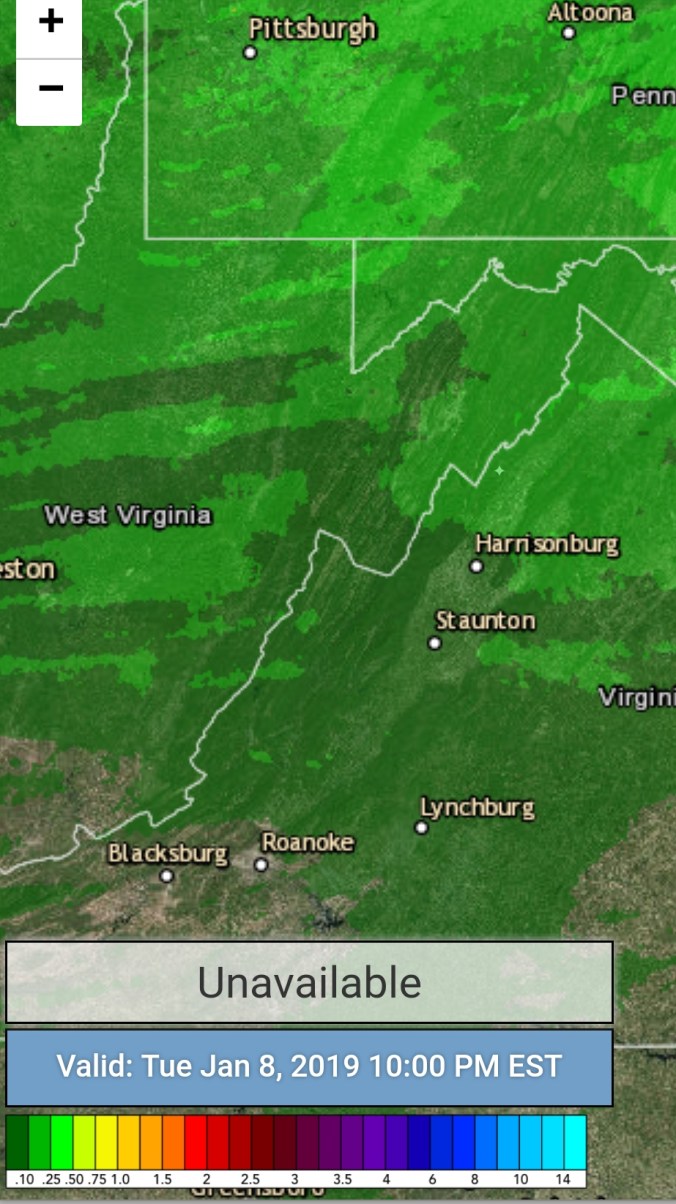
Radar with estimates 9pm-9pm (Radar estimates poor today, showing virga as accu)
Satellite
Flow
Surface features and 500mb height anomalies and flow
Cloudy early, high ground fog,,some Wv Rime at the high spots, clouds breaking and plenty o sun in the afternoon
Temp profile this afternoon
Radar void of the low level moisture early
Satellite
Flow-
Surface features and 500mb height anomalies and flow
Few pics on the day
On the models….
Cold overnight, mts and east much colder tomorrow vs west of the mts…precip late may be a brief period of freezing rain. Temps rise predawn hours of Tuesday, hold through Tuesday a.m, then fall later Tuesday with upslope overnight and Wednesday…looking like a 2-4/3-6 type deal in the upslope areas
Overcast, dimmed sun at times. Some high ground fog south and light precip.
Temp profile this afternoon.
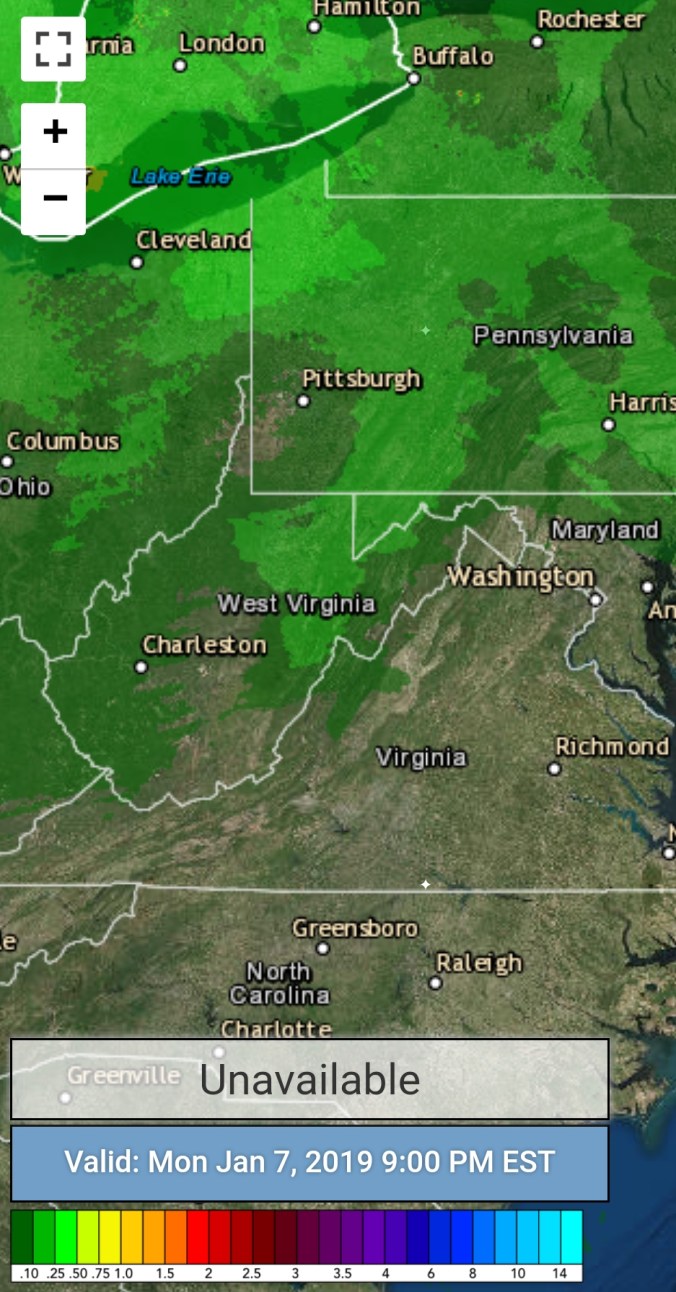
Radar with estimates 9pm-9pm
Satellite
Flow
Surface features and 500mb height anomalies and flow
On the models….
Short term,,rain pressing in tonight…that rain may end as wet snow across the Wv high ground with some wet accumulation. Especially above 3700-4000′ The higher tomorrow the higher the likelihood of snow and some sticking
Cloudy brisk day…A few tiny random flakes late morning. Skies did brighten and break a little late day. Some high ground rime in Wv. Had my first below freezing temp today as temps trended down through the morning.
Temp profile this afternoon
Nothing to show radar wise
Satellite
Flow
Surface features and 500mb height anomalies and flow
Few pics by David Carroll today from Spruce Knob and Bald Knob at Canaan as he did station maintenance and a install.
Beginning today, the new northern Canaan Valley site will be listed to compare with the original frost pocket site at Timberline Rd
On the models…
Short term, some rain pressing in tomorrow and on Saturday that rain should end as wet snow across the mts. Flakes to 2500-3200′, slushy coatings to 1″ 3200-4000′, 4000′ + 1-2″.. The key will be how fast it zips through.
Longer term, this dreadful zonal flow, southeast ridge combo, trough in the SW continues awhile longer and while dominant the next 2 weeks, it may begin to break down somewhat. Now models have shown this awhile to only back down and reverse course So, keep an eye on SE ridge, the EPO, MJO, and the effects of the strat warm. Tonight’s weeklies breaks it down as follows
The winter lovers blues….
Living in the mid Atlantic, these dismal periods are frequent, this current one is exceptionally so. But, does that mean all is lost? No hope for a good winter? Oh. if we have to wait another 12-15 days, it may as well not snow feeling? I get it, but, some of the most memorable, bad winters and ones that set the standard bar were not all as great as some remember .
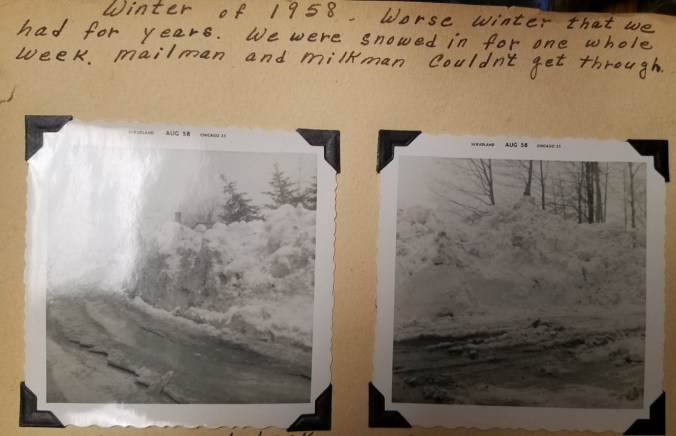
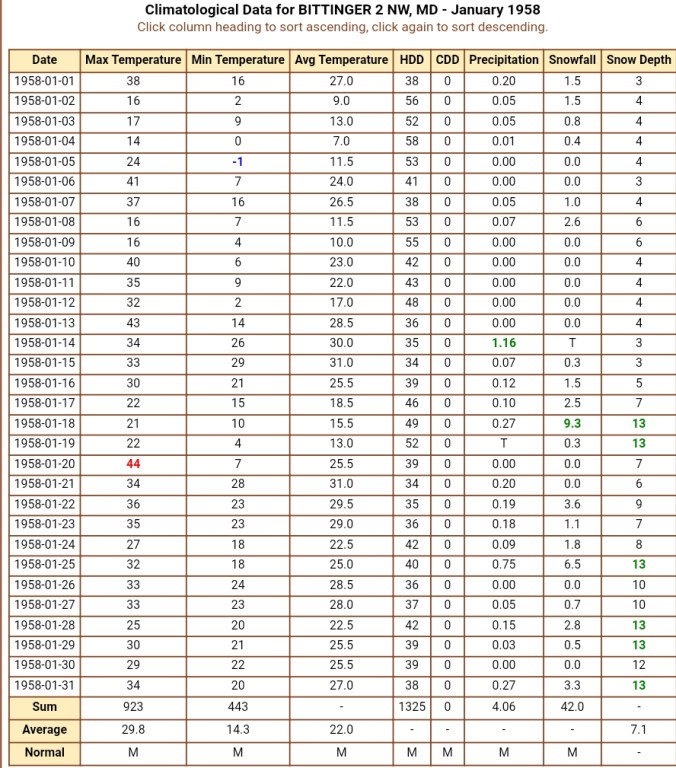
Around a month ago I was browsing through my great Aunts scrapbook of photos. I came across a message she wrote above some photos. “Winter of 1958, worse winter we had for years. We were snowed in for the whole week, mailman or milkman couldn’t get through”
Why for 1958, the worse winter in years, that is pretty significant. Stop right now. What are you picturing about that Winter? I would guess unrelenting snow? Brutal cold. None of this BS of rain, mild 40s, 50s. That’s back when winters were winters November until spring. In reality, that in most cases is a false image that is rare in this part of the country. Let’s look at that winter of 57-58. Why was it so bad?
It started out I bet gangbusters
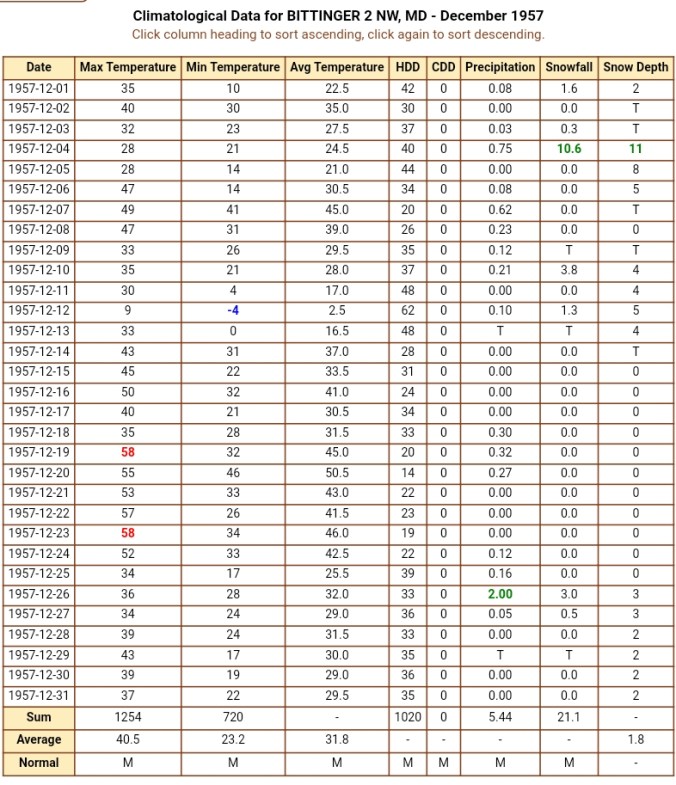
Oh…a November that was much warmer than this year. Snow sparse, minimal days with any cover. Temps routinely in the 50s. Ehh, November is early. December no doubt turned around…
Bare ground for Christmas, 6 days of 50s and plenty of rain leading up to Christmas day. We end December with 5.4″ of precip on the month, we stand at 26.2 inches of snow on the season. We just ended this December at this site using midnight obs time with 5.4″ of precip and I stand at 25.2″ on the season. This December overall was colder than the 57 December.
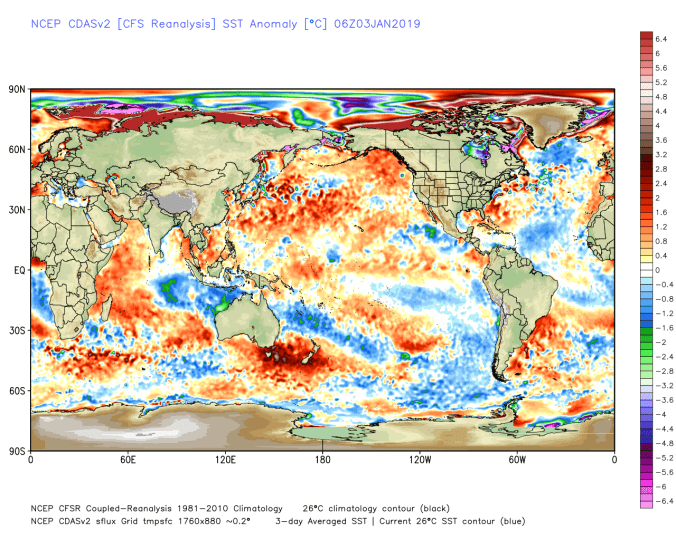
What did those SST anomalies look like. The Dec-Feb blend had a fairly healthy Nino, weakening to a modiki Nino look , a warm NE Pacific., cooler towards the dateline, cooler west coast of Australia… that should been a cold signal. It wasn’t one early December was well above.
This year we have , warm NE Pacific, a overall warmer north Pacific, but a small below anomaly area near the dateline at 40N at the dateline. That should be enough as wave lengths shorten to get some trough digging, near the dateline,ridge pumping east of that into Alaska and western Canada and we lose the broad fast west to east flow. One bugaboo, I dislike which I think helps delay the trough going east, the cooler waters off the west coast of Mexico and coolish vs its surroundings off Cali, helps to continue to reform allowing that trough to reposition in the SW, and that helps keep the heights pumped up along SE coast. As wave lengths shorten, and the north Pacific pattern evolves, cold comes. That SE weakens and becomes a friend vs foe as it is now. What hurts at one period, helps another.
So in January of 58, if it was the worse winter in years, it no doubt had to turn fast. We ( I wasnt alive yet, so they) did run a cold spell for early month, but mainly dry, and that gave way to favorable snow pattern in the 15-20th period. So it took until week 3 of January until good snows came, and a consistent active snow pattern arrived.
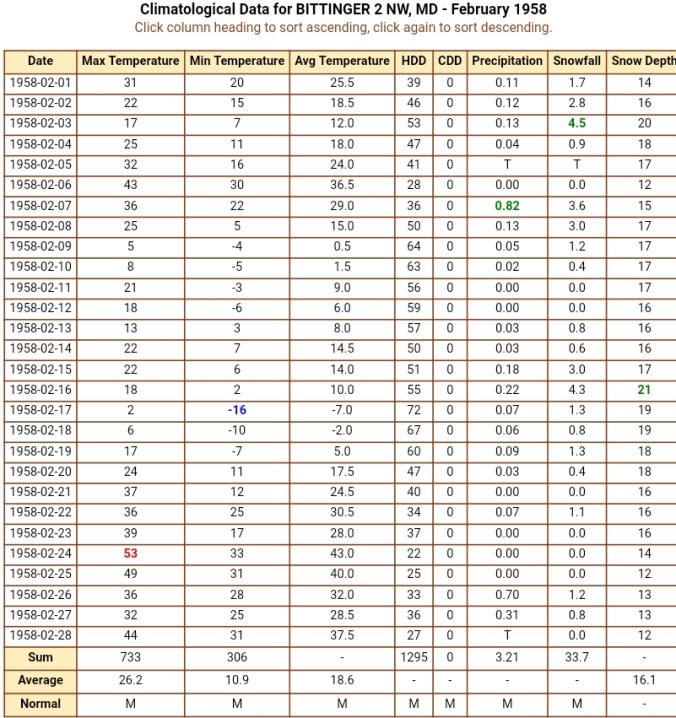
In February , now that’s what I’m talking about. Minimizing mild temps and holding a snowpack now for a month and a half by the end if the month.
But wait, theres more, March remained in an active period. Typically modoki el Ninos back winter off in March, but just as multiple good ingredients do not equal a good start to winter, one bad ingredient towards the end of the season doesn’t wipe out other good factors. That is the north Pacific for late winter. I think that warmth there is a bigger factor for cold as we go later in the season.
While this zonal flow was expected, it’s now also much longer lived than expected, and is depressing the minds of those winter lovers, but do you think anyone who lived the winter of 57-58 recalls much what occured November, December, and the brown wet warm 50s Christmas week? A Cold but mainly dry Jan start. Not at all. For a ” worse winter” in years , and having it occur mid Jan through March, it shows how 6-8 weeks of good winter erased the memory of the start… this is what the images left in the minds of those folks are for winter 58…
This is not saying we are going to that. We do not have a pattern that in any way is far different than what delivered that. We have a pattern that can deliver a good week 3 Jan through March (Anything earlier is a bonus) and put some snowy images in your mind when all is said and done that 18-19 was one to remember. Only time will tell.
Cloudy, falling temps after a very mild overnight. Some periods of fog and drizzle
Temp profile this afternoon
Radar with estimates 9pm-9pm. Since 7am yesterday through this morning Bittinger 2nw picked up .57. With .56 of that prior to midnight last night. Refer to month summary on yesterday’s post. 7am standard obs.
Satellite
Flow
Surface features and 500mb height anomalies and flow
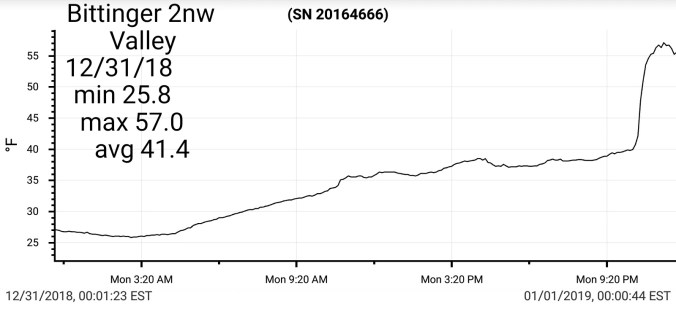
Cloudy, rainy… precip began in some valleys with temps below 32°. Bittinger 2nw Valley was one of the areas before temps crept just above freezing and held 30s during the entire daylight period. Showers through the day, some dense fog in the afternoon. Temps much milder south n west. At the time of this posting, the warmer air is ready to overtake the areas prior to midnight, and will give numbers unreflective of the day.
Temp profile this afternoon…
Radar with estimates 9pm-9pm
Satellite this afternoon
Flow
Surface features and 500mb height anomalies and flow..
Today’s 3km Nam, ICON models doing a great representation of temperature reality. The NWS grid, which I’ve documented time and time again fails at this setup. Upper 40s for the afternoon was +10 vs reality.
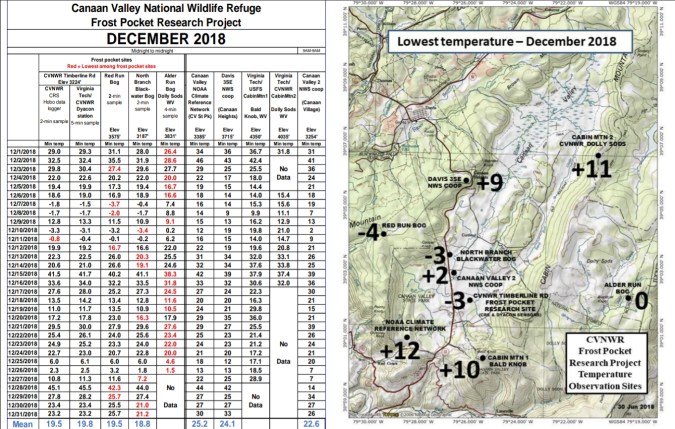
December summary
Temps:
Bittinger 2nw Valley:
Spruce Knob
Frost pocket data compiled by Dave Lesher
Precipitation:
… At Bittinger 2nw/ cocorahs Accident 3.9 E finished December with 5.45″ using midnight obs time. With .56 for December 31 at midnight. Stations officially use 7am times therefore 12/31 rain goes in the books for Jan 1. The station will officially end with 4.93″
Elsewhere using same guidelines except airports use midnight to midnight, therefore yesterdays rainfall included in 2018 for those particular sites:
Snowfall- At Bittinger 2nw Valley I finished with 11.1″ on the month. At Bittinger 2nw/cocorahs Accident 3.9E, also finished with 11.1″. My theory is during high wind, fluff events my tallies will be higher at the valley site due to higher ratio, and less breakdown of snowfall. Each amount is correct. Lots of factors in snowfall data.
On the season I stand at 25.2″, Canaan Heights at 36″ and the season to date map looks pretty good for accuracy
2018 Summary Data
Temps- With the wet year, temps did what you would expect temps to do with lots of cloud cover and precip. Daytime maxes overall slightly below normal, overnight mins above normal and the mean in the area average to slightly above.
Bittinger 2nw Valley Max temp of 2018 was 85.0 on July 4th, and the min temp was -16.0 on January 7th.
Precipitation….WET. WET. WET. That will be how 2018 gets summarized and will be a year to remember in that regard..Most stations running 20″+ over normal. Interesting to note Bayards record years in the late 20s. Questionable IMO.
Few chosen river gauges- Blackwater River at Davis, and Cassleman River at Grantsville. Only a few brief spells where they actually did fall below normal this year. Most of the year as you would expect was well above. During the rain event in September, the Cassleman gauge went above 4000cfs for only the 5th time in the gauges history….


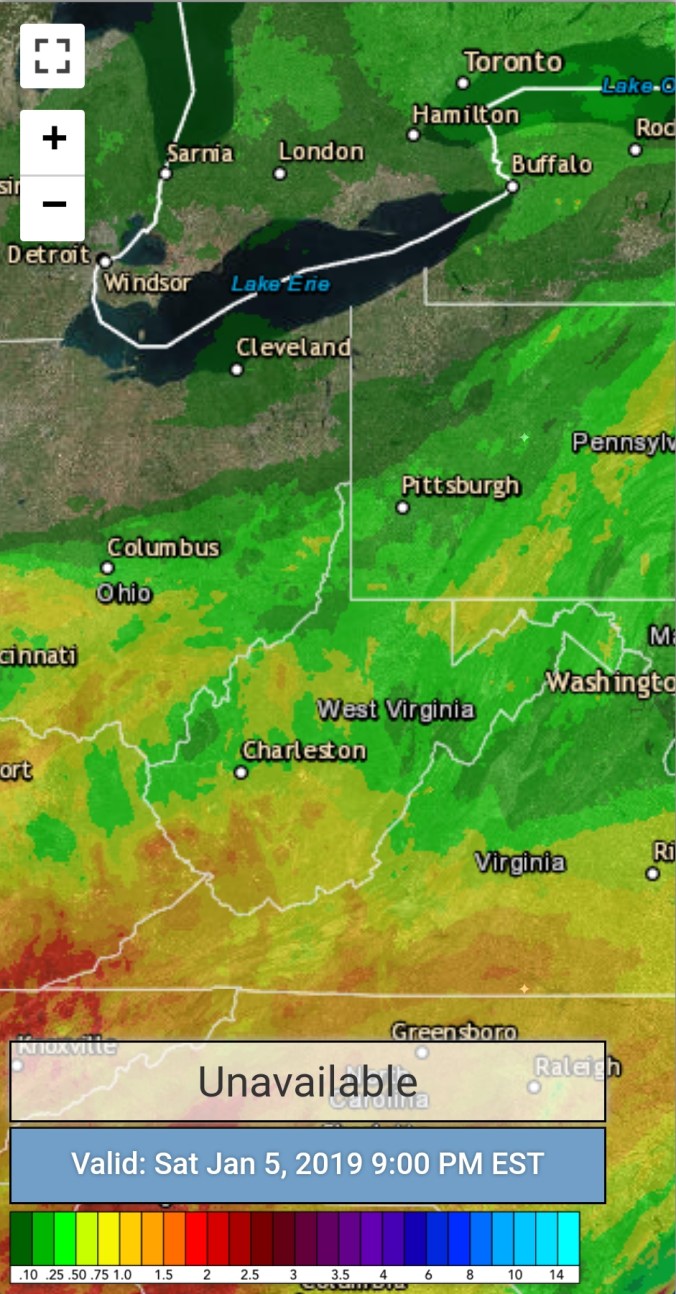


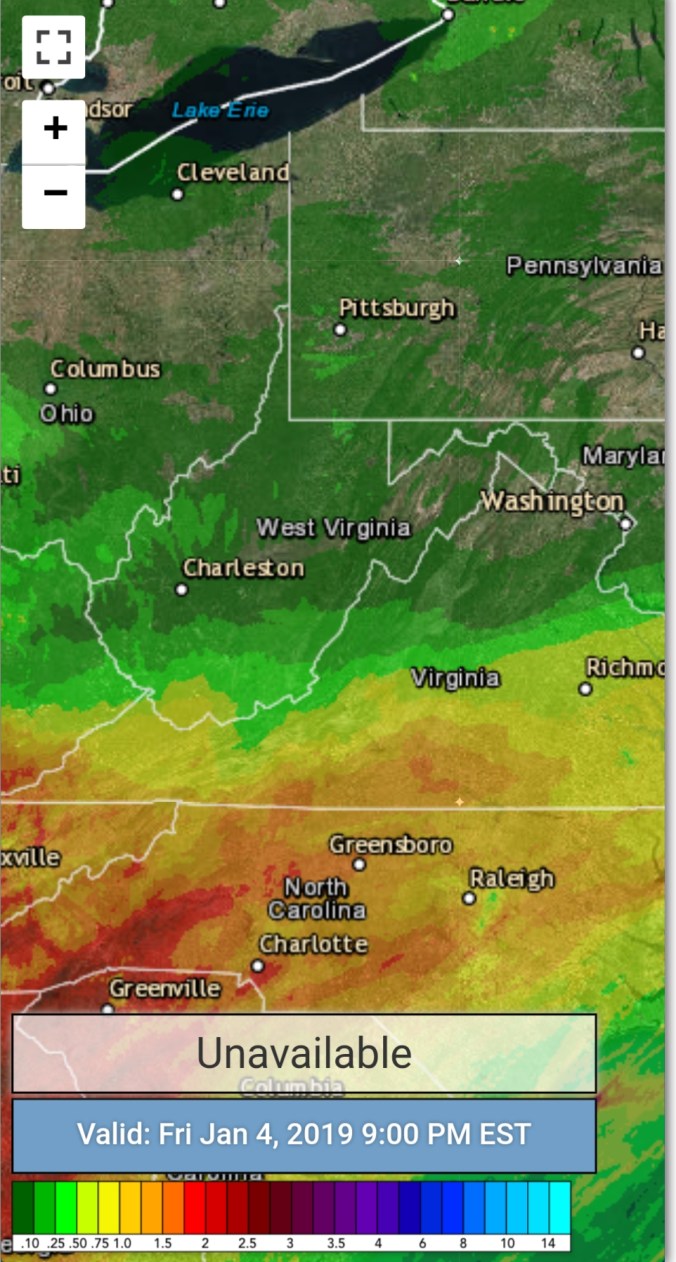


 Radar with estimates 9pm-9pm. Since 7am yesterday through this morning Bittinger 2nw picked up .57. With .56 of that prior to midnight last night. Refer to month summary on yesterday’s post. 7am standard obs.
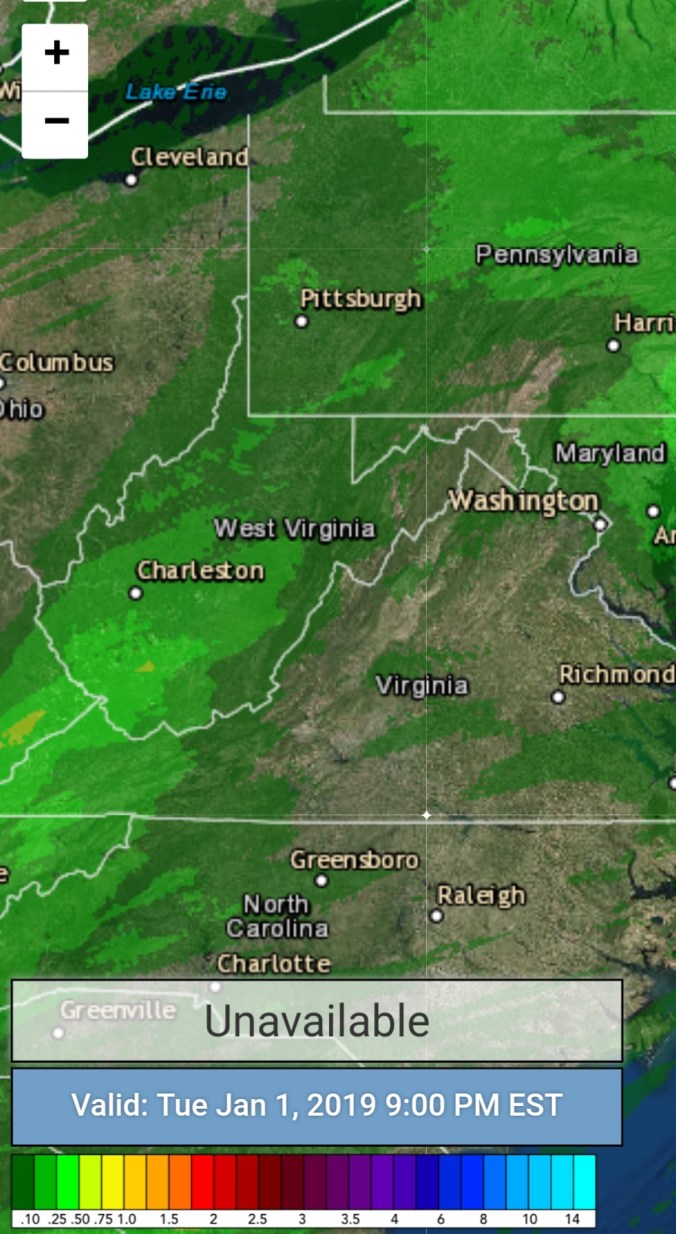


 Radar with estimates 9pm-9pm